Closing the Gap Annual Data Compilation Report July 2023
Contents
- Summary
- 1. How progress is monitored under the Agreement
- 2. Monitoring the implementation of the Priority Reforms
- 3. Monitoring progress toward achieving the socio-economic outcomes
- Attachment A: Measurement and data quality issues to be considered when interpreting results for the targets
- Attachment B: Summary of progress across Priority Reform areas Dashboard snapshots
- Attachment C: Summary of progress across socio-economic outcome areas Dashboard snapshots and data for download
- About the Productivity Commission
- Copyright and publication detail
Summary
This is the third Annual Data Compilation Report monitoring progress under the National Agreement on Closing the Gap (the Agreement).
How progress is monitored
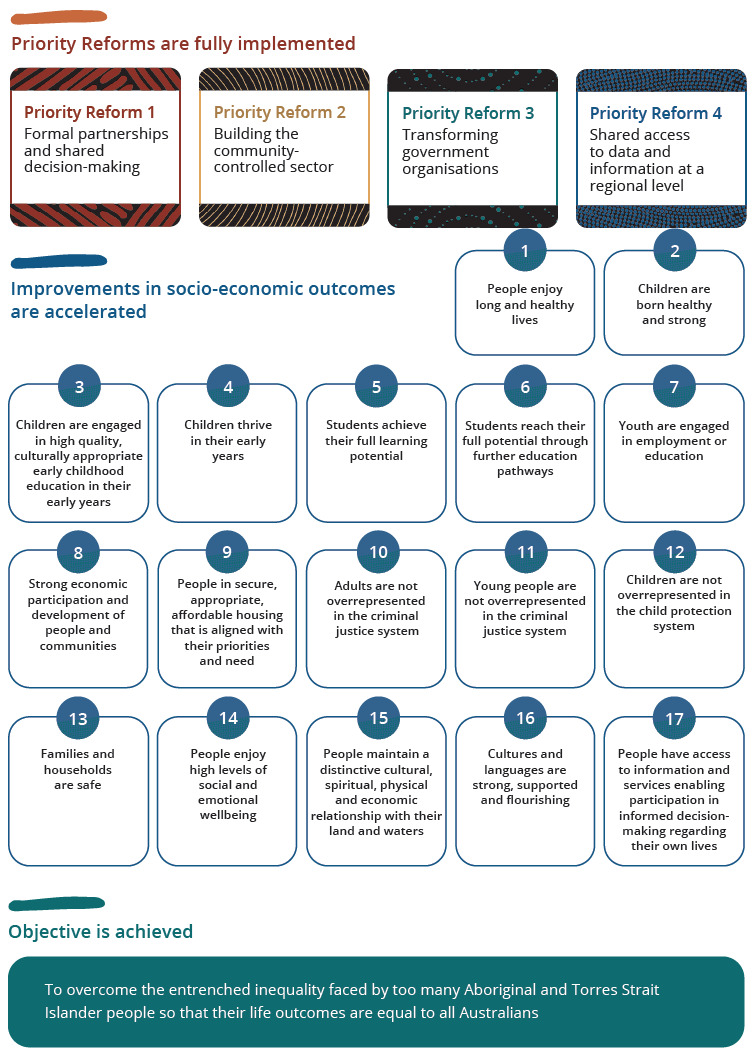
The Agreement is structured around a central objective:
‘… to overcome the entrenched inequality faced by too many Aboriginal and Torres Strait Islander people so that their life outcomes are equal to all Australians’ (clause 15).
To achieve this objective, the Agreement aims to implement four Priority Reforms to change the way governments work with Aboriginal and Torres Strait Islander people. It is expected that this will accelerate improvements in the lives of Aboriginal and Torres Strait Islander people.
Following this logic, this report monitors the implementation of the Priority Reforms to see if governments have fulfilled their commitments, and monitors the socio-economic outcomes experienced by Aboriginal and Torres Strait Islander people to see if they are improving as a result.
Gaps in the data
Even though the Priority Reforms are the foundation of the Agreement, there is no data to monitor whether they are being implemented. Work to develop this data is still in its early phases. Since the last report, the National Indigenous Australians Agency and the Coalition of Peaks have engaged an organisation to do this measurement work, which at the time of preparing this report was anticipated to commence in June 2023.
Data gaps also prevent progress for four of the 19 socio-economic targets being assessed: ‘community infrastructure’, where no data have been collected, and ‘family violence’, ‘strength of languages’ and ‘access to information’ where no updates are available since the start of the Agreement.
Latest results
The socio-economic outcomes reported for Aboriginal and Torres Strait Islander people need to be understood in context. Colonisation and subsequent discriminatory government policies have had a significant impact on Aboriginal and Torres Strait Islander people, communities, and cultures. This has negatively affected Aboriginal and Torres Strait Islander people’s health and wellbeing as reflected in the data results presented in this report.
Progress towards the 15 targets that can be assessed has been limited, with only four on track to be met. Despite this, outcomes are improving for most targets. Of the four targets that are on track, three have had annual improvements close to double what is needed. Moreover, seven of targets that are not on track are nevertheless improving.
However, outcomes are getting worse for Aboriginal and Torres Strait Islander people in four target areas. Rates of adult imprisonment, children in out-of-home care, and suicide have all increased, and children’s early development outcomes at the start of school have declined.
The progress of states and territories
Overall, it appears that some jurisdictions are contributing more towards progress to the national target outcomes than others. However, these assessments of progress need to be qualified, as there are no formal ‘targets’ to assess state and territory progress against. For example, while Western Australia has improved across most targets and often at an above average rate with no jurisdictional targets, it is not possible to assess if this contribution was adequate.
Worsening outcomes in some jurisdictions are cause for concern. The Northern Territory's outcomes worsened across eight target areas in which it was already performing relatively poorly at the starting point. For Victoria and South Australia, outcomes for ‘children in out-of-home care’ were below the national average performance when this target was established and have worsened substantially since. For South Australia, outcomes for adult imprisonment have been similarly poor.
Outcomes can vary across population groups
Outcomes can also vary for Aboriginal and Torres Strait Islander people across population groups. Often people in groups with worse outcomes experience additional barriers; for example, mobility limitations for people with disability or not having access to key services or infrastructure if living in very remote areas. While living in more disadvantaged areas or experiencing disability does appear to lead to worse outcomes overall, most outcomes have improved over time. However, for people living in more remote areas where barriers can be significant, outcomes are worse overall and typically do not improve over time alongside the national improvements.
Supporting indicators
Reporting on the socio-economic outcome targets is supplemented by a range of supporting indicators, which provide information on the factors driving the target outcomes and other important context. These indicators can be especially useful in areas without recent assessments of progress or for areas that are moving backwards. For example, for life expectancy the most recent target data is old, but is more recent for the supporting indicators. The more recent data provide a concerning indication that the life expectancy gap may widen in future.
However, some supporting indicators lack a clear purpose and this can make them difficult to interpret. Furthermore, several supporting indicators lack data either partly or entirely. This is a particular concern for reporting on socio-economic outcome area 13 ‘family safety’, with no assessment of progress for the target or data for the supporting indicators. This means at the national level there is no way of knowing through the available data if Aboriginal and Torres Strait Islander families have been getting safer over the past five years.
Priority Reform targets
|
Phases for developing measurement |
Partnership arrangements in place between Aboriginal and Torres Strait Islander people and governments enshrining joint decision-making |
Increase the amount of government funding going through Aboriginal and Torres Strait Islander community-controlled organisations |
Decrease the proportion of Aboriginal and Torres Strait Islander people who experience racism |
Increase the number of regional data projects to support Aboriginal and Torres Strait Islander communities to make decisions |
|---|---|---|---|---|
|
Phase One: Develop and agree on an approach for developing measurement |
complete | complete | complete | complete |
|
Phase Two: Develop and agree on the measurement concepts and computation |
in progress | in progress | in progress | in progress |
|
Phase Three: Develop data for reporting on the measures |
not started | not started | not started | not started |
|
Phase Four: Collect the data for reporting |
not started | not started | not started | not started |
|
Phase Five: Report data and build the time series |
not started | not started | not started | not started |
Socio-economic targets^
Data availability and latest assessments of progress, at June 2023
 71.6 years is the life expectancy of
males born in 2015–2017
75.6 years is the life expectancy of females born in 2015–2017
89.0%* of babies were born with a healthy birthweight in 2020
 99.2%* of children were enrolled
in preschool in 2022
 34.3% of children commencing school were developmentally on track in 2021
68.1%* of people aged 20–24 years had attained Year 12
or equivalent in 2021
47.0%* of people aged 25–34 years had completed a tertiary qualification in 2021
58.0%* of people aged 15–24 years were fully engaged in employment, education or training in 2021
55.7%* of people aged
25–64 years were employed in 2021
81.4%* of people were living in appropriately sized
housing in 2021
 No data on households receiving essential services is available
2,151.1 per
100,000* adults in prison in 2022
28.3 per 10,000* young people were in detention in 2021-22
56.8 per 1,000* children were in
out-of-home care in 2022
 8.4% of females experienced physical or threatened physical harm in 2018-19
27.1 per
100,000* people took their
own life in 2021
4,138,356 km2
of land*
91,111 km2
of sea country*
were subject to Aboriginal and Torres Strait Islander
people’s rights or interests in 2022
123 Aboriginal and Torres Strait Islander languages were spoken in 2018-19
73.5% of people accessed the
internet in their home in 2014-15
| Legend |
Good improvement and on track |
Improvement but not on track |
Worsening, not on track |
|
No assessment available but baseline data available |
No assessment or baseline data available |
* New update available |
^ Results relating to the Aboriginal and Torres Strait Islander population. Assessments measure progress towards each target since the baseline year, based on the latest available data.
The Agreement is structured around a central objective:
‘… to overcome the entrenched inequality faced by too many Aboriginal and Torres Strait Islander people so that their life outcomes are equal to all Australians’ (clause 15).
Under the Agreement, all the parties have committed to ‘mobilising all avenues and opportunities available to them’ (clause 16) to achieve this objective. Because this objective is broad and complex, the parties have also committed to specific outcomes against which progress can be measured (clause 17).
- Priority Reform outcomes – four outcomes related to reforming the way that government works to ‘accelerate improvements in the lives of Aboriginal and Torres Strait Islander people’ (clause 25).
- Socio-economic outcomes – outcomes important to the rights, wellbeing and quality of life of Aboriginal and Torres Strait Islander people. Currently there are 17 socio-economic outcomes identified across a range of life areas including health, education, employment, housing, safety, and strength in culture and language.
The aim of the Agreement is to fully implement the Priority Reforms, which will support an accelerated improvement in the socio-economic outcomes (clause 25), so that the objective can be achieved (figure 1.1). Monitoring the implementation of the Priority Reforms will indicate if the parties have done what they committed to, and monitoring the socio-economic outcomes will indicate if life outcomes for Aboriginal and Torres Strait Islander people are improving as a result.
Figure 1.1 – Logic of the framework for measuring progress
Monitoring progress toward achieving the outcomes
An agreed set of targets and indicators are used to monitor progress toward achieving the outcomes (figure 1.2). The targets are the key accountability measures for monitoring progress under the Agreement (clauses 81 and 82), but the Agreement also identifies supporting indicators. Under the socio-economic outcomes, these indicators provide information on the drivers of the outcomes and further context (for example, rates of access and use of health services as a supporting indicator for the ‘life expectancy’ target).
To monitor how well the objective and outcomes are being achieved for all Aboriginal and Torres Strait Islander people, the Agreement identifies different population groups, including cohorts experiencing vulnerability, for whom data is disaggregated (for example, people with disability).
In some cases, important information to understand progress is not currently available, so the Agreement includes data development items (which relate to both additional indicators and disaggregations). Work to develop these items is currently underway.1
Figure 1.2 – Monitoring progress toward achieving the outcomes
Outcome
What are we trying to achieve?

Target
Are we making progress towards the outcome?

Indicator
What else do we need to measure to assess if we are making progress?

Data development items
What else do we need to measure but currently cannot?
The public implementation and accountability processes
The public implementation and accountability processes of the Agreement (sections 8 and 9) aim to make the parties accountable for progress and implementing the agreed upon actions.2
The Closing the Gap Dashboard (the dashboard) and this Annual Data Compilation Report (this report) are elements of this public accountability framework and focus on:
- data that provide a numeric result for the targets and indicators; for example, numbers, rates and proportions
- information that assists with understanding and interpreting this data; for example, technical specifications that show how the targets and indicators were estimated and quality issues.
While the dashboard and this report use this data and information to monitor progress to improve outcomes from a numeric perspective, they do not assess the specific actions proposed by the parties to improve these outcomes, or whether these actions are adequate. This is the role of the other accountability tools, including:
- the annual reports prepared by each of the parties setting out their progress under the Agreement and their implementation plans (clause 118)
- two independent but complementary three-yearly reviews, one by the Productivity Commission (the Commission) and the other led by Aboriginal and Torres Strait Islander people (clauses 121−128).
However, the data and information on the dashboard and in this report can inform these other accountability tools and shape the implementation of the Agreement. If progress toward an agreed outcome is not meeting expectations − that is, a numeric result for a target in this report indicates it is not on track, actions to address this lack of progress are to be included in jurisdictional implementation plans (clause 91).3
Information currently available for monitoring progress
Information for the dashboard and this report is being developed in stages. This is the third report monitoring progress under the Agreement. Since the last report (July 2022), two dashboard updates have been released (March and June 2023). This report provides a snapshot of the results available as at 30 June 2023 (attachments B and C).
Work has begun to develop reporting for the Priority Reform outcome areas, but data is not yet available (section 2 and attachment B).
The data or information released since the last report for the socio-economic outcome areas comprises:
- an additional year of data and new assessments of progress for 13 targets – 2, 3, 5, 6, 7, 8, 9A, 10, 11, 12, 14 and 15A and 15B
- new state and territory data for target 16
- new disaggregations of data for five targets – 5, 6, 7, 8, and 9A
- data for 21 supporting indicators – across outcome areas 1, 2, 3, 4, 6, 7, 8, 9, 10, 11, 12, 14, 15, 16 and 17. Development work has been undertaken for two additional indicators in outcome area 13.
The Priority Reforms are the foundation of the Agreement, with the parties agreeing they are the key vehicle for improving the socio-economic outcomes and achieving the objective. In this way, the Agreement differs from the previous agreement (the National Indigenous Reform Agreement), which focussed on and solely monitored socio-economic outcomes.
The Priority Reforms commit the parties to actions that change the way governments work with Aboriginal and Torres Strait Islander people, organisations and communities (clause 25). These actions also prioritise and promote Aboriginal and Torres Strait Islander cultures (clauses 21 and 22). The Agreement includes jurisdictional and partnership actions (covering all parties to the Agreement), and jurisdictions (the Australian, state and territory governments) have committed to include ‘actions to achieve the Priority Reforms’ (clause 108(d)) in their implementation plans.
The importance of monitoring the Priority Reforms
Although monitoring the socio-economic outcomes is important and will continue, direct monitoring of the Priority Reforms is a key part of the new approach in the Agreement.
Directly monitoring the implementation of the Priority Reforms will help to hold governments accountable for their actions under the Agreement. For each Priority Reform outcome area, progress is monitored through:
- targets that ‘focus on measuring the change governments are making in the way they work with Aboriginal and Torres Strait Islander people’ (clause 79 and table 2.1)
- supporting indicators that provide ‘greater understanding of, and insight into, how all governments are tracking against the outcomes and targets’ (clause 81(b)(iii)).
Because the Priority Reforms are relatively new, developing ways to measure their progress is still ongoing. Measures and data for the targets and indicators are yet to be developed (attachment B).
|
Priority Reform areas |
Outcome |
Target |
|---|---|---|
|
Priority Reform 1 Formal partnerships and shared decision-making |
Aboriginal and Torres Strait Islander people are empowered to share decision-making authority with governments to accelerate policy and place-based progress on Closing the Gap through formal partnership arrangements. [clause 17(a)]. |
There will be formal partnership arrangements to support Closing the Gap in place between Aboriginal and Torres Strait Islander people and governments in place in each state and territory enshrining agreed joint decision-making roles and responsibilities and where Aboriginal and Torres Strait Islander people have chosen their own representatives [clause 81(a)(i)]. |
|
Priority Reform 2 Building the community-controlled sector |
There is a strong and sustainable Aboriginal and Torres Strait Islander community-controlled sector delivering high quality services to meet the needs of Aboriginal and Torres Strait Islander people across the country [clause 17(b)]. |
Increase the amount of government funding for Aboriginal and Torres Strait Islander programs and services going through Aboriginal and Torres Strait Islander community-controlled organisations [clause 81(a)(ii)]. |
|
Priority Reform 3 Transforming government organisations |
Governments, their organisations and their institutions are accountable for Closing the Gap and are culturally safe and responsive to the needs of Aboriginal and Torres Strait Islander people, including through the services they fund [clause 17(c)]. |
Decrease in the proportion of Aboriginal and Torres Strait Islander people who have experiences of racism [clause 81(a)(iii)]. |
|
Priority Reform 4 Shared access to data and information at a regional level |
Aboriginal and Torres Strait Islander people have access to, and the capability to use, locally relevant data and information to set and monitor the implementation of efforts to close the gap, their priorities and drive their own development [clause 17(d)]. |
Increase the number of regional data projects to support Aboriginal and Torres Strait Islander communities to make decisions about Closing the Gap and their development [clause 81(a)(iv)]. |
a This table includes a subset of information on the Priority Reforms that is in the Agreement. Section 6 of the Agreement outlines the actions that have been committed to under the Agreement (for example, under Priority Reform 4 government parties committed to ‘share available, disaggregated regional data and information with Aboriginal and Torres Strait Islander organisations and communities on Closing the Gap, subject to meeting privacy requirements’ (clause 72(a)). While table A includes indicators relevant to each Priority Reform (for example, an indicator for Priority Reform 4 is ‘Number of formal data sharing partnerships established between government agencies and Aboriginal and Torres Strait Islander people/organisations’).
Getting measurement of the Priority Reforms right
Given the importance of implementing the Priority Reforms, developing measurement to monitor this is a priority. As this measurement is new and being done from scratch, to ensure it is finalised as quickly as possible and reflects the perspectives of Aboriginal and Torres Strait Islander people it needs adequate resourcing and collaborative effort between the parties.
Work on developing this measurement is underway. In the early phases, the measurement needs to be developed in a consistent and coherent way across the Priority Reforms. It also requires building a common understanding across the parties about how each target and indicator should be measured.
The parties agreed an approach to this work in 2021-22. Developing this approach was phase one. Three subsequent phases are to be completed before the final phase, which is the reporting of data on the Priority Reform targets and supporting indicators (box 2.1). This report will continue to monitor the progress of the parties across these phases and include data on the targets and indicators as it becomes available.
Box 2.1 – Five phases for developing measurement of the Priority Reforms
The approach that the parties are taking to develop measurement of the Priority Reform targets and indicators has five broad phases.
Phase One
Parties develop and agree an approach for developing measurement of the Priority Reform targets and supporting indicators.
Phase Two
Parties develop and agree on the measurement concepts and calculations: identify and define key concepts and describe how the measures will be calculated, that is how will they be put together (for example, numerator and denominator, and calculations).
Phase Three
Parties develop data for reporting on the measures: develop and agree counting rules that align with the agreed definitions for the concepts, and identify potential data sources either from an existing source or the mechanism to collect them.
Phase Four
Data custodians collect the data for reporting: collate and validate the data and document any concerns with the measurement of indicators (for example, is it a proxy for the indicator) or data quality issues.
Phase Five
Productivity Commission reports the data and builds a time series for reporting.
Work also began in 2021-22 to develop ‘measurement concepts and calculations’ across the Priority Reforms (phase two). This work was undertaken through the Partnership Working Group, which includes all Australian governments and the Coalition of Peaks. The Partnership Working Group determined that this initial work was useful, but that further expertise was required in the form of specific technical skills and cultural expertise.
In early June 2023, the Partnership Working Group provided its latest update to the Productivity Commission on the status of this measurement development. This follows the commencement in late 2022 of a request for quarterly updates by the Productivity Commission.
The update stated that the National Indigenous Australians Agency and the Coalition of Peaks were working in partnership to engage the required expertise to progress development of the measures for all Priority Reforms. This work is to include developing measurement concepts, describing how measures will be calculated, and identifying potential data sources from existing sources or detailing the mechanism to collect new data where required. An organisation has been engaged to do this measurement work, which at the time of preparing this report was due to commence in June 2023.
The socio-economic outcomes focus on the experience of Aboriginal and Torres Strait Islander people in key life areas that are important for wellbeing. These life areas cover those that support cultural wellbeing; that is, strength of cultures and languages, access to land and waters, and culturally relevant communications (clause 23), and other areas such as education, employment, health, and experiences with the criminal justice system.
Assessing progress toward these socio-economic outcomes will indicate if the lives of Aboriginal and Torres Strait Islander people are improving under the Agreement, and whether this improvement is accelerating.
The national targets are the key measures for assessing progress for the socio-economic outcomes. This report provides an update on progress since the baseline year towards these targets, using the latest available data on the dashboard (at June 2023). A target is a ‘specific, measurable goal’ for an outcome (clause 82(b)), that Aboriginal and Torres Strait Islander people will benefit from in future (at a year specified in the Agreement). The targets are to be met at the national level, and are highly aggregated to this level. Even if they are met, outcomes are likely to vary across states and territories, and population groups (results for these disaggregations follow reporting on the national target results).
Understanding the socio‑economic outcomes in context
The socio-economic target outcomes reported for Aboriginal and Torres Strait Islander people need to be understood in context. Colonisation and subsequent discriminatory government policies have had a devasting effect on Aboriginal and Torres Strait Islander people, communities, and cultures. This history and the ongoing impacts of ‘entrenched disadvantage, political exclusion, intergenerational trauma and ongoing institutional racism’ (clause 2) has affected the social determinants of health and wellbeing for Aboriginal and Torres Strait Islander people and consequently the socio‑economic outcomes presented in this report. Aboriginal and Torres Strait Islander people can experience poorer outcomes due to:
- a higher prevalence of personal risk factors associated with poorer outcomes. These risk factors have been transmitted across generations through the trauma and exclusion caused by colonisation and subsequent government policies and programs, which have caused hardship for Aboriginal and Torres Strait Islander people, including through the loss of lands, waters and cultures
- being affected by structural or systemic barriers, because of the disadvantage now experienced
- the ongoing experience of discrimination and racism, which creates barriers to better outcomes and diminishes physical and mental wellbeing4
Under the National Agreement, governments have committed to fully implement the four Priority Reforms to address structural or systemic barriers, and positively impact the Closing the Gap target outcomes.
Progress towards achieving the national targets
Progress across the national targets has been limited. Of the 19 national targets (across the 17 socio-economic outcome areas), 15 had an assessment of progress, and of these only four were on track to be met (targets 3, 8, 11 and 15A), with the remaining 11 ‘not on track’ (targets 1, 2, 4, 5–7, 9A, 10, 12, and 14 and 15B).
Despite this, good progress has been made towards achieving some targets. Of the four targets that were on track, three had annual improvements that were close to double what is needed to meet the target in future (targets 3, 11 and 15A). For target 15A ‘land mass subject to legal rights and interests’, if the recorded annual improvement continues, the target will be exceeded by 2026 (five years ahead of schedule). For target 3 ‘preschool enrolment’, reported rates rose every year since the baseline and the final target value, to be met in 2025, has already been exceeded (although the estimated annual change may be overstated for quality reasons which are covered in attachment A). With these improvements, Aboriginal and Torres Strait Islander children are now more likely to be enrolled in preschool than non-Indigenous children. While the annual improvement was more modest for adult employment (target 8), the gap to non-Indigenous people has also narrowed. This narrowing implies that improvements in Aboriginal and Torres Strait Islander adult employment rates are due to more than improvements in overall economic conditions conducive to higher employment levels.
Moreover, most of the targets that were assessed as ‘not on track’ were progressing in the right direction. Of the 11 targets ‘not on track’, seven showed improvement and while these improvements need to accelerate for the target to be met, there are positive signs.
- For Aboriginal and Torres Strait Islander young people qualification levels increased (target 5 ‘year 12 or equivalent’ and target 6 ‘Certificate level III or above’), as did engagement in employment, education or training (target 7 ‘youth engaged in employment or education’). These improvements were enough to narrow the gap to non-Indigenous young people across all three targets.
- More Aboriginal and Torres Strait Islander people are now living in appropriately sized housing (target 9A), and the estimated annual change to date (0.51 percentage points) is close to what is needed for the target to be met (0.61 percentage points), with the gap to non-Indigenous people narrowing.
While most of the targets have moved in the right direction, four targets showed areas that were getting worse for Aboriginal and Torres Strait Islander people:
- Rates of adult imprisonment (target 10), children in out-of-home care (target 12), and suicide (target 14) all increased since the baseline, along with overrepresentation relative to non-Indigenous people.
- Children’s early development outcomes at the time of starting school also declined (target 4), and the gap to non-Indigenous children widened.
For four targets, the data needed for assessing progress is not collected. For target 9B ‘community infrastructure’, the data has not been collected for the starting point (baseline) or to provide updates on progress. For the other three targets (13 ‘family violence’, 16 ‘strength of languages’ and 17 ‘access to information’), while data for the baseline is available, more recent data is not.
A summary of the latest results for the national targets follows below. All but one of the assessments of progress below should be considered with caution. They are based on a very limited number of data points (all have less than five years of data, except target 3 ’preschool enrolment’). These results should also be considered alongside the key data availability and measurement issues outlined in attachment A. Information on how jurisdictions are progressing for each target is in attachment C.
Summary of the National Assessments
Target 1
Life expectancy is a measure of whether Aboriginal and Torres Strait Islander people are enjoying long and healthy lives. It is reported as the expected years of life at birth.
Nationally, Aboriginal and Torres Strait Islander males born in 2015–2017 are expected to live to 71.6 years and females to 75.6 years. Since the 2005–2007 baseline year, the gap in life expectancy compared to non-Indigenous people narrowed for males (from 11.4 years to 8.6 years) and for females (from 9.6 years to 7.8 years). Despite this improvement, the national target of ‘no gap in life expectancy’ is not on track to be met for males or females.
Target 2
Healthy birthweight is a measure of whether Aboriginal and Torres Strait Islander children are born healthy and strong. It is reported as the proportion of babies born with a healthy birthweight.
Nationally in 2020, 89.0% of Aboriginal and Torres Strait Islander babies born were of a healthy birthweight, which is an increase from 88.8% in 2017 (the baseline year). While this is an improvement, it is not enough for the national target of 91% to be met.
Target 3
Early childhood education enrolment rates is a measure of whether Aboriginal and Torres Strait Islander children are engaged in high quality, culturally appropriate early childhood education in their early years. It is reported as the proportion of Aboriginal and Torres Strait Islander children in the Year Before Full-time Schooling (YBFS) age cohort who were enrolled in a preschool program.
Nationally in 2022, 99.2% of Aboriginal and Torres Strait Islander children in the YBFS age cohort were enrolled in a preschool program, which is an increase from 76.7% in 2016 (the baseline year). This is a good improvement with the national target of 95% on track to be met.
Target 4
Childhood development is a measure of whether Aboriginal and Torres Strait Islander children are thriving in their early years. It is reported as the proportion of Aboriginal and Torres Strait Islander children assessed as developmentally on track in all five domains of the Australian Early Development Census (AEDC).
Nationally in 2021, 34.3% of Aboriginal and Torres Strait Islander children commencing school were assessed as being developmentally on track in all five AEDC domains, which is a decrease from 35.2% in 2018 (the baseline year). This is a worsening in the result, with the national target of 55% not on track to be met.
Target 5
High school completion is a measure of whether Aboriginal and Torres Strait Islander students achieve their full learning potential. It is reported as the proportion of Aboriginal and Torres Strait Islander people (aged 20–24 years) attaining year 12 or equivalent qualification.
Nationally in 2021, 68.1% of Aboriginal and Torres Strait Islander people aged 20–24 years had attained year 12 or equivalent, which is an increase from 63.2% in 2016 (the baseline year). While this is an improvement, it is not enough for the national target of 96% to be met.
Target 6
Completion of a tertiary qualification is a measure of whether Aboriginal and Torres Strait Islander students reach their full potential through further education pathways. It is reported as the proportion of Aboriginal and Torres Strait Islander people aged 25–34 years who have completed a tertiary qualification (Certificate level III and above).
Nationally in 2021, 47.0% of Aboriginal and Torres Strait Islander people aged 25–34 years had completed non-school qualifications of Certificate level III or above, an increase from 42.3% in 2016 (the baseline year). While this is an improvement, it is not enough for the national target of 70% to be met.
Target 7
Participation in the workforce and/or studies is a measure of whether Aboriginal and Torres Strait Islander youth are engaged in employment or education. It is reported as the proportion of Aboriginal and Torres Strait Islander youth (aged 15–24 years) who are fully engaged in employment, education or training.
Nationally in 2021, 58.0% of Aboriginal and Torres Strait Islander people aged 15–24 years were fully engaged in employment, education or training, an increase from 57.2% in 2016 (the baseline year). While this is an improvement, it is not enough for the national target of 67% to be met.
Target 8
Employment is a measure of strong economic participation and development of Aboriginal and Torres Strait Islander people and communities. It is reported as the proportion of Aboriginal and Torres Strait Islander people aged 25–64 years who are employed.
Nationally in 2021, 55.7% of Aboriginal and Torres Strait Islander people aged 25–64 years were employed, an increase from 51.0% in 2016 (the baseline year). This is a good improvement with the national target of 62% on track to be met.
Target 9A
Housing suitability is a measure of whether Aboriginal and Torres Strait Islander people secure appropriate, affordable housing that is aligned with their priorities and need. It is reported as the proportion of Aboriginal and Torres Strait Islander people living in appropriately sized (not overcrowded) housing.
Nationally in 2021, 81.4% of Aboriginal and Torres Strait Islander people were living in appropriately sized housing, an increase from 78.9% in 2016 (the baseline year). While this is an improvement, it is not enough for the national target of 88% to be met.
Target 9B
Access to power, water, wastewater and solid waste management is a measure of whether Aboriginal and Torres Strait Islander people secure appropriate, affordable housing that is aligned with their priorities and need. It is reported as the proportion of Aboriginal and Torres Strait Islander households that receive essential services that meet or exceed relevant standards.5
This target is currently not able to be reported against as there is no data source currently available which includes all required data elements. Therefore no assessment can be made for the national target that ‘households receive essential services that meet or exceed the relevant standards’.
Target 10
Rates of incarceration is a measure of whether Aboriginal and Torres Strait Islander adults are overrepresented in the criminal justice system. It is reported as the age-standardised rate of Aboriginal and Torres Strait Islander prisoners per 100,000 adult population.
Nationally at 30 June 2022, the age-standardised rate of Aboriginal and Torres Strait Islander prisoners was 2,151.7 per 100,000 adult population, which is an increase from 2,142.9 per 100,000 adult population in 2019 (the baseline year). This is a worsening, with the national target of a ‘reduction of at least 15% in the incarceration rate’ not on track to be met.
Target 11
Rates of youth detention is a measure of whether Aboriginal and Torres Strait Islander young people are overrepresented in the criminal justice system. It is reported as the rate of Aboriginal and Torres Strait Islander young people aged 10–17 years in detention.
Nationally in 2021-22, the rate of Aboriginal and Torres Strait Islander young people aged 10–17 years in detention on an average day was 28.3 per 10,000 young people in the population, which is a decrease from 32.0 per 10,000 young people in 2018-19 (the baseline year). This is a good improvement with the national target of a ‘decrease of at least 30% in the detention rate’ on track to be met.
Target 12
Rates of children in out-of-home care is a measure of whether Aboriginal and Torres Strait Islander children are overrepresented in the child protection system. It is reported as the rate of Aboriginal and Torres Strait Islander children aged 0–17 years in out-of-home care.
Nationally in 2022, the rate of Aboriginal and Torres Strait Islander children aged 0–17 years in out-of-home care was 56.8 per 1,000 children in the population, which is an increase from 54.2 per 1,000 children in 2019 (the baseline year). This is a worsening in the result, with the national target of a ‘reduction in the rate of out-of-home care by 45%’ not on track to be met.
Target 13
Rates of family violence and abuse against Aboriginal and Torres Strait Islander women and children is a measure of whether Aboriginal and Torres Strait Islander families and households are safe. It is reported as the rate of Aboriginal and Torres Strait Islander females aged 15 years or over who reported experiencing domestic physical or threatened physical harm.
Nationally in 2018-19, 8.4% of Aboriginal and Torres Strait Islander females aged 15 years or over experienced physical or threatened physical harm. There is no new data since the baseline meaning no assessment of progress is possible for the national target of ‘reducing all forms of family violence by at least 50%’.
Target 14
Rates of suicide is a measure of whether Aboriginal and Torres Strait Islander people have high levels of social and emotional wellbeing. It is reported as the age-standardised suicide rate for Aboriginal and Torres Strait Islander people per 100,000 people.
In 2021, the suicide rate (for NSW, Qld, WA, SA and the NT combined) for Aboriginal and Torres Strait Islander people was 27.1 per 100,000 people, which is an increase from 25.0 per 100,000 people in 2018 (the baseline year). This is a worsening, with the national target of a ‘significant and sustained reduction in suicide towards zero’ not on track to be met6.
Target 15A
Land mass subject to Aboriginal and Torres Strait Islander people’s legal rights or interests is a measure of whether Aboriginal and Torres Strait Islander people maintain a distinctive cultural, spiritual, physical and economic relationship with their land. It is reported as square kilometres of the land mass subject to Aboriginal and Torres Strait Islander people’s rights or interests.
Nationally as at 30 June 2022, 4,138,356 square kilometres of the land mass of Australia was subject to Aboriginal and Torres Strait Islander people’s rights or interests, which is an increase from 3,908,387 square kilometres in 2020 (the baseline year). This is a good improvement with the national target of a ‘15%’ increase in land mass subject to Aboriginal and Torres Strait Islander people’s rights or interests on track to be met.
Target 15B
Sea country covered by Aboriginal and Torres Strait Islander people’s legal rights or interests is a measure of whether Aboriginal and Torres Strait Islander people maintain a distinctive cultural, spiritual, physical and economic relationship with their waters. It is reported as square kilometres of sea country subject to Aboriginal and Torres Strait Islander people’s rights or interests.
Nationally as at 30 June 2022, 91,111 square kilometres of the sea country of Australia was subject to Aboriginal and Torres Strait Islander people’s rights or interests, which is an increase from 90,252 square kilometres of the sea country in 2020 (the baseline year). While this is an improvement, it is not enough for the national target of a ’15%’ increase in sea country subject to Aboriginal and Torres Strait Islander people’s rights or interests to be met.
Target 16
The use of Aboriginal and Torres Strait Islander languages is a measure of whether Aboriginal and Torres Strait Islander cultures and languages are strong, supported and flourishing. It is reported as the number and strength of Aboriginal and Torres Strait Islander languages being spoken.
Nationally in 2018-19, there were 123 Aboriginal and Torres Strait Islander languages spoken, with 14 considered strong. There is no new data since the baseline meaning no assessment of progress is possible for the national target of a ‘sustained increase in the number and strength of Aboriginal and Torres Strait Islander languages being spoken’.
Target 17
Digital inclusion is a measure of whether Aboriginal and Torres Strait Islander people have access to information and services enabling participation in informed decision-making regarding their own lives. It is reported as the proportion of Aboriginal and Torres Strait Islander people aged 15 years and over accessed the internet in their home.
Nationally in 2014-15, 73.5% of Aboriginal and Torres Strait Islander people aged 15 years or over had access to the internet in their home. There is no new data since the baseline and no comparable data for non-Indigenous people meaning no assessment of progress is possible for the national target of ‘equal levels of digital inclusion’.
States and territories contribution to improving socio-economic outcomes
As noted above, the national targets are the key measures for assessing progress. The Agreement notes that targets are be met at the national level, in recognition that the ‘starting points, past trends and local circumstances differ’ (clause 83) across states and territories. However, the Agreement also recognises that each ‘jurisdiction’s progress and contribution towards achievement of targets’ should be able to be monitored using the data on the dashboard (clause 89).
At this stage, the assessments of progress for states and territories (jurisdictions) cannot show if they have adequately contributed to meeting the national targets. While the assessments show if outcomes are worsening, have not changed, or are improving for a jurisdiction, there are currently no ‘targets’ for each state and territory.
Overall, some jurisdictions appear to be contributing more to improving outcomes than others (table 3.1). The jurisdiction that improved across the most targets was Western Australia, followed by Victoria and Queensland. And the jurisdiction whose outcomes worsened or remained the same across the most targets was the Northern Territory, followed by the Australian Capital Territory.
| Target | NSW | VIC | QLD | WA | SA | TAS | ACT | NT | Australia |
|---|---|---|---|---|---|---|---|---|---|
| Target 1 – Males | Improvement | No assessment | Improvement | Improvement | No assessment | No assessment | No assessment | Improvement | Improvement but not on track (National) |
| Target 1 – Females | Improvement | No assessment | Improvement | Improvement | No assessment | No assessment | No assessment | Worsening | Improvement but not on track (National) |
| Target 2 | Worsening | Improvement | Improvement | Improvement | Improvement | Improvement | Worsening | Worsening | Improvement but not on track (National) |
| Target 3 | Improvement | Improvement | Improvement | Improvement | Improvement | Improvement | Improvement | Worsening | Good improvement and on track |
| Target 4 | Worsening | Improvement | Improvement | Worsening | Improvement | Improvement | Improvement | Worsening | Worsening |
| Target 5 | Improvement | Improvement | Improvement | Improvement | Improvement | Improvement | Improvement | Improvement | Improvement but not on track (National) |
| Target 6 | Improvement | Improvement | Improvement | Improvement | Improvement | Improvement | Improvement | Improvement | Improvement but not on track (National) |
| Target 7 | Improvement | Improvement | Improvement | Improvement | Worsening | Improvement | Improvement | Worsening | Improvement but not on track (National) |
| Target 8 | Improvement | Improvement | Improvement | Improvement | Improvement | Improvement | Improvement | Worsening | Good improvement and on track |
| Target 9A | Improvement | Improvement | Improvement | Improvement | Improvement | Worsening | Worsening | Improvement | Improvement but not on track (National) |
| Target 9B | No assessment | No assessment | No assessment | No assessment | No assessment | No assessment | No assessment | No assessment | No assessment |
| Target 10 | Worsening | Improvement | Worsening | Improvement | Worsening | Improvement | Improvement | Worsening | Worsening |
| Target 11 | Improvement | Improvement | No change (state level) | Improvement | Improvement | Improvement | No change (state level) | Worsening | Good improvement and on track |
| Target 12 | Improvement | Worsening | Worsening | Improvement | Worsening | Worsening | No change (state level) | Improvement | Worsening |
| Target 13 | No assessment | No assessment | No assessment | No assessment | No assessment | No assessment | No assessment | No assessment | No assessment |
| Target 14 | No assessment | No assessment | No assessment | No assessment | No assessment | No assessment | No assessment | No assessment | Worsening |
| Target 15A | Improvement | Improvement | Improvement | Improvement | Improvement | No change (state level) | No change (state level) | Improvement | Good improvement and on track |
| Target 15Bb | No change (state level) | Improvement | Improvement | Improvement | Improvement | No change (state level) | No assessment | Improvement | Improvement but not on track (National) |
| Target 16 | No assessment | No assessment | No assessment | No assessment | No assessment | No assessment | No assessment | No assessment | No assessment |
| Target 17 | No assessment | No assessment | No assessment | No assessment | No assessment | No assessment | No assessment | No assessment | No assessment |
| Number of targets with an assessment of progress | 14 | 13 | 14 | 14 | 13 | 13 | 12 | 14 | 15 |
| Proportion of targets where outcomes improved | 73% | 92% | 80% | 93% | 77% | 69% | 58% | 47% | 75% |
| Legend | Good improvement and on track | Improvement but not on track (National) | Improvement | No change (state level) | Worsening | No assessment |
| Good improvement and on track | Improvement but not on track (national) | Improvement | No change (state and territory level) | Worsening | No assessment |
a Assessments measure progress towards each target since the baseline year, based on the latest available data.
b The Australian Government also contributes to meeting target 15B and have shown improvement since the baseline.
However, these contributions to improve outcomes need to be qualified. Different starting points (that is, baseline levels) and circumstances across jurisdictions are likely to influence the progress made. For example, a jurisdiction starting from a relatively poor baseline position (for example, higher rates of imprisonment or lower rates of employment relative to other jurisdictions) and faced with more difficult circumstances (such as disperse population centres with long distances between them) can see improvements, but may still be well behind the national average for the latest year’s results. Even if a jurisdiction remains below the national average, if they are improving, their contribution is still helping toward meeting the national target. However, in the absence of jurisdictional targets or a method to assess their contribution, it is not possible to confirm if it is sufficient to enable the national target to be met.
Western Australia is a good example of this. While the state was well below the national average results for most targets at baseline and remain so, they improved across all but one target, and often had one of the highest estimated annual changes. Despite this, even though Western Australia may be making an appropriate contribution to meeting the national targets, it is not possible to confirm if they are.
Furthermore, while it appears that the majority of jurisdictions need to improve for the national target to be met, even if all jurisdictions improve, it is not necessarily sufficient. For the four targets that are on track to be met (targets 3, 8, 11, 15A), all but one jurisdiction either improved or did not change from their baseline position. For two other targets (targets 5 and 6), all jurisdictions improved but the targets are still not on track to be met as the combined level of improvement was not enough.
If a jurisdiction has shown no progress or worsened for a target then it is evidently not contributing sufficiently to national progress.
One jurisdiction where the worsening outcomes are particularly concerning is the Northern Territory. The Northern Territory’s outcomes worsened across eight target indicators and in most of these they were already performing relatively poorly at baseline compared to other jurisdictions. For example, the adult imprisonment rate in the Northern Territory increased at the highest rate despite already being above the national average at baseline.
Worsening outcomes in Victoria and South Australia are also concerning in some areas. The outcomes for target 12 ‘children in out-of-home care’ have worsened substantially for both of these jurisdictions despite starting from baseline rates that were already well above the national average. Adult imprisonment showed a similar pattern in South Australia.
Further information on how jurisdictions are progressing for each target is included in attachment C.
Differences between population groups
The assessments of progress are highly aggregated, and may not reflect the outcomes for different groups of Aboriginal and Torres Strait Islander people. Outcomes may vary across groups based on the additional barriers experienced by some, such as related to location (remoteness and socio-economic status of the locality) or disability. Some personal characteristics do not necessarily create barriers, such as age and gender, but can affect outcomes (as shown through the target results outlined below).
To provide further insights, once an assessment of progress is available the targets are often disaggregated for these different population groups. Disaggregating the targets for these groups is usually fairly straightforward and consistent across targets, such as for age, gender, remoteness and socio-economic status of the locality.
However, disaggregating the targets for disability is not straightforward. Disability is often defined differently across data sets and this can make deriving the target data difficult. For data on preschool enrolments and out-of-home care, disability is not well defined or consistently collected across states and territories. Consequently, it is not possible to derive the population of people with disability needed to report the rates that would match the target. For targets based on Census data, this is not an issue and disaggregations of the target are available. However, disability is defined narrowly in terms of people who needed assistance with core activities, that is, had ‘severe or profound core activity limitations’, and so those with less severe physical disability, or psychosocial disability that does not impact core activity, are excluded.
Latest results across population groups
People living in more remote areas
People living in a more remote area may experience additional barriers to better outcomes; for example, not having access to key government services or infrastructure at the same level as people living in other areas. Aboriginal and Torres Strait Islander people typically experienced poorer target outcomes as remoteness increased, which was mostly not the case for non-Indigenous people7. This indicates that these barriers may be more of an issue for Aboriginal and Torres Strait Islander people living in these areas than for non-Indigenous people.
Aboriginal and Torres Strait Islander people living in more remote areas also saw less progress toward target outcomes. Target outcomes typically only improved for Aboriginal and Torres Strait Islander people in major cities and regional areas where there may be fewer barriers, including better access to key infrastructure. There was little or no improvement in remote and very remote areas. The exception was for target 9A ‘appropriately sized housing’ where outcomes improved the most in very remote areas, though they remain well below the outcomes in less remote areas.
But when outcomes worsened over time, Aboriginal and Torres Strait Islander people living in more remote areas were usually affected. For the two targets with worsening outcomes where data on remoteness is available, target 4 ‘children developmentally on track at school commencement’ outcomes worsened in regional and remote areas, but increased marginally in very remote areas and target 14 ‘suicide rates’ worsened across all areas.
People living in more disadvantaged socio-economic areas
Living in a more disadvantaged socio-economic area also negatively affects outcomes, which is likely in part due to the index measuring disadvantage being constructed using some of the target outcomes (for example, employment rates, qualifications and overcrowding). While this is true for both Aboriginal and Torres Strait Islander people and non-Indigenous people, it affects Aboriginal and Torres Strait Islander people more, with a wider gap in outcomes between people living in the most and least disadvantaged areas.
However, unlike living in more remote areas, living in more disadvantaged areas does not appear to hinder improvements in the target outcomes over time. All socio-economic outcomes improved for people living in more disadvantaged areas except for target 2 ‘healthy birthweight’ and target 7 ‘youth engaged in employment or education’, where movements were mixed but similar in magnitude across all socio-economic areas.
Similarly, for the one target that worsened and had data on socio-economic status of areas (target 4 ‘children developmentally on track at school commencement’), outcomes worsened across all socio-economic areas.
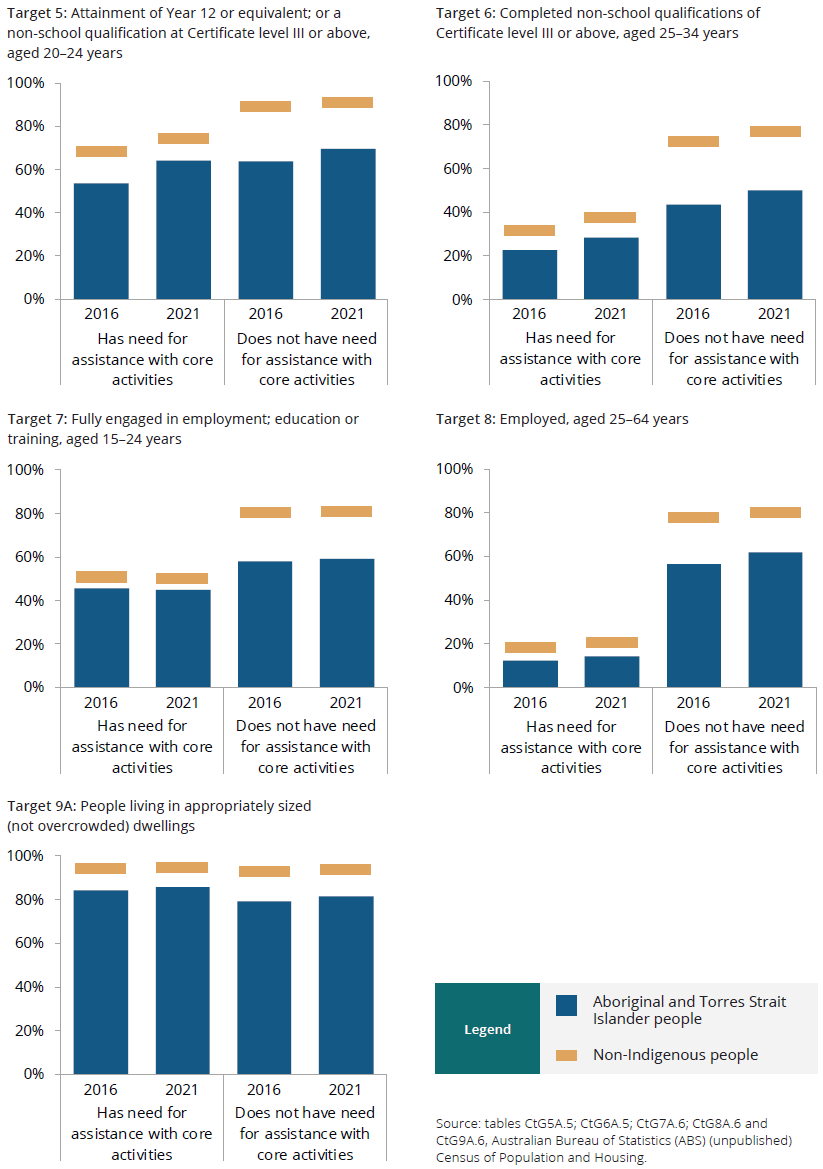
People with disability
Aboriginal and Torres Strait Islander people with profound or severe core activity limitations had poorer outcomes than people without these limitations across most targets.8 However, the gap in outcomes between those with and without these limitations was wider for non-Indigenous people, as non-Indigenous people without these limitations had considerably better outcomes.
But the lives of Aboriginal and Torres Strait Islander people with these limitations improved across most target outcomes over time (figure 3.1). The one exception is for target 7 ‘youth engaged in employment or education’ where outcomes worsened for Aboriginal and Torres Strait Islander young people with these limitations.
Improvements were usually larger for Aboriginal and Torres Strait Islander people with severe and profound core activity limitations than for any other population, although this is from a lower starting point.9 The exception was target 9A ‘appropriately sized housing’, where Aboriginal and Torres Strait Islander people without these limitations saw the largest proportional increase over time.
Figure 3.1 – Outcomes for people with and without core activity limitations
Outcomes for females and males
Outcomes reported for the targets were often better for Aboriginal and Torres Strait Islander females than males, a pattern also seen among non-Indigenous people. Females were more likely to be developmentally on track at the start of school (target 4) and to have attained Year 12 or equivalent (target 5) and qualifications at Certificate level III or above (target 6). They were also less likely to have been in youth detention (target 11), adult prison (target 10) or died by suicide (target 14).
Most outcomes are also improving more, or worsening less, over time for Aboriginal and Torres Strait Islander females than males. Outcomes for:
- education and training (targets 5 and 6) and youth detention (target 11) (other than the most recent year) improved more for females than males
- adult imprisonment (target 10) and suicide rates (target 14) worsened less for females than males.
But there are also exceptions to these trends. Outcomes worsened more for girls than for boys for target 4 ‘children developmentally on track at school commencement’. This is also the case for non-Indigenous females, albeit off a higher base.
However, Aboriginal and Torres Strait Islander males are doing better or as well as females for some targets. Employment rates (target 8) and youth engagement in employment, education and training (target 7) were higher for Aboriginal and Torres Strait Islander males than for females, although these gaps have narrowed over time. There was also little difference in outcomes for Aboriginal and Torres Strait Islander males and females in the proportion in appropriately sized housing (target 9A) or rate in out-of-home care (target 12).
Outcomes for younger and older people
While outcomes are often worse for Aboriginal and Torres Strait Islander young people (aged between 20 and 40 years) than for older people (aged between 40 and 50 years), they are improving more for young people in some areas:
- Employment rates (target 8) increased across all reported age groups for Aboriginal and Torres Strait Islander people, with the largest increase for those aged 25–39 years (albeit from a lower base than older age groups).
- Imprisonment rates (target 10) were highest for those aged 30–39 years, however, for the most recent reporting period the rates for 25–34 year olds decreased and were below the baseline level.
Even though older Aboriginal and Torres Strait Islander adults often have better outcomes than younger adults, outcomes are worsening more for older adults in some areas. For imprisonment (target 10) and suicide (target 14), while starting from a lower base than younger age groups, rates increased at a faster pace for Aboriginal and Torres Strait Islander people aged 40 years or over. From 2021, the imprisonment rate for people aged 45–59 years overtook that for people aged 18–24 years. And while suicide rates were highest for those aged 18–24 years, the largest increases were for people aged 35–44 years and 45 years or over. These worsening outcomes were not seen for older non-Indigenous people.
Considering the intersection of different characteristics
Where location and personal characteristics are associated with improving or worsening outcomes, the intersection of these characteristics may create additional advantages/barriers. For example, a young Aboriginal and Torres Strait Islander male experiencing disability and living in a very remote area, is likely to have greater barriers to improved outcomes compared to other Aboriginal and Torres Strait Islander people.
Some target outcomes are reported on the dashboard for people where personal characteristics intersect, although this is limited. One example is target 14 ‘suicide rates’, where outcomes are reported for males and females by age groups.
- When age and sex are reported separately, suicide rates were lower for Aboriginal and Torres Strait Islander females than males, but worsened at a faster rate for males. Further, rates were relatively low for people aged 5–17 years and had decreased, whereas rates for older age groups were relatively high and had increased.
- When age and sex are combined, the suicide rates for Aboriginal and Torres Strait Islander females aged 5–17 years were higher than for males in this age group, where the rates for males had decreased but had increased for females.
Supporting indicators
Supporting indicators are also reported on the dashboard across the socio-economic outcomes. The Agreement describes these supporting indicators as drivers or contextual information. Drivers are intended to measure factors that significantly affect progress towards a target, with contextual information intended to provide insight into the experiences of Aboriginal and Torres Strait Islander people in relation to the socio-economic outcome. Along with the target disaggregations, the supporting indicators can provide a more complete story on progress toward the socio-economic outcomes.
There are currently 146 supporting indicators for the socio-economic outcomes in the Agreement and these indicators are being developed in stages. Work has begun on 23 of these indicators, with around 85% (over 120) still to be included on the dashboard. In line with the Agreement (clause 117), the selection of initial indicators was done in conjunction with the Partnership Working Group.
This report focuses on 14 supporting indicators that best supplement the other reporting here (see attachment C). These indicators are in areas where there is no assessment of progress for the associated target (at all, or since the signing of the current Agreement) or the target is worsening.
- For targets that have no assessments, or the assessments are relatively old (that is, there has been no new data for several years for an assessment, including no new data since the Agreement was signed), supporting indicators may assist in understanding what progress might have been made more recently or what progress we might expect to see in future for a socio-economic outcome area (box 3.1).
- For targets that are worsening, supporting indicators may assist in understanding factors that need to be addressed to see an improvement in the target. Although, the targets and each of the supporting indicators only provide a partial picture by themselves. So the target along with multiple indicators are required to provide a fuller picture (box 3.1).
Issues with supporting indicators
The purpose of some supporting indicators is not clear and this can make them difficult to interpret. While the Agreement specifies each supporting indicator as either a driver or contextual information, it is not always clear why some are considered drivers and others just provide context. For example, the supporting indicator ‘rates of Aboriginal and Torres Strait Islander child protection substantiations related to family violence’ is listed as a driver of reducing the rates of all forms of family violence (target 13). Based on the definition above of a driver indicator, it is not clear how reporting rates of ‘child protection substantiations related to family violence’ will impact on the levels of family violence. While it may indicate if the levels of family violence are changing (much like the target itself), it is not measuring a factor that could drive those changes, such as access to family counselling services or access to women’s refuges.
Box 3.1 – Informing progress using supporting indicators – examples from socio-economic outcome areas 1 and 10
Socio-economic outcome area 1
Supporting indicators provide more recent information on progress
Socio-economic outcome area 1 is ‘Aboriginal and Torres Strait Islander people enjoy long and healthy lives.’ The target for this area is to close the gap in life expectancy between Aboriginal and Torres Strait Islander people and non-Indigenous people by 2031.
The most recent data on life expectancy is relatively old as it covers the period 2015–2017, which is before the Agreement was signed. More recent estimates are anticipated to be available in late 2023.
The two supporting indicators currently reported for this outcome area have more recent data which could inform progress. Data on leading causes of death by age group is available for the period 2017–2021 and for access/use of health services for 2021-22.
Available data for these two supporting indicators provide some concerning indications for future life expectancy estimates.
- From 2014–2018 to 2017–2021, death rates have increased across most age groups for Aboriginal and Torres Strait Islander people, with gaps widening to the rates for non-Indigenous people. Hypothetically, if death rates are widening across age groups we could expect to see a widening of the gap in life expectancy estimates.
- Following a peak in 2018-19, the rate of Aboriginal and Torres Strait Islander people getting Indigenous-specific health checks has decreased and in 2021-22 was below the 2016-17 baseline. Access to quality health care is one factor that can drive improvements in life expectancy (noting that available data for this indicator is for Indigenous-specific health checks, and therefore does not include all health services provided).
Socio-economic outcome area 10
Supporting indicators provide more understanding on factors that affect progress, but can also raise questions
Socio-economic outcome area 10 is ‘Aboriginal and Torres Strait Islander adults are not overrepresented in the criminal justice system’. Indicator 10a ‘adults charged by police’ is listed as a driver of progress for target 10 ‘adult imprisonment’. While the increase in the proportion of people being charged might be expected to drive an increase in the imprisonment rate, this is not necessarily the case, with results mixed across the three jurisdictions with available data. This indicates that imprisonment rates are not only being driven by police charging rates, but also bail and sentencing practices; that is, a person is:
- charged but is bailed rather than imprisoned on remand
- charged and sentenced, but receives a community-based order rather than prison sentence.
Therefore, future reporting on the legal status of prisoners and the proportion of people sentenced by sentence type (both supporting indicators in the Agreement) may assist in providing a more complete picture of the justice system and what is driving the increasing imprisonment rates.
Furthermore, several supporting indicators lack data either partly or entirely. For example, data is only available for three jurisdictions for the supporting indicator on adults charged by police for target 10 ‘adult imprisonment’.
This is a particular issue for socio-economic outcome area 13 on safe families and households, where data is not available for the two supporting indicators included on the dashboard. Because no data is available for the target since the 2018-19 baseline, this means there is no way of assessing progress over the past five years.
For some supporting indicators, the data is old or even older than the data for the target, making it difficult to assess recent progress. For example, data for the supporting indicator on internet use to access government services for target 17 ‘digital inclusion’ is sourced from the same data collection as the target, from 2014-15.
Interrelationships of targets and indicators across the socio-economic outcome areas
Interrelationships and overlaps in measurement do exist across the socio-economic outcome areas. That is, there are targets or indicators (and data development items) that measure factors that are drivers or provide context for outcomes in more than one area.
The related or overlapping indicators are usually not identical, but cover similar concepts. For example, smoking rates are identified as a driver for life expectancy (target 1) and healthy birthweight (target 2), while mental health issues are identified as a driver for adult imprisonment (target 10) and are important to understanding young people’s overrepresentation in the criminal justice system (target 11). Similarly, educational attainment, measured in targets 5 and 6, is identified as a driver for employment (target 8).
However, given the volume of indicators (146) and data development items (over 120), the level of overlap is limited. This could imply that outcomes across the socio-economic areas are seen as independent of one another, which may reinforce any existing ‘siloed’ approaches to improve them.
While there is limited overlap, where there is the results may be counterintuitive. This is the case in the one instance where a target (target 3 ‘preschool enrolment’) is identified as a driver for another target (target 4 ‘children developmentally on track at school commencement’). Despite good improvement in preschool enrolment rates (target 3), early childhood development outcomes (target 4) are declining. While it is not clear why this is the case, it might be that children are enrolled in preschool but the quality of the preschool services they attend is low or they are not attending (or actively engaged) due to a range of reasons (such as, the proximity or cultural safety of preschool providers).
Improving measurement of the socio-economic targets and supporting indicators
As with the Priority Reforms, it is important to get the measurement right for the targets and supporting indicators for the socio-economic outcome areas. The key accountability mechanism to assess progress is the targets, and so getting the measurement of progress for the targets right is important. Furthermore, some of the quality issues outlined in attachment A can potentially be addressed by using data from collections that incorporate the perspectives of Aboriginal and Torres Strait Islander people and are perceived positively; that is are seen to be collected for the communities benefit.
With this in mind, there are two areas that are the focus for getting measurement right for the socio-economic outcome areas:
- ensuring the assessments of progress for the targets are available, accurate and comprehensive – that is, the data needed to assess progress are available and that the assessments use robust and fit-for-purpose statistical methods and can assess if the contribution of each state and territory toward achieving the national target is enough. The Commission is engaging an organisation to undertake a review of the current method to consider these points.
- sourcing data that better reflect Aboriginal and Torres Strait Islander people’s perspectives and priorities – that is, continue to investigate what Aboriginal and Torres Strait Islander community data is available that could replace, supplement and/or enhance existing data that are predominately government controlled.
Attachment A
Measurement and data quality issues to be considered when interpreting results for the targets
To assess progress effectively requires quality data and the right measurement approach. Any issues with data quality and/or measurement need to be considered when interpreting the results.
An overview of the significant data and measurement issues is provided below (some are also relevant for the supporting indicators). The dashboard ‘how to interpret’ data page and the technical specifications for the targets and supporting indicators provide further information on these issues and on those specific to each target and indicator.
Gaps in the data
Multiple socio-economic targets cannot be assessed due to a lack of available data. Sometimes data is not available because it is not collected, in other cases it is collected but is of very low quality due to a range of issues (see box A.1), and so is not reported.
As noted in section 3, the data needed for assessing progress is not collected for four targets. For the target 9B ‘community infrastructure’, no data has been collected for the starting point (baseline) or to provide updates on progress. For the other three targets (13 ‘family violence’, 16 ‘strength of languages’ and 17 ‘access to information’) while data for the baseline is available, updates since then are not.10
For a further two targets, data is collected but quality issues limit the scope of the assessments of progress. For target 1 ‘life expectancy’ the national target includes data for only four jurisdictions. For target 14 ‘suicide rates’ the national target includes data for only five jurisdictions, and assessments of progress are not currently available by state and territory.
And for all these six targets and multiple others, data is not available for reporting on some of the required disaggregations of the national target indicator, in particular, disability. For example, no disability data is reported for target 10 ‘adult imprisonment’ and target 11 ‘youth detention’, and while some disability data is reported for target 12 ‘children in out-of-home care’ and target 3 ‘preschool enrolment’ they are not a disaggregation of the target indicator itself.
Data and measurement issues affecting assessments of progress
Where assessments of progress are available, data and measurement issues can affect their accuracy and reliability (box A.1). The accuracy of these assessments and/or how progress is interpreted over time is affected by:
- the quality of the data for Aboriginal and Torres Strait Islander people, with quality reduced by under counting, under identification or missing information
- changes in how Aboriginal and Torres Strait Islander people identify over time, with identification levels increasing in recent years
- the use of population projections based on the 2016 Census, which rely on assumptions regarding how the population will change from 2016 (box A.1).
Box A.1 – Issues that can affect the accuracy of the assessments of progress for the targets
For many of the national targets, there are three issues that affect the accuracy of the assessments related to the quality of data at a point in time, and/or other data issues that are important when considering changes over time.
First, the quality of data for Aboriginal and Torres Strait Islander people at a point in time can be reduced for various reasons, including where:
- Indigenous status is ‘not stated’/collected, leading to under identification/counting
- there are difficulties collecting data from people in remote and very remote areas (where many Aboriginal and Torres Strait Islander people live), leading to under counting
- data collections are not designed well for Aboriginal and Torres Strait Islander people, or there is a negative perception about how data might be used, leading to missing personal information.
Second, changes in identification can affect how progress is interpreted over time. An Aboriginal and Torres Strait Islander person may choose to identify differently over time for a variety of reasons, including how they perceive the information will be used, and for cultural or historical reasons. The latest Census results show that increasing identification rates, along with changes in the Census coverage and response rates, accounted for 56.5% of the increase in the Census count of Aboriginal and Torres Strait Islander people between 2016 and 2021.
Third, the use of population projections data as the denominator to calculate rates can affect the accuracy of the target data at a point in time and how progress is interpreted over time. While the Aboriginal and Torres Strait Islander population projections are the best available and most up to date, they are based on the 2016 Census and are less accurate for years that are further away from 2016. The accuracy declines because the populations are projected from the Census year using assumptions − for example, on life expectancy, fertility, and migration. Unlike total population estimates they are not updated between the Census years using current ‘actual’ information and this is due to a lack of high quality data for Aboriginal and Torres Strait Islander people on births, deaths and migration. Furthermore, these projections assume that the level of identification does not change for Aboriginal and Torres Strait Islander people over time.
The extent to which these issues affect the accuracy of reporting on progress is difficult to quantify and is specific to each target (table A.1 shows which of the targets are affected by each issue). Two examples of how these issues interact and/or affect reporting on progress are provided below.
- For targets that use population projections, rates for recent years may be higher than the ‘real’ rates as the numerators (number of people experiencing an outcome) are inflated relative to the denominators (the number of people in the population). This occurs where the numerators reflect the current higher levels of identification, whereas the population data are projections based on the lower levels of identification in 2016 (box A.1). For example, for target 3 ‘preschool enrolment’, this issue is likely to be contributing to the majority of states and territories (five of eight) currently reporting that the proportion of children enrolled in preschool is greater than 100%.
- For other targets where the numerator and denominator are sourced from the same data set (such as the Census), changing levels of identification over time can affect how progress is interpreted. If the characteristics of those identifying in recent years differs to those who identified in earlier years (for example, they are more likely to be in major cities and employed), any progress/regress might be because of changes in the mix of people identifying, not because outcomes are actually getting better/worse.
| What is the issue | What does it affect |
|---|---|
| Data are not available | |
| No data are collected |
Target 9B – all reporting Targets 10, 11 − remoteness Targets 10, 11 − socio-economic status of the locality Targets 1, 2, 10, 11, 14 − disability |
| No data have been collected since the baseline | Targets 13, 16 and 17 |
| Data are collected but data quality or collation issues mean that data are not available to report on some disaggregations for the target indicator |
Targets 1, 14 – some or all states/territories Target 3 − remoteness areas Targets 3, 14 − socio-economic status of the locality Targets 3, 4, 12 − disability |
| Data and measurement issues | |
| Quality of data on Aboriginal and Torres Strait Islander people in data sets |
All targets with reported data (other than targets 15A, 15B and 16) |
| Changes in identification by Aboriginal and Torres Strait Islander people over time |
All targets with reported data (other than targets 15A, 15B and 16) |
| Accuracy of population projection data | Targets 3, 10−12 and 14 |
Furthermore, in addition to the issues with the underlying data, the reliability of the assessments of progress themselves varies across the targets (box A.2). The assessments are based on an estimated ‘trend’, which is more reliable where the volatility of the data is low, and becomes more reliable as the number of data points on which it is based increases.
Box A.2 – Issues that can affect the reliability of the assessments of progress for the targets
The method for assessing progress is the same across the national targets.
Progress is assessed using data on the trend in the outcomes, from the baseline year (which is the starting point) to the latest year. This trend is used because this helps address issues with natural volatility in the data, which means that it more reliably reflects the underlying progress of an outcome). For some targets, data can vary significantly year-on-year as based on small populations (with a small change in the number of people experiencing an outcome producing a large change in the rate).
However, the reliability of these assessments may vary, because the estimated ‘trend’ for each target is derived using a different number of data points to other targets. As the number of data points increases, the estimated trend will become more reliable, especially where the data volatility is low. For the latest dashboard, the trend for six targets is based on two data points only and for three on three points, five on four points and one on seven points.
When the assessment is based on five or more points (currently one target only), statistical techniques are used to assign a level of confidence; that is, assessments are provided with a high or low level of confidence (with this confidence level taking into account the number of data points and the volatility of the data).
The number of data points that will be available by the final target year will be fewer for some targets than others. This applies to targets based on infrequent data collections (for example, five-yearly Census). For these targets, only a small number of data points will be available up to and including the final target year (for example, four data points for those based on Census data).
Attachment B
Summary of progress across Priority Reform areas Dashboard snapshots
Attachment C
Summary of progress across socio-economic outcome areas Dashboard snapshots and data for download
Footnotes
- A Data Development Plan was approved by the Joint Council on Closing the Gap in August 2022. The Plan can be found at www.closingthegap.gov.au/resources. Locate Footnote 1 above
- The parties responsible for the Agreement are the Australian Government, the state and territory governments, the Australian Local Government Association and the Coalition of Aboriginal and Torres Strait Islander Peak Organisations (Coalition of Peaks). Locate Footnote 2 above
- Jurisdiction in this context refers to the Australian, state and territory governments. Locate Footnote 3 above
- SCRGSP (Steering Committee for the Review of Government Service Provision) 2020, Overcoming Indigenous Disadvantage: Key Indicators 2020, Productivity Commission, Canberra. Locate Footnote 4 above
- Households are those within discrete Aboriginal or Torres Strait Islander communities or that are in or near to a town. Locate Footnote 5 above
- This target has four possible trajectories based on a 20%, 25%, 50% and 75% reduction in the suicide rate. Locate Footnote 6 above
- The exception to this is suicide rates, which were higher for non-Indigenous people in remote areas compared to non-remote areas. Locate Footnote 7 above
- This is disability measured as a need for assistance with core activities, with data available for five targets. Locate Footnote 8 above
- The other populations are Aboriginal and Torres Strait Islander people without severe and profound core activity limitations, and non-Indigenous people with and without these limitations. Locate Footnote 9 above
- For target 16 a new survey is due to be undertaken in 2024, for the other two targets no proposed developments are listed on the dashboard. Locate Footnote 10 above
The Productivity Commission acknowledges the Traditional Owners of Country throughout Australia and their continuing connection to land, waters and community. We pay our respects to their Cultures, Country and Elders past and present.
The Productivity Commission
The Productivity Commission is the Australian Government’s independent research and advisory body on a range of economic, social and environmental issues affecting the welfare of Australians. Its role, expressed most simply, is to help governments make better policies, in the long term interest of the Australian community.
The Commission’s independence is underpinned by an Act of Parliament. Its processes and outputs are open to public scrutiny and are driven by concern for the wellbeing of the community as a whole.
Further information on the Productivity Commission can be obtained from the Commission’s website (www.pc.gov.au).
© Commonwealth of Australia 2023
With the exception of the Commonwealth Coat of Arms and content supplied by third parties, this copyright work is licensed under a Creative Commons Attribution 4.0 International licence. In essence, you are free to copy, communicate and adapt the work, as long as you attribute the work to the Productivity Commission (but not in any way that suggests the Commission endorses you or your use) and abide by the other licence terms. The licence can be viewed at: https://creativecommons.org/licenses/by/4.0.
The terms under which the Coat of Arms can be used are detailed at: www.pmc.gov.au/government/commonwealth-coat-arms.
Wherever a third party holds copyright in this material, the copyright remains with that party. Their permission may be required to use the material, please contact them directly.
ISBN 978-1-74037-773-7 (online)
ISBN 978-1-74037-772-0 (PDF)
Attribution
This work should be attributed as follows, Source: Productivity Commission, Closing the Gap Annual Data Compilation Report July 2023.
If you have adapted, modified or transformed this work in anyway, please use the following, Source: based on Productivity Commission data, Closing the Gap Annual Data Compilation Report July 2023.
Publication enquiries
Phone: (03) 9653 2244
Email: publications@pc.gov.au