Transitioning regional economies
Study report
This report was released on 15 December 2017 and looks into the geographic impacts of the transition of the Australian economy following the resources investment boom.
Download the overview
- Overview - Transitioning Regional Economies - Study report (PDF - 884 Kb)
- Overview - Transitioning Regional Economies - Study report (Word - 726 Kb)
Download the study report
- Transitioning Regional Economies - Study report (PDF - 5326 Kb)
- Transitioning Regional Economies - Study report (Word - 4025 Kb)
There has not been a government response to this study yet.
These results, data and code should be used in a manner consistent with explanations in the report. Chapters 2 and 4 and Appendix E explain how the index should be interpreted. Details of the methodology and data sources used to construct the index can be found in Appendix E of the report.
Consistent with the Commission's approach of making available our modelling and key datasets, the full set of supporting information is comprised of the following four components:
Supporting material A
An excel spreadsheet showing summary results for the index of relative adaptive capacity for Functional Economic Regions (FERs) in 2016 (as presented in the main report). The summary results include contextual information (including state identifier, population, and remoteness code and category), as well as information about the factors contributing to the index score and the confidence interval for the index score.
Supporting material B
A zip file containing results of the index for: FERs using 2011 census; FERs using nested principal components and 2016 census; and SA2 regions using 2016 census.
Supporting material C
A zip file containing data and R code to construct FERs. It includes: a document describing how to run the R code to compute the FERs; the various R codes; datasets, stored as excel or comma separated value formats; and shapefiles use to generate maps of the regions.
Supporting material D
A zip file containing data and R code to compute the index of relative adaptive capacity. It includes: a document describing how to run the R code to compute the index; the various R codes (programming scripts written in R to do the various analyses); datasets, stored as excel or comma separated value formats (these datasets are imported by the R code, with data manipulation and statistical analyses done in the R code); and shapefiles use to generate maps of the regions.
Key Points
- Overall, the Australian economy has shown considerable flexibility and resilience over the past 30 years, with a large majority of regions (77 per cent) experiencing positive employment growth over the past five years. Employment in mining remains more than double pre‑boom levels.
- While the mining boom has caused transitional pressures, it has also made Australians substantially better off in the short term and over the long term.
- A mobile workforce (including fly‑in, fly‑out) has spread the benefits of the boom across workers living in other regions, as well as reduced the cost of both the investment phase and the ongoing production phase.
- Adjustment from the mining boom is generally not a source of significant disadvantage and does not justify special intervention from governments.
- Even though overall employment growth has been positive, all regions have variable growth in employment over time, with most experiencing falls at times.
- Over the past five years, reductions in employment and population are more evident in some agricultural regions and a number of marginal mining regions.
- Despite this, there is emerging evidence of rising incomes in agricultural regions.
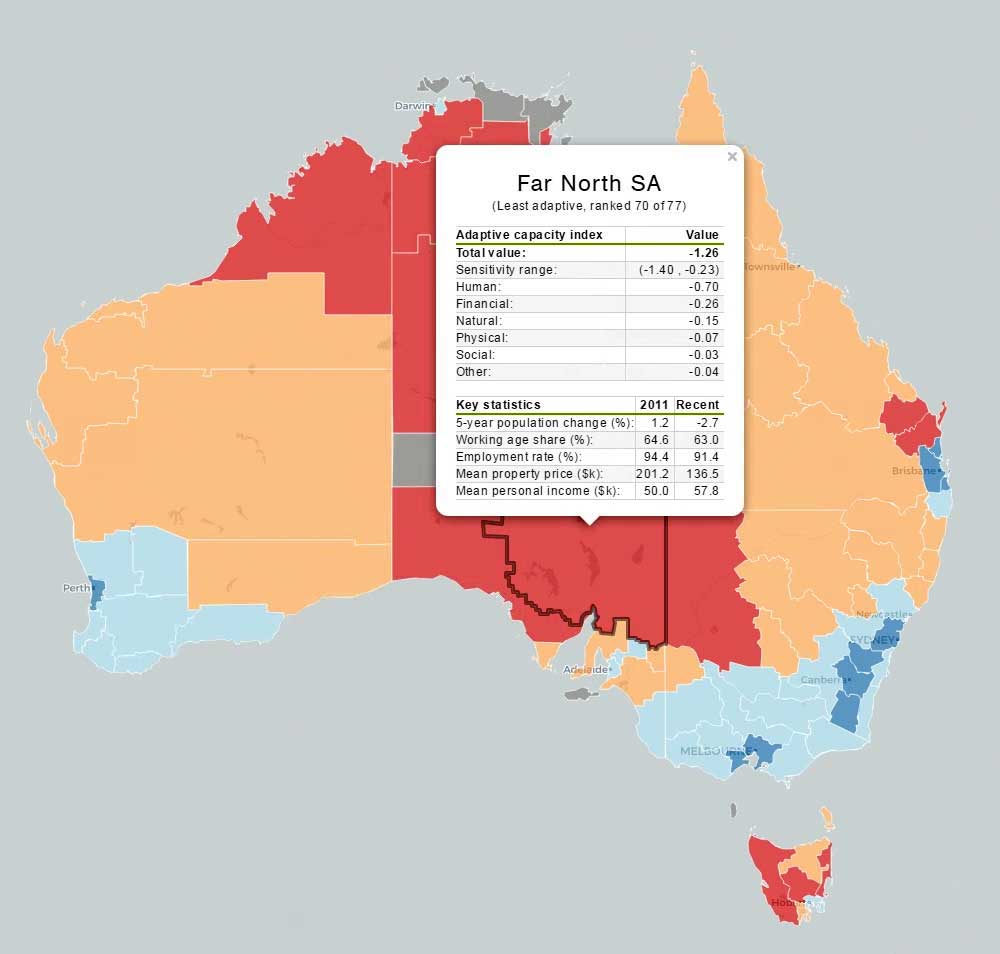
- As requested, the Commission has constructed an index of relative adaptive capacity. This metric does not, by itself, provide a basis for policy making. There is unavoidable uncertainty about its estimated value for each region, and transitions in the real world also depend on the specific nature of the shock, the options available to people and the decisions they make.
- Using this metric, most major cities have relatively higher adaptive capacity, while some remote regions (including Indigenous communities) and many outer regional areas tend to have relatively lower adaptive capacity.
- Governments should avoid providing ad hoc financial assistance to regions because it is rarely effective. It does little to facilitate transition and long‑term development. Governments should also better coordinate and evaluate their activities that affect Australia's regions.
- Specific adjustment assistance to individual regions should be reserved for extreme events that are likely to result in high levels of permanent disadvantage in a community. Even then it should be targeted at assisting the most vulnerable families and individuals, in particular to help them secure employment.
- There is unnecessary overlap in the regional development roles of all three tiers of government, contributing to concerns about the effectiveness and value for money from the large outlays on regional development programs.
- Central responsibility for regional development resides with State and Territory governments, supported by local governments. They should:
- remove unnecessary planning and zoning regulations that are obstacles to regional development
- adopt more rigorous and transparent assessment and implementation of their regional development planning strategies to improve the effectiveness and value for money from the large expenditures on regional development. This requires strong and effective local leadership
- direct discretionary funding to priorities identified in regional strategic plans.