Skip to Content
 Close search

Overcoming Indigenous Disadvantage: Key Indicators 2016

The Overcoming Indigenous Disadvantage report measures the wellbeing of Aboriginal and Torres Strait Islander Australians.

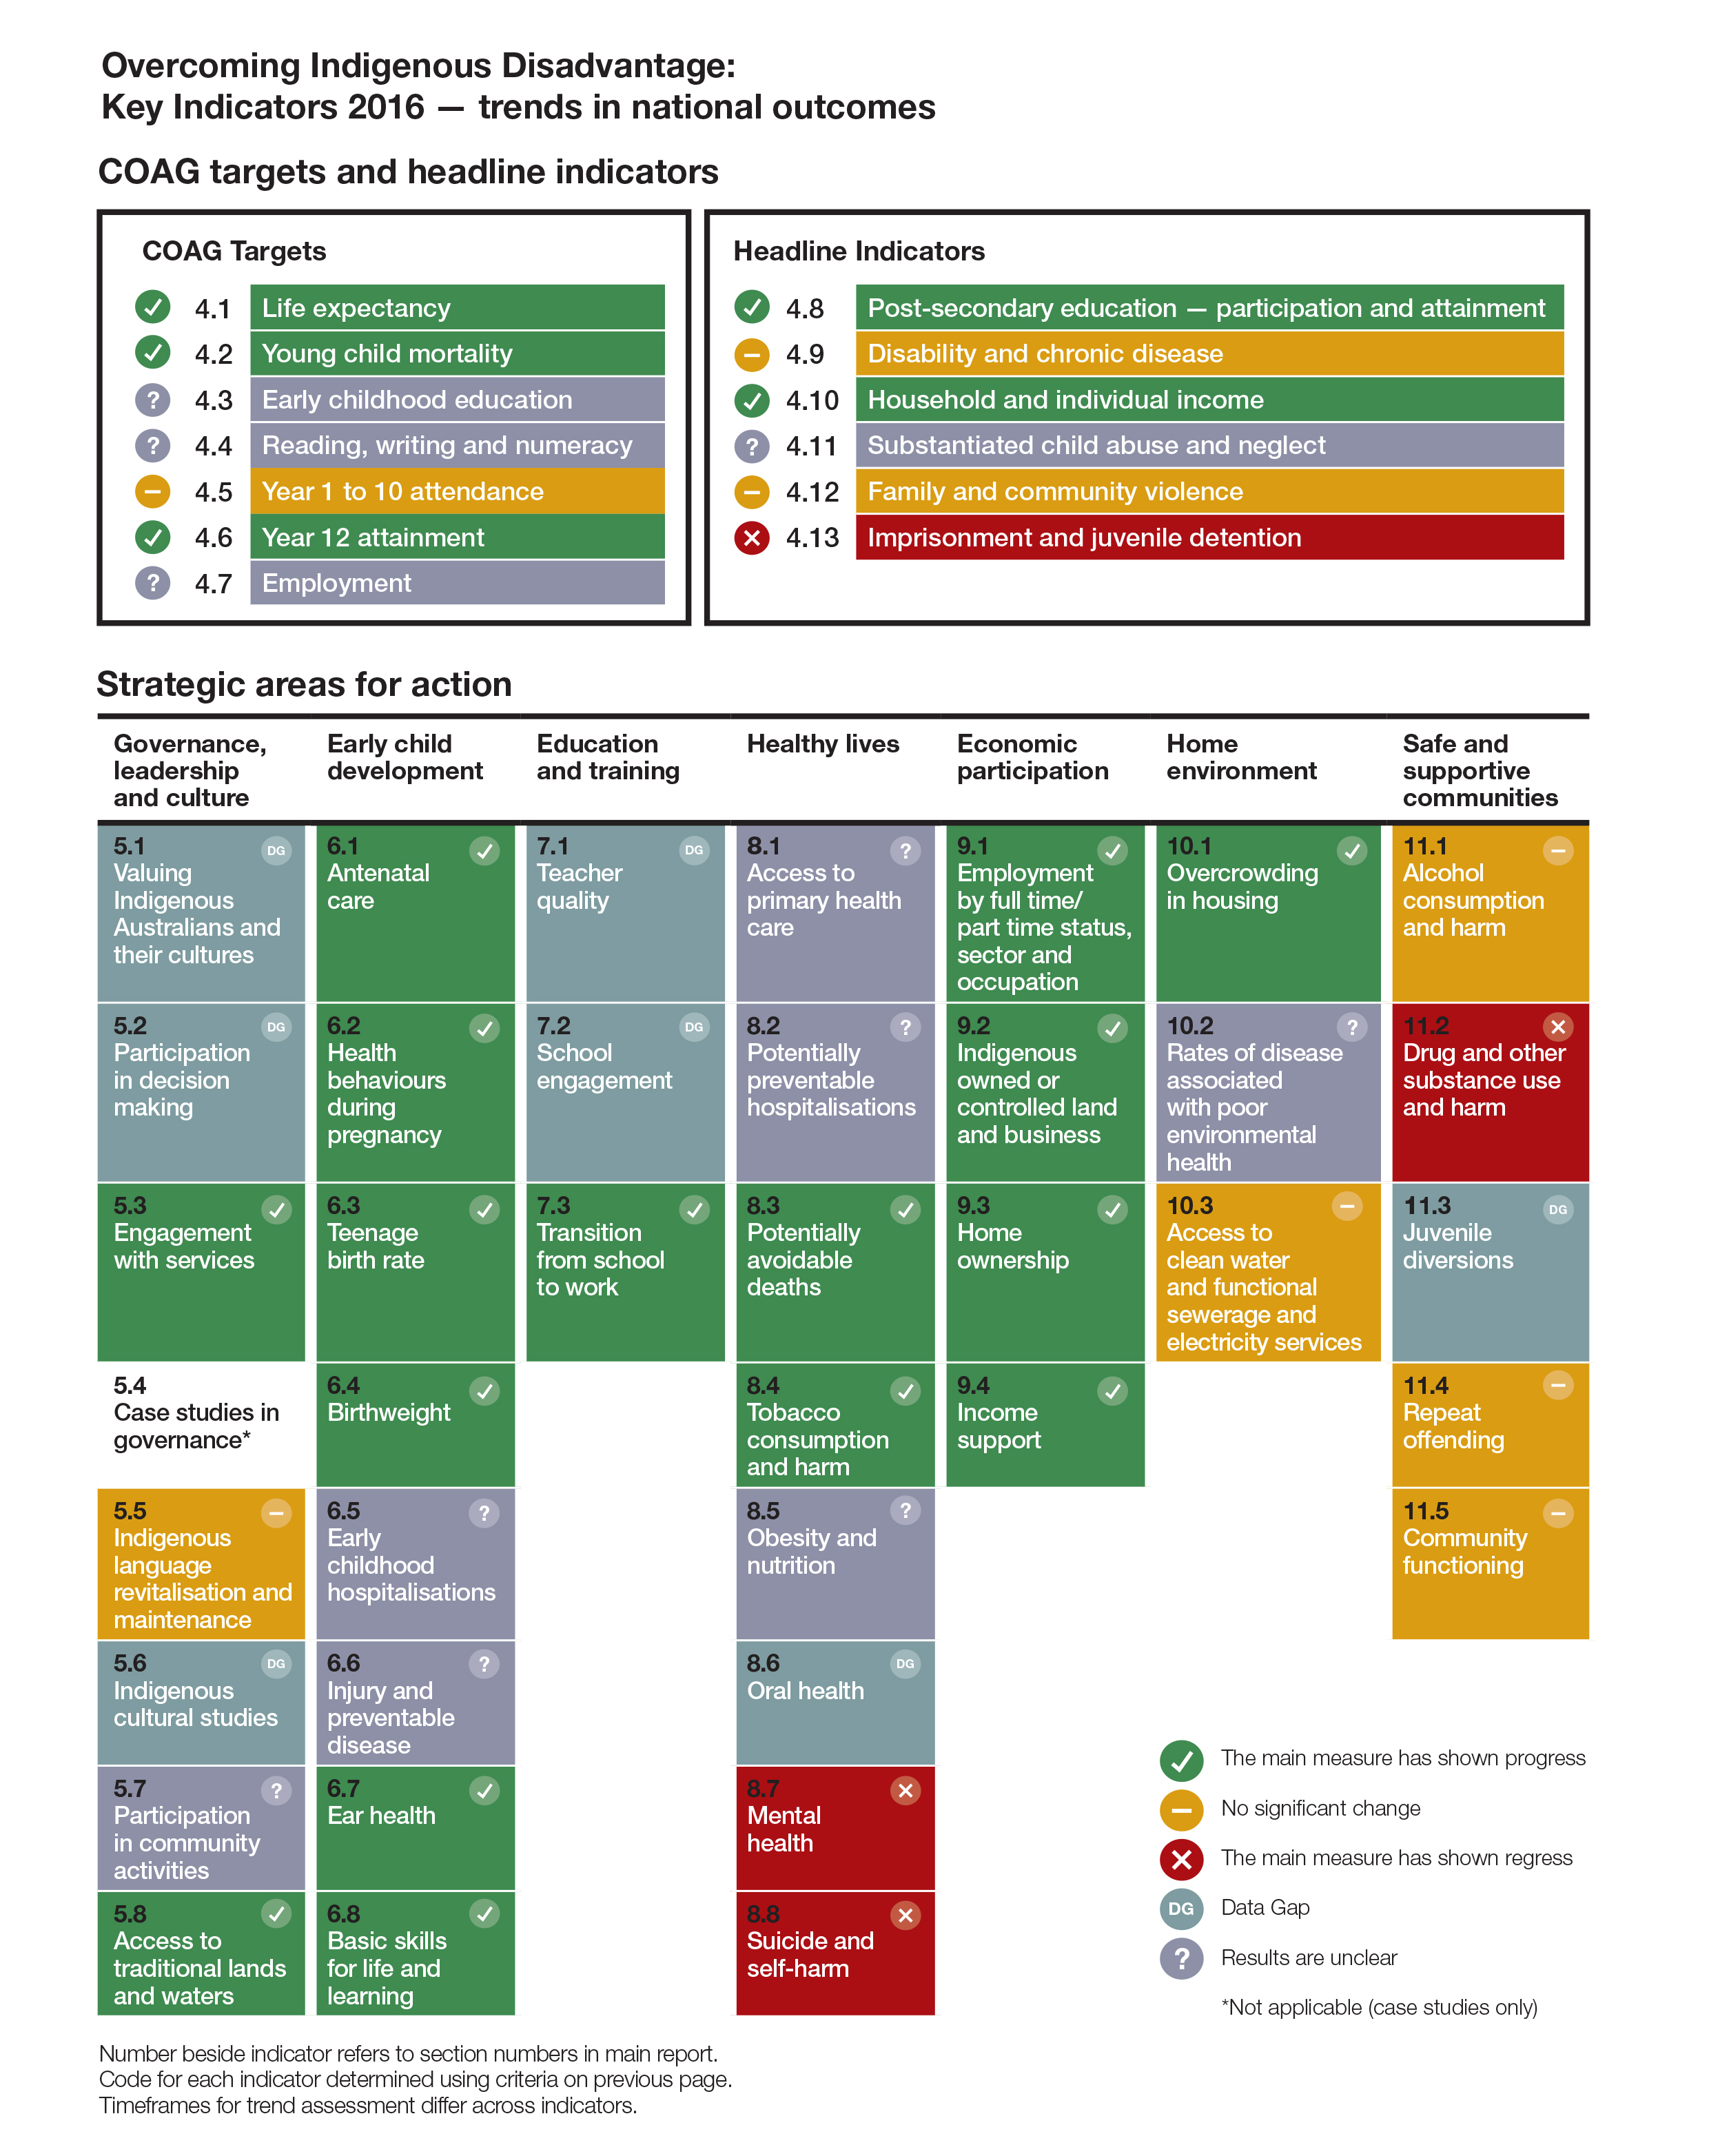
This comprehensive report card measures where things have improved (or not) against 52 indicators across a range of areas including governance, leadership and culture, early childhood, education, health, home and safe and supportive communities, and includes case studies on things that work to improve outcomes.

The report is produced in consultation with all Australian governments and Aboriginal and Torres Strait Islander Australians.

The 2016 report was released on 17 November 2016.

Please note: Aboriginal and Torres Strait Islander people are advised that this website may contain names, images and voices of deceased people. It may also link to other websites which contain names, images and voices of deceased people.

  • At a glance
  • Overview
  • Report
  • Fact sheet

Expand allCollapse all

Media release

Overcoming Indigenous Disadvantage 2016

The 2016 Overcoming Indigenous Disadvantage (OID) report shows some positive trends in the wellbeing of Aboriginal and Torres Strait Islander Australians, but also shows outcomes have stagnated or worsened in some areas.

Two years on from the previous report there continues to be improvement in many areas of health, economic participation and aspects of education. But areas such as justice and mental health remain concerning, with increases in imprisonment rates and hospitalisations for self-harm.

“It is encouraging to see improvement over the last decade in rates of year 12 completion and post school education. But alarmingly the national imprisonment rate has increased 77 per cent over the last 15 years, and hospitalisation rates for self-harm have increased by 56 per cent over the last decade” said Peter Harris, Chair of the Productivity Commission and of the Steering Committee.

The OID report continues to provide comprehensive reporting, with a ‘strengths-based’ focus. It also includes some case studies on ‘things that work’ to improve outcomes for Aboriginal and Torres Strait Islander Australians. “If we are to see improvements in outcomes we need to know which policies work and why. But the overwhelming lack of robust, public evaluation of programs highlights the imperative for Indigenous policy evaluation” said Deputy Chair Karen Chester.

The OID report should be compulsory reading for anyone interested in the wellbeing of Aboriginal and Torres Strait Islander Australians, including those working in service delivery or program design.

It is the most comprehensive report on Aboriginal and Torres Strait Islander wellbeing produced in Australia. It covers areas including governance and culture, early child development, health, education, economic participation and safe and supportive communities as well as reporting on indicators related to the Closing the Gap targets.

The report is produced by the Productivity Commission for the Steering Committee for the Review of Government Service Provision, with Aboriginal and Torres Strait Islander Australians involved in its development. This report is the seventh in the series.

The 2016 OID main report, Overview and short video can be found at: www.pc.gov.au\oid2016

Key points

  • This report measures the wellbeing of Aboriginal and Torres Strait Islander Australians, and was produced in consultation with governments and Aboriginal and Torres Strait Islander Australians. Around 3 per cent of the Australian population are estimated as being of Aboriginal or Torres Strait Islander origin (based on 2011 Census data).
  • Outcomes have improved in a number of areas, including some COAG targets. For indicators with new data for this report:
    • Mortality rates for children improved significantly between 1998 and 2014, particular for 0<1 year olds, whose mortality rates more than halved (from 14 to 6 deaths per 1000 live births).
    • Education improvements included increases in the proportion of 20–24 year olds completing year 12 or above (from 2008 to 2014-15) and the proportion of 20–64 year olds with or working towards post-school qualifications (from 2002 to 2014-15).
    • The proportion of adults whose main income was from employment increased from 32 per cent in 2002 to 43 per cent in 2014-15, with household income increasing over this period.
    • The proportion of adults that recognised traditional lands increased from 70 per cent in 2002 to 74 per cent in 2014-15.
  • However, there has been little or no change for some indicators.
    • Rates of family and community violence were unchanged between 2002 and 2014-15 (around 22 per cent), and risky long-term alcohol use in 2014-15 was similar to 2002 (though lower than 2008).
    • The proportions of people learning and speaking Indigenous languages remains unchanged from 2008 to 2014-15.
  • Outcomes have worsened in some areas.
    • The proportion of adults reporting high levels of psychological distress increased from 27 per cent in 2004-05 to 33 per cent in 2014-15, and hospitalisations for self-harm increased by 56 per cent over this period.
    • The proportion of adults reporting substance misuse in the previous 12 months increased from 23 per cent in 2002 to 31 per cent in 2014-15.
    • The adult imprisonment rate increased 77 per cent between 2000 and 2015, and whilst the juvenile detention rate has decreased it is still 24 times the rate for non-Indigenous youth.
  • Change over time cannot be assessed for all the indicators — some indicators have no trend data; some indicators report on service use and change over time might be due to changing access rather than changes in the underlying outcome; and some indicators have related measures that moved in different directions.
  • Finally, data alone cannot tell the complete story about the wellbeing of Aboriginal and Torres Strait Islander Australians, nor can it fully tell us why outcomes improve (or not) in different areas. To support the indicator reporting, case studies of ‘things that work’ are included in this report. However, the relatively small number of case studies included reflects a lack of rigorously evaluated programs in the Indigenous policy area.

Transcript of video

[Scene set in a television studio]

FLOOR MANAGER: Going Live in 5 guys!

EXECUTIVE PRODUCER: So, Rachel, I was thinking today with our justice story…

RACHEL: I’m still making some changes.

EXECUTIVE PRODUCER: So, am I going to get the changes before or after the program?

RACHEL: You know the drill – point the camera in my direction.

[Some scenes showing Uncle Jack Charles making his way to the studio]

FLOOR MANAGER: OK Rachel! Can someone get her miked up please! 4 minutes 30.

RACHEL: Hello, my name is Rachel Rockling and welcome to National Indigenous News. Tonight: Harry the Stockman – a big man with a big heart, and Johnathan Thurston - is he the best human ever?

FLOOR MANAGER: Camera 2 can you go wide please? Is that somebody in the background there?

RACHEL: Hey. Jack Charles? You know we are live here Uncle Jack.

JACK CHARLES: I just want to come chat to you about the Productivity Commission’s…

RACHEL: This is my show Jack! My show.

JACK: It’s an exclusive! An exclusive for just for you Rachel Rockling.

RACHEL: Oh, an exclusive hey? Well I guess… An exclusive you say?

JACK: Yes

RACHEL: Well I guess I can accommodate you then Jack - Uncle Jack isn’t it?

JACK: Yes Yes Yes

RACHEL: Can I call you that?

JACK: Yes Yes Yes – better than Aunty Jack ay.

RACHEL: Ha Ha Ha – Uncle Jack!

JACK: Thank you.

RACHEL: Let’s hear of your exclusive… when you join me… after the break.

-----

RACHEL: OK, so we’re back with Indigenous screen legend Jack Charles, with an exclusive just for me… I mean us at National Indigenous News! You comfortable Uncle?

JACK: Oh yes very comfortable thank you Rachel. So, I’m here to speak about the Overcoming Indigenous Disadvantage report. Now this report measures the wellbeing of our mob.

RACHEL: Yes?

JACK: It really is the most comprehensive report on our wellbeing produced here in Australia so far and it has real depth of analysis too.   I mean, there’s been so much work put into this by the Productivity Commission – it blows my mind!  They are the Productivity Commission after all ay!

RACHEL: Yes, Yes. It’s good to be productive.

JACK: Yes, this is all good stuff Rachel. They have masses of information on the Productivity Commission website, but if you want a quick Overview they have one of those too. You can take a look through the Overview and then check the website if you want more detail.

RACHEL: It’s great they’ve got an Overview, but even so, some of these reports are hard to digest for the average person that works in the Indigenous industry with our mob on the ground. We are all busy and don’t have time to wade through pages and pages of research needlessly. This generation has been recently criticised for having bad attention spans. How does this report fare in that department?

JACK: Well Rachel, this report is really accessible, with key findings, graphs and even case studies that work. The overall aim of this report is to provide information that we can use to improve the wellbeing of our mob, and I think they've done it pretty well. It’s really good, for any generation, or any attention span.

RACHEL: Oh yes. Tell me more?

JACK: Well you know, it doesn’t sugarcoat the outcomes but it does provide a balanced picture – some things are getting worse, some things are getting better, and even talks about strengths.  Also, the report tells you what information we can use to improve the wellbeing of our mob – like good quality evaluation of programs so we know what’s working and why.

RACHEL: Deadly Uncle! That sounds really good. But tell me, was there any Indigenous involvement in this?

JACK: Oh yes, us mob were involved, from all over Australia.

RACHEL: That sounds great. So, I really can use this report in a practical way then? For research into my hard hitting, fearless news stories perhaps?

JACK: Yes. If you or someone else work in an organisation with Aboriginal and Torres Strait Islander outcomes in mind, you absolutely have to have this report.

RACHEL: Well, you’ve sold me Jack. I’m going to go check it out after my bulletin tonight. No idea how you got past security but I’m glad you did!

JACK: You know I’m pretty crafty.

RACHEL: Thanks for your time Uncle Jack.

JACK: Thanks Rachel. Great hair by the way.

RACHEL: Thanks Uncle. And next time, use the front door.

Up next on National Indigenous News, how Blackfellas have embraced the online world.

-----

NARRATOR: To get the report and explore the areas of Indigenous wellbeing that interest you, go to pc.gov.au/OID2016, or find us on Facebook by searching for 'Overcoming Indigenous Disadvantage'.

The Overcoming Indigenous Disadvantage report is produced by the Productivity Commission on behalf of all Australian Governments.

This video was produced by NITV on behalf of the Productivity Commission.

-----

[looking at the Productivity Commission website]

UNCLE JACK: See Rachel – I told you. This report is so comprehensive!

RACHEL: Another exclusive coming up, thanks to the Productivity Commission!

[the end]

Download the Overview booklet

The Overview summarises the key messages and a subset of case studies on ‘things that work’. More detailed information can be found in the main report. Links to the relevant page in the main report are provided below for each indicator.

Indicator summary

Legend

The main measure has shown progress The main measure has shown progress

No significant change No significant change

The main measure has shown regress The main measure has shown regress

Data Gap Data Gap

Results are unclear Results are unclear

Click on the headings below to reveal summaries of the indicators and links to their respective section in the full report.

Expand allCollapse all

COAG targets

The seven COAG targets are high level social and economic outcomes that must improve in order to achieve the priority outcomes. These indicators are often closely interrelated and positive change will generally require action across a range of areas. In addition, most of these high level indicators are likely to take some time to improve, even if effective policies are implemented. Please note that the trend result is not an assessment of whether the target will be met.

4.1 Life expectancy

From 2005–2007 to 2010–2012, life expectancy at birth for Aboriginal and Torres Strait Islander Australians increased from 67.5 years to 69.1 years for males and from 73.1 years to 73.7 years for females.

More on page 4.4 (PDF - 40.6 MB)

4.2 Young child mortality

From 1998 to 2014, there was a significant decline in mortality rates for Aboriginal and Torres Strait Islander children aged 0–4 years (from 217 to 159 deaths per 100 000 population), with the greatest decrease in the infant (0<1 year) mortality rate (from 14 to 6 deaths per 1000 live births).

More on page 4.11 (PDF - 40.6 MB)

4.3 Early childhood education

Results for this indicator are unclear as the current method for deriving rates does not account for different starting ages for preschool and primary school which affects accuracy of the results. It is anticipated that a new method will be available for the next report. Data in this report are not to be used for assessment against the COAG target. In 2015, for Aboriginal and Torres Strait Islander children in the year before full time schooling 87 per cent were enrolled in preschool and 80 per cent were attending preschool.

More on page 4.18 (PDF - 40.6 MB)

4.4 Reading, writing and numeracy

Results for this indicator have fluctuated over time with no clear trend. Comparing 2008 and 2015, the proportion of Aboriginal and Torres Strait Islander students achieving national minimum standards increased for Years 3, 5 and 7 for reading, and for Years 5 and 9 for numeracy. However, volatility in the data means conclusions drawn from comparisons should not be interpreted as consistent improvement over time.

More on page 4.26 (PDF - 40.6 MB)

4.5 Year 1 to 10 attendance

In 2015 (similar to 2014), the overall attendance rate for Aboriginal and Torres Strait Islander students was 84 per cent.

More on page 4.36 (PDF - 40.6 MB)

4.6 Year 12 attainment

The proportion of Aboriginal and Torres Strait Islander 20–24 year olds completing year 12 or equivalent or above increased from 45 per cent in 2008 to 62 per cent in 2014-15.

More on page 4.43 (PDF - 40.6 MB)

4.7 Employment

Data for this indicator are difficult to interpret due to a number of changes including the Community Development Employment Projects (CDEP) program. The employment to population rate for Aboriginal and Torres Strait Islander 15–64 year olds increased from 38 per cent in 1994 to 54 per cent in 2008, before decreasing to 48 per cent in 2012-13 (similar to 2014-15), potentially partly driven by changes to the CDEP program.

More on page 4.51 (PDF - 40.6 MB)

Headline indicators

The six headline indicators are high level social and economic outcomes that must improve in order to achieve the priority outcomes. These indicators are often closely interrelated and positive change will generally require action across a range of areas. In addition, most of these high level indicators are likely to take some time to improve, even if effective policies are implemented.

4.8 Post-secondary education

The proportion of Aboriginal and Torres Strait Islander 20–64 year olds with a Certificate level III or above or studying increased from 26 per cent in 2002 to 47 per cent in 2014-15.

More on page 4.61 (PDF - 40.6 MB)

4.9 Disability and chronic disease

In 2012, the overall rate of disability among Aboriginal and Torres Strait Islander Australians was 23 per cent, little changed from 21 per cent in 2009. In 2014-15, hospitalisation rates for all chronic diseases (except cancer) were higher for Aboriginal and Torres Strait Islander Australians than for non-Indigenous Australians (ranging from twice the rate for circulatory disease to 11 times the rate for kidney failure).

More on page 4.69 (PDF - 40.6 MB)

4.10 Household and individual income

After adjusting for inflation, median real equivalised gross weekly household income for Aboriginal and Torres Strait Islander Australians increased from $402 in 2002 to $542 in 2014-15.

More on page 4.79 (PDF - 40.6 MB)

4.11 Substantiated child abuse and neglect

Data for this indicator are difficult to interpret, as increases in substantiations and orders might reflect a mix of changes in laws and policies relating to mandatory reporting, increased propensity to report, increased services and/or an increase in prevalence. Child protection substantiations for Aboriginal and Torres Strait Islander children increased from 30 per 1000 children in 2009-10 to 40 per 1000 children in 2014-15; and rates of children on care and protection orders increased from 21 per 1000 children in 2004-05 to 58 per 1000 children in 2014-15.

More on page 4.87 (PDF - 40.6 MB)

4.12 Family and community violence

In 2014-15, around 22 per cent of Aboriginal and Torres Strait Islander adults reported being a victim of physical or threatened violence — similar to rates in 2002 and 2008.

More on page 4.98 (PDF - 40.6 MB)

4.13 Imprisonment and juvenile detention

From 2000 to 2015, the imprisonment rate for Aboriginal and Torres Strait Islander adults increased 77 per cent. The daily average detention rate for Aboriginal and Torres Strait Islander youth decreased from 2007-08 to 2014-15 (from 416 to 349 per 100 000 10–17 year olds), but remains around 24 times the rate for non-Indigenous youth.

More on page 4.110 (PDF - 40.6 MB)

Governance, leadership and culture

Effective governance and leadership, and recognition of culture, play essential parts in the social and economic development of Aboriginal and Torres Strait Islander Australians, and influence virtually all indicators in the framework. Governance refers to both Aboriginal and Torres Strait Islander governance and government governance.

5.1 Valuing Indigenous Australians and their cultures

Time series data are not available due to extensive revisions to the main data source for the most recent reporting period. It is anticipated that time series data will be available for the next report. In 2014, four out of five people regarded Aboriginal and Torres Strait Islander culture (80 per cent) and history (83 per cent) as important, and over half (57 per cent) reported feeling personally proud of the culture.

More on page 5.3 (PDF - 40.6 MB)

5.2 Participation in decision making

There are no data available on Aboriginal and Torres Strait Islander Australians wanting to, and feeling that they can, participate in decision making that is important to them. As at 30 June 2016, 16 members of parliament identified as being Aboriginal and Torres Strait Islander (an increase from 13 at 30 June 2014). Parity of representation with population share is mixed across jurisdictions.

More on page 5.12 (PDF - 40.6 MB)

5.3 Engagement with services

The proportion of Aboriginal and Torres Strait Islander Australians aged 15 years and over that reported problems accessing services in the previous 12 months decreased from 30 per cent in 2008 to 24 per cent in 2014-15.

More on page 5.19 (PDF - 40.6 MB)

5.4 Case studies in governance

There is no trend category for this indicator, which is based on qualitative case studies. Research has identified six determinants of good governance that apply to Aboriginal and Torres Strait Islander organisations and communities, and governments: governing institutions; leadership; self-determination; capacity building; cultural match; resources.

More on page 5.28 (PDF - 40.6 MB)

5.5 Indigenous language revitalisation and maintenance

In 2014-15, similar to 2008, for Aboriginal and Torres Strait Islander Australians aged 3 years and over, 11 per cent were learning an Indigenous language and 16 per cent spoke an Indigenous language.

More on page 5.44 (PDF - 40.6 MB)

5.6 Indigenous cultural studies

There is no main measure for this indicator. Data are reported on supplementary measures around students taught Indigenous culture as part of their studies and the proportion of Aboriginal and Torres Strait Islander school staff. In 2014-15 consistent with 2008, around two-thirds of Aboriginal and Torres Strait Islander 5–24 year olds reported being taught Indigenous culture as part of their study.

More on page 5.53 (PDF - 40.6 MB)

5.7 Participation in community activities

The two main measures for this indicator have moved in opposite directions between 2002 and 2014-15 — for Aboriginal and Torres Strait Islander Australians aged 15 years and over, an increase in participation in sport and recreational activities (from 49 to 59 per cent), but a decrease in attendance at cultural events (from 68 to 63 per cent).

More on page 5.62 (PDF - 40.6 MB)

5.8 Access to traditional lands and waters

The proportion of Aboriginal and Torres Strait Islander adults that recognised traditional homelands increased from 70 per cent in 2002 to 74 per cent in 2014-15.

More on page 5.70 (PDF - 40.6 MB)

Early child development

Providing children with a good start can have a long lasting effect on the rest of their lives. This early stage can open up opportunities for the future — but can also create barriers that prevent children achieving their full potential. Poor maternal health, growing up in households with multiple disadvantage, or having poor access to effective services can affect children’s development, health, social and cultural participation, educational attainment and employment prospects. The indicators in this strategic area focus on the early drivers of long-term wellbeing which contribute to overcoming disadvantage.

6.1 Antenatal care

The proportion of Aboriginal and Torres Strait Islander women who gave birth and attended at least one antenatal visit in the first trimester, increased from 50 per cent in 2011 to 52 per cent in 2013.

More on page 6.3 (PDF - 40.6 MB)

6.2 Health behaviours during pregnancy

Nationally (excluding Victoria) the proportion of Aboriginal and Torres Strait Islander mothers who smoked during pregnancy decreased from 55 per cent in 2005 to 48 per cent in 2013.

More on page 6.10 (PDF - 40.6 MB)

6.3 Teenage birth rate

The Aboriginal and Torres Strait Islander teenage birth rate is at its lowest level since reporting began in 2004, with a rate of 57 births per 1000 women aged 15–19 years in 2014.

More on page 6.19 (PDF - 40.6 MB)

6.4 Birthweight

The proportion of Aboriginal and Torres Strait Islander mothers who had low birthweight babies decreased from 12 per cent in 2000 to 11 per cent in 2013.

More on page 6.26 (PDF - 40.6 MB)

6.5 Early childhood hospitalisations

Results for this indicator are difficult to interpret, as an increase in hospitalisations rate may indicate improved access to services rather than an increase in prevalence of underlying conditions. It is important to consider the leading causes, duration and frequency of children’s hospitalisations. The hospitalisation rate for Aboriginal and Torres Strait Islander 0–4 year olds increased from around 23 700 to 31 700 per 100 000 population, over the 10 years to 2014-15.

More on page 6.32 (PDF - 40.6 MB)

6.6 Injury and preventable disease

The two main measures for this indicator have moved in opposite directions over time — an increase in the hospitalisation rate (by 13 per cent between 2004-05 and 2014-15) and a decrease in the death rate (from 42 to 32 deaths per 100 000 Aboriginal and Torres Strait Islander children).

More on page 6.36 (PDF - 40.6 MB)

6.7 Ear health

The proportion of Aboriginal and Torres Strait Islander 0–14 year olds with a hearing condition decreased from 11 per cent in 2001 to 8 per cent in 2014-15.

More on page 6.42 (PDF - 40.6 MB)

6.8 Basic skills for life and learning

From 2009 to 2015, the proportions of Aboriginal and Torres Strait Islander children classified as developmentally ‘on track’ increased across all domains of the Australian Early Development Census (from 48–61 to 59–63 per cent).

More on page 6.49 (PDF - 40.6 MB)

Education and training

Education and training is a life-long activity, from learning and development in the home through to more formal settings of school education, vocational education and training and higher education. Education and training can help strengthen communities and regions both economically and socially, and there are strong links between higher levels of education and improved health outcomes.

7.1 Teacher quality

There is currently no nationally-agreed measure of teacher quality. In 2013, Aboriginal and Torres Strait Islander Australians made up a much lower proportion of teachers than students (around 1–2 per cent of teachers and 5 per cent of students for both primary and secondary schools).

More on page 7.3 (PDF - 40.6 MB)

7.2 School engagement

There is currently no nationally-agreed definition of school engagement and hence no agreed measure. Research suggests that school engagement is made up of three main elements: attendance, interest and motivation/effort. Data on attendance is reported in section 4.5 in this report.

More on page 7.9 (PDF - 40.6 MB)

7.3 Transition from school to work

The proportion of Aboriginal and Torres Strait Islander 17–24 year olds participating in post-school education, training or employment increased from 32 per cent in 2002 to 42 per cent in 2014-15.

More on page 7.14 (PDF - 40.6 MB)

Healthy lives

Health outcomes directly affect the quality of people’s lives, including their ability to socialise with family and friends, to participate in the community and to work and earn an income. Physical health outcomes are affected by the living environment, access to and use of health services, and lifestyle choices. Health risk behaviours, such as smoking and poor diet, are strongly associated with many aspects of socioeconomic disadvantage. Mental health issues are affected by a complex range of medical issues, historical factors, the stressors associated with entrenched disadvantage and drug and substance misuse.

8.1 Access to primary health care

There is no single measure of access to primary health care and the proxy measures reported have shown different trends over time — reporting of health as excellent or very good decreased from 44 per cent in 2008 to 40 per cent in 2014-15 and reporting not seeing a GP/specialist in the previous 12 months fell from 19 per cent in 2001 to 14 per cent in 2012‑13. (Changes should be interpreted with care as they may reflect changes to access and/or need.)

More on page 8.3 (PDF - 40.6 MB)

8.2 Potentially preventable hospitalisations

Results for this indicator have fluctuated over time with no clear trend. In 2014-15, the age-adjusted hospitalisation rates for Aboriginal and Torres Strait Islander Australians for potentially preventable conditions were more than 3 times (chronic conditions), more than twice (acute conditions) and almost 6 times (vaccine preventable conditions) the rates for non-Indigenous Australians.

More on page 8.10 (PDF - 40.6 MB)

8.3 Potentially avoidable deaths

For Aboriginal and Torres Strait Islander Australians the age standardised rate of potential avoidable deaths declined by 32 per cent between 1998 and 2014.

More on page 8.15 (PDF - 40.6 MB)

8.4 Tobacco consumption and harm

Between 2001 and 2014-15, the proportion of Aboriginal and Torres Strait Islander adults who were current daily smokers decreased from 51 per cent to 41 per cent.

More on page 8.20 (PDF - 40.6 MB)

8.5 Obesity and nutrition

There is no trend data for body mass index (BMI) as the measured BMI data in 2012-13 is not comparable with BMI data from previous surveys (based on self-reported height and weight). In 2012-13, 69 per cent of Aboriginal and Torres Strait Islander adults were overweight or obese.

More on page 8.25 (PDF - 40.6 MB)

8.6 Oral health

Nationally comparable time series data on tooth decay are not available. Supplementary data for Aboriginal and Torres Strait Islander children show that in 2014-15, 28 per cent reported they had teeth or gum problems.

More on page 8.30 (PDF - 40.6 MB)

8.7 Mental health

The proportion of Aboriginal and Torres Strait Islander adults who reported high/very high levels of psychological distress increased from 27 per cent in 2004-05 to 33 per cent in 2014-15.

More on page 8.35 (PDF - 40.6 MB)

8.8 Suicide and self-harm

The age-adjusted hospitalisation rate for intentional self-harm for Aboriginal and Torres Strait Islander Australians increased by 56 per cent from 2004-05 to 2014-15 and the age-adjusted suicide death rate was twice the rate for non‑Indigenous Australians in 2010–2014.

More on page 8.42 (PDF - 40.6 MB)

Economic participation

Participation in the economy can significantly influence living standards. Having a job can lead to improved incomes for families and communities, and also enhance self-esteem and reduce social alienation. Long-term reliance on income support is correlated with the disadvantages that accompany low socioeconomic status.

9.1 Employment by full time/part time status, sector and occupation

For employed Aboriginal and Torres Strait Islander Australians the proportion aged 18–64 years in full time employment increased from 54 per cent in 2002 to 63 per cent in 2014-15.

More on page 9.4 (PDF - 40.6 MB)

9.2 Indigenous owned or controlled land and business

The different forms of reported land tenure overlap and cannot be added together. In 2015, native title had been determined to exist in 28 per cent of Australia (up from 5 per cent in 2004). In 2014-15, 10 per cent of employed Aboriginal and Torres Strait adults were self-employed — an increase from 6 per cent in 2011–13).

More on page 9.10 (PDF - 40.6 MB)

9.3 Home ownership

The proportion of Aboriginal and Torres Strait Islander adults living in a home owned or being purchased by a member of their household increased from 21 per cent in 1994 to 27 per cent in 2002, and has remained at a similar level since (29 per cent in 2014-15).

More on page 9.23 (PDF - 40.6 MB)

9.4 Income support

From 2002 to 2014-15, the proportion of Aboriginal and Torres Strait Islander 18–64 year olds whose main source of income was employee income increased from 32 per cent to 43 per cent, with a corresponding decrease in the proportions on CDEP/other cash income (from 15 to 3 per cent).

More on page 9.29 (PDF - 40.6 MB)

Home environment

Better environmental health is especially beneficial for children’s physical and emotional wellbeing. Safe and healthy living conditions are influenced by the homes in which people live, the water they drink and the safe removal of waste.

10.1 Overcrowding in housing

The proportion of Aboriginal and Torres Strait Islander Australians living in overcrowded households decreased from 27 per cent in 2004-05 to 21 per cent in 2014-15.

More on page 10.3 (PDF - 40.6 MB)

10.2 Rates of disease associated with poor environmental health

The two main measures for this indicator have moved in opposite directions over time — an increase in the hospitalisation rate for most selected diseases, but a decrease in the death rate by 19 per cent.

More on page 10.13 (PDF - 40.6 MB)

10.3 Access to clean water and functional sewerage and electricity services

Data on access to water, sewerage and electricity services in discrete Aboriginal and Torres Strait Islander communities are relatively old and with limited time series. In 2014-15, the proportion of Aboriginal and Torres Strait Islander households living in houses of an acceptable standard was 82 per cent (similar to 2008 and an increase from 78 per cent in 2012-13).

More on page 10.21 (PDF - 40.6 MB)

Safe and supportive communities

Safe and supportive families and communities provide a resilient, caring and protective environment, promoting a range of positive outcomes. However, problems in families and communities can contribute to disrupted relationships, social alienation, alcohol and drug misuse and family violence.

11.1 Alcohol consumption and harm

In 2014-15, 15 per cent of Aboriginal and Torres Strait Islander Australians aged 15 years and over reported exceeding lifetime alcohol risk guidelines (similar to 2002, though lower than 2008).

More on page 11.3 (PDF - 40.6 MB)

11.2 Drug and other substance use and harm

In 2014-15, 31 per cent of Aboriginal and Torres Strait Islander adults reported use of illicit substances in the previous 12 months, an increase from 23 per cent in 2002.

More on page 11.12 (PDF - 40.6 MB)

11.3 Juvenile diversions

Nationally comparable data are not currently available. However, for available data, diversion rates for Aboriginal and Torres Strait Islander young people aged 10–17 years are around two-fifths to two-thirds (0.4 to 0.7 times) the rates for non-Indigenous young people across jurisdictions in 2014-15.

More on page 11.19 (PDF - 40.6 MB)

11.4 Repeat offending

On 30 June 2015, 77 per cent of Aboriginal and Torres Strait Islander prisoners had a known prior imprisonment, relatively unchanged since 2000. In 2014-15, 53 per cent of Aboriginal and Torres Strait Islander young people returned to youth justice supervision, similar to 2013-14.

More on page 11.25 (PDF - 40.6 MB)

11.5 Community functioning

Whilst there is no overall measure of community functioning, for the six themes that make up community functioning, outcomes for 2014-15 are not significantly different to those for 2008.

More on page 11.31 (PDF - 40.6 MB)

Download the report

Download report chapters and data

Click on the headings below to reveal chapter details and data.

Expand allCollapse all

Preliminaries and Overview

  • Cover
  • Copyright and publication detail
  • Foreword
  • Terms of reference
  • Contents
  • Steering Committee
  • Acknowledgments
  • Acronyms and abbreviations
  • Glossary
  • Key points

See also: Overview booklet

Chapter 1: Introduction

  • 1.1 Origins of the OID report
  • 1.2 Role and purpose of the OID report
  • 1.3 Putting the OID report into context
  • 1.4 The historical context
  • 1.5 Recent COAG developments
  • 1.6 The Review of Government Service Provision

Chapter 2: The framework

  • 2.1 The framework
  • 2.2 Key concepts incorporated in the framework

Chapter 3: Key themes and interpretation

  • 3.1 Estimating the Aboriginal and Torres Strait Islander populations
  • 3.2 Interpreting data in the report
  • 3.3 Demographics of the Aboriginal and Torres Strait Islander population
  • 3.4 Remoteness
  • 3.5 Interactions across the report
  • 3.6 Things that work — success factors
  • 3.7 International comparisons

Chapter 4: COAG targets and headline indicators

  • 4.1 Life expectancy
  • 4.2 Young child mortality
  • 4.3 Early childhood education
  • 4.4 Reading, writing and numeracy
  • 4.5 Year 1 to 10 attendance
  • 4.6 Year 12 attainment
  • 4.7 Employment
  • 4.8 Post-secondary education — participation and attainment
  • 4.9 Disability and chronic disease
  • 4.10 Household and individual income
  • 4.11 Substantiated child abuse and neglect
  • 4.12 Family and community violence
  • 4.13 Imprisonment and juvenile detention

Chapter 5: Governance, leadership and culture

  • 5.1 Valuing Indigenous Australians and their cultures
  • 5.2 Participation in decision making
  • 5.3 Engagement with services
  • 5.4 Case studies in governance
  • 5.5 Indigenous language revitalisation and maintenance
  • 5.6 Indigenous cultural studies
  • 5.7 Participation in community activities
  • 5.8 Access to traditional lands and waters

Chapter 6: Early child development

  • 6.1 Antenatal care
  • 6.2 Health behaviours during pregnancy
  • 6.3 Teenage birth rate
  • 6.4 Birthweight
  • 6.5 Early childhood hospitalisations
  • 6.6 Injury and preventable disease
  • 6.7 Ear health
  • 6.8 Basic skills for life and learning

Chapter 7: Education and training

  • 7.1 Teacher quality
  • 7.2 School engagement
  • 7.3 Transition from school to work

Chapter 8: Healthy lives

  • 8.1 Access to primary health care
  • 8.2 Potentially preventable hospitalisations
  • 8.3 Potentially avoidable deaths
  • 8.4 Tobacco consumption and harm
  • 8.5 Obesity and nutrition
  • 8.6 Oral health
  • 8.7 Mental health
  • 8.8 Suicide and self-harm

Chapter 9: Economic participation

  • 9.1 Employment by full time/part time status, sector and occupation
  • 9.2 Indigenous owned or controlled land and business
  • 9.3 Home ownership
  • 9.4 Income support

Chapter 10: Home environment

  • 10.1 Overcrowding in housing
  • 10.2 Rates of disease associated with poor environmental health
  • 10.3 Access to clean water and functional sewerage and electricity services

Chapter 11: Safe and supportive communities

  • 11.1 Alcohol consumption and harm
  • 11.2 Drug and other substance use and harm
  • 11.3 Juvenile diversions
  • 11.4 Repeat offending
  • 11.5 Community functioning

Chapter 12: Outcomes for Torres Strait Islander people

Chapter 13: Measuring factors that improve outcomes

  • 13.1 Interactions between measures of wellbeing
  • 13.2 Factors related to primary education achievement

Appendix 2: Aboriginal and Torres Strait Islander population and language use

The purpose of these fact sheets is to highlight and summarise important material within the Overcoming Indigenous Disadvantage report. To understand the information in the report, it is important to consider the factors that have affected the outcomes being measured.

Expand allCollapse all

Fact sheet 1: Trends in national outcomes

How have trends in outcomes been assessed?

The figure summarises changes in outcomes over time. The following approach was taken to assessing change over time:

  • The key consideration was change over time in outcomes for Aboriginal and Torres Strait Islander Australians NOT the gap to non-Indigenous Australians. It is important to acknowledge improvements in outcomes for Aboriginal and Torres Strait Islander Australians, even if improvements for non-Indigenous Australians mean that the gap has not narrowed.
  • Change has been assessed by comparing latest available data to earliest available data for each indicator. Therefore, the time period may be different for different indicators.
  • If apparent change was not statistically significant this was recorded as no change.
  • The focus has been on the main measure/s identified for each indicator. Supplementary measures for some indicators may show different trends.
  • No trend has been identified where it is not clear whether an observed change in the main measure is positive or negative, or where improvements to data collections have created a break in series.

Results have been summarised into the following five categories:

Progress Progress - where the main easure for an indicator shows outcomes for Aboriginal and Torres Strait Islander Australians improving over time.

No change No significant change - where the main measure for an indicator shows no meaningful change in outcomes for Aboriginal and Torres Strait Islander Australians.

Regress Regress - where the main measure for an indicator shows a decline in outcomes for Aboriginal and Torres Strait Islander Australians.

Data Gap Data gap - where no suitable trend data are available (this does not include indicators where improvements to data collections have created a break in series, which are labelled 'unclear').

Unclear Unclear - where it is not clear whether an observed change in the main measure is positive or negative, or where improvements to data collections have created a break in series. Results should be considered in the light of the contextual material in the relevant section of the report.

There are 52 indicators in this report. However, one indicator (5.4 Case studies in governance) is not designed to include quantitative measures.

Spread the word and join the conversation on:    Twitterand/or   Facebook

Printed copies

Printed copies of this report can be purchased from Canprint Communications.

Publications feedback

We value your comments about this publication and encourage you to provide feedback.

Submit publications feedback