Report on Government Services 2015
Chapter 13, Volume F
Aged care services
The Aged care services chapter (chapter 13) reports on the performance of government funded services for older people, including assessment, residential care and community based services.
Download the chapter
- Chapter 13 Aged care services, attachment tables, and data quality information (PDF - 4252 Kb)
- Chapter 13 Attachment tables (XLSX - 1266 Kb)
- Key Facts
- Indicator Framework
- Indicator Results
Total government expenditure reported on aged care services in 2013–14 was $14.8 billion. This included residential care services ($10.0 billion) and community care services ($3.8 billion).
Community care services expenditure included expenditure of $2.1 billion on Home and Community Care (HACC) for older people (aged 65 years or over and Aboriginal and Torres Strait Islander Australians aged 50–64 years — except in Victoria and WA where it is for all people), with the Australian Government contributing $1.7 billion and the Victorian and WA governments contributing $357.2 million. Australian Government expenditure on Home Care levels 1–4 was a further $1.3 billion in 2013–14.
At June 2014, there were 189 283 operational places (excluding flexible care places) in residential care services and 66 954 operational places (including flexible places) in Home Care levels 1–4. During 2013–14, 224 222 older clients received permanent care and 46 851 received respite care in a residential aged care facility nationally. There were also 64 312 older clients of Home Care levels 1–2, 19 942 older clients of Home Care levels 3–4 and 775 959 older clients of HACC in 2013–14.
The aged care system aims to promote the wellbeing and independence of older people and their carers through the funding and delivery of care services that are accessible, appropriate to needs, high quality, efficient and person–centred.
The performance indicator framework provides information on equity, efficiency and effectiveness, and distinguishes the outputs and outcomes of government aged care services. The performance indicator framework shows which data are complete and comparable in the 2015 Report.
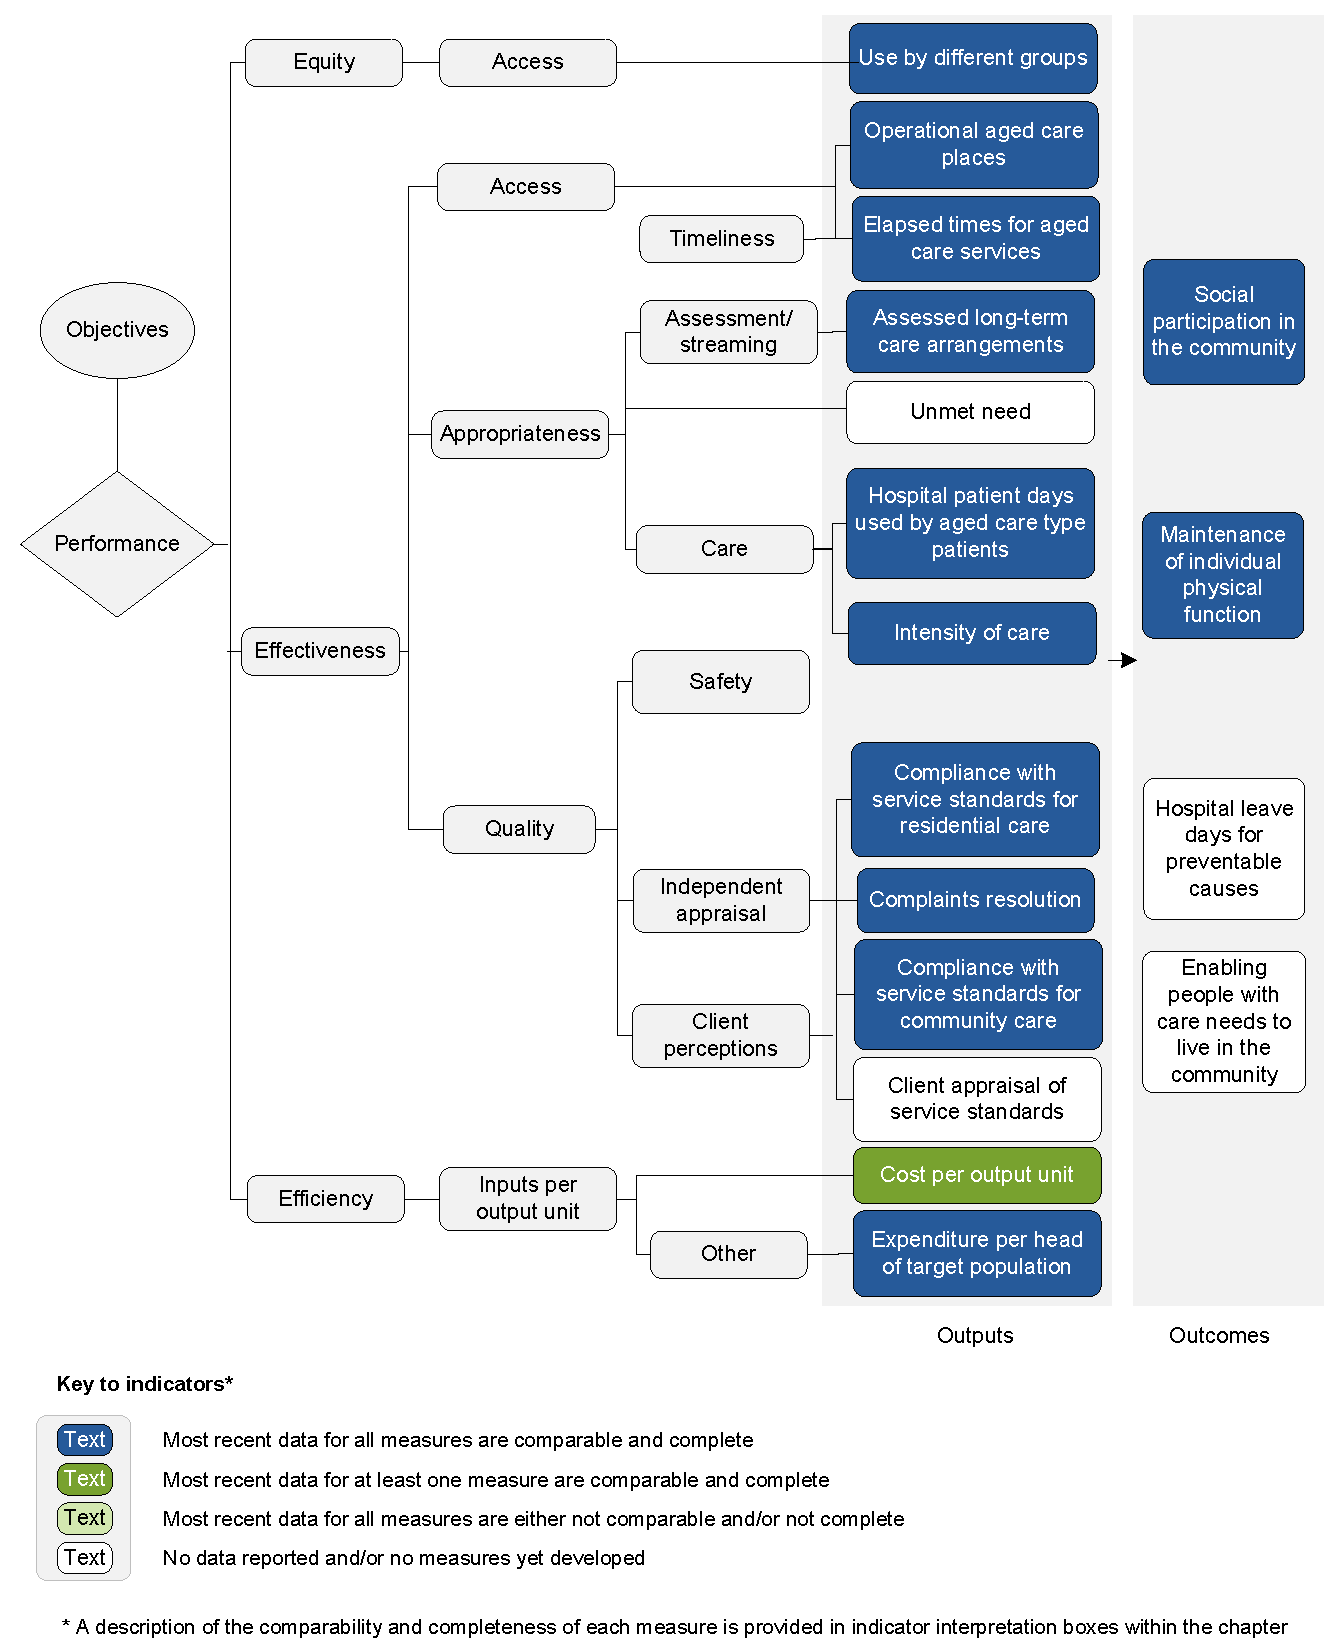
An overview of the Aged care services performance indicator results are presented. Information to assist the interpretation of these data can be found in the indicator interpretation boxes in the Aged care services chapter and attachment tables.
Equity — Access indicators
Use by different groups
Most recent data for this measure are comparable and complete (chapter 13).
Access to residential aged care services by all people
| NSW | Vic | Qld | WA | SA | Tas | ACT | NT | Aust | |
|---|---|---|---|---|---|---|---|---|---|
| No. | 52.8 | 53.0 | 47.2 | 45.6 | 58.8 | 47.0 | 43.0 | 27.0 | 51.1 |
Access to residential aged care services by Aboriginal and Torres Strait Islander Australians
| NSW | Vic | Qld | WA | SA | Tas | ACT | NT | Aust | |
|---|---|---|---|---|---|---|---|---|---|
| No. | 11.3 | 22.9 | 17.4 | 24.8 | 33.1 | 5.5 | 5.0 | 32.2 | 18.5 |
Access to residential aged care services by veterans
| NSW | Vic | Qld | WA | SA | Tas | ACT | NT | Aust | |
|---|---|---|---|---|---|---|---|---|---|
| No. | 160.4 | 168.9 | 126.8 | 126.6 | 163.4 | 127.5 | 98.5 | 43.4 | 149.0 |
Effectiveness — Access indicators
Operational aged care places
Most recent data for this measure are comparable and complete (chapter 13).
| NSW | Vic | Qld | WA | SA | Tas | ACT | NT | Aust | |
|---|---|---|---|---|---|---|---|---|---|
| No. | 111.2 | 111.1 | 108.4 | 110.1 | 118.2 | 107.5 | 110.7 | 198.9 | 111.3 |
Elapsed times for aged care services
Most recent data for this measure are comparable and complete (chapter 13).
| NSW | Vic | Qld | WA | SA | Tas | ACT | NT | Aust | |
|---|---|---|---|---|---|---|---|---|---|
| % | 71.9 | 75.0 | 63.5 | 62.3 | 66.6 | 70.1 | 52.2 | 45.1 | 69.4 |
Effectiveness — Appropriateness indicators
Assessed long-term care arrangements
Most recent data for this measure are comparable and complete (chapter 13).
| NSW | Vic | Qld | WA | SA | Tas | ACT | NT | Aust | |
|---|---|---|---|---|---|---|---|---|---|
| % | 51.4 | 59.9 | 43.8 | 53.4 | 39.7 | 62.2 | 68.7 | 71.1 | 52.4 |
Hospital patient days used by aged care type patients
Most recent data for this measure are comparable and complete (chapter 13).
| NSW | Vic | Qld | WA | SA | Tas | ACT | NT | Aust | |
|---|---|---|---|---|---|---|---|---|---|
| % | 7.0 | 29.4 | 12.8 | 18.9 | 8.2 | 8.5 | 24.3 | 67.3 | 10.9 |
Intensity of care
Most recent data for this measure are comparable and complete (chapter 13).
| NSW | Vic | Qld | WA | SA | Tas | ACT | NT | Aust | |
|---|---|---|---|---|---|---|---|---|---|
| % | 90.8 | 94.0 | 94.2 | 91.7 | 95.3 | 94.9 | 96.8 | 96.2 | 92.8 |
Effectiveness — Quality indicators
Compliance with service standards for residential care
Most recent data for this measure are comparable and complete (chapter 13).
| NSW | Vic | Qld | WA | SA | Tas | ACT | NT | Aust | |
|---|---|---|---|---|---|---|---|---|---|
| % | 90.1 | 89.9 | 81.0 | 92.7 | 86.7 | 100.0 | 100.0 | 40.0 | 87.9 |
Complaints resolution
Most recent data for this measure are comparable and complete (chapter 13).
| NSW | Vic | Qld | WA | SA | Tas | ACT | NT | Aust | |
|---|---|---|---|---|---|---|---|---|---|
| No. | 21.3 | 25.4 | 22.1 | 18.6 | 23.8 | 20.9 | 11.4 | 42.6 | 22.4 |
Compliance with service standards for community care
Most recent data for this measure are comparable and complete (chapter 13).
| NSW | Vic | Qld | WA | SA | Tas | ACT | NT | Aust | |
|---|---|---|---|---|---|---|---|---|---|
| % | 77.8 | 63.8 | 24.3 | 100.0 | 95.2 | 66.7 | 50.0 | 42.3 | 67.2 |
| NSW | Vic | Qld | WA | SA | Tas | ACT | NT | Aust | |
|---|---|---|---|---|---|---|---|---|---|
| % | 76.3 | 84.0 | 42.1 | 100.0 | 96.8 | 77.8 | 100.0 | 53.8 | 74.6 |
| NSW | Vic | Qld | WA | SA | Tas | ACT | NT | Aust | |
|---|---|---|---|---|---|---|---|---|---|
| % | 93.4 | 96.8 | 59.8 | 100.0 | 87.3 | 77.8 | 100.0 | 57.7 | 85.5 |
Efficiency indicators
Cost per output unit
Most recent data for this measure are comparable and complete (chapter 13).
| NSW | Vic | Qld | WA | SA | Tas | ACT | NT | Aust | |
|---|---|---|---|---|---|---|---|---|---|
| $ | 574 | 472 | 592 | 576 | 697 | 563 | 539 | 1547 | 560 |
Expenditure per head of target population
Most recent data for this measure are comparable and complete (chapter 13).
| NSW | Vic | Qld | WA | SA | Tas | ACT | NT | Aust | |
|---|---|---|---|---|---|---|---|---|---|
| $ | 2828 | 3025 | 2680 | 2535 | 3229 | 2688 | 2040 | 1130 | 2828 |
Outcome indicators
Social participation in the community
| NSW | Vic | Qld | WA | SA | Tas | ACT | NT | Aust | |
|---|---|---|---|---|---|---|---|---|---|
| % | 49.3 ±4.7 | 44.9 ±5.7 | 49.8 ±6.9 | 39.2 ±9.7 | 45.2 ±9.1 | 40.6 ±9.0 | 42.6 ±11.2 | 56.3 ±23.3 | 46.8 ±2.5 |
| NSW | Vic | Qld | WA | SA | Tas | ACT | NT | Aust | |
|---|---|---|---|---|---|---|---|---|---|
| % | 5.2 ±1.5 | 6.6 ±1.8 | 9.2 ±2.3 | 4.7 ±2.1 | 4.5 ±1.7 | 10.4 ±3.7 | 4.4 ±3.3 | 6.3 ±5.4 | 6.4 ±0.7 |
Maintenance of individual physical function
Most recent data for this measure are comparable and complete (chapter 13).
| NSW | Vic | Qld | WA | SA | Tas | ACT | NT | Aust | |
|---|---|---|---|---|---|---|---|---|---|
| no. | 80 | 65 | 75 | 58 | 69 | 65 | 89 | 81 | 72 |
| NSW | Vic | Qld | WA | SA | Tas | ACT | NT | Aust | |
|---|---|---|---|---|---|---|---|---|---|
| no. | 91 | 72 | 86 | 65 | 84 | 84 | 96 | 92 | 82 |
Some results reported here include 95 per cent confidence intervals (for example, 80 per cent ± 2.7 per cent).