Report on Government Services 2015
Chapter 16, Volume F
Youth justice
The Youth justice services chapter (chapter 16) of the Report on Government Services reports on the performance of governments in providing youth justice services.
Download the chapter
- Chapter 16 Youth justice services, attachment tables, and data quality information (PDF - 2176 Kb)
- Chapter 16 Attachment tables (XLSX - 294 Kb)
- Key Facts
- Indicator Framework
- Indicator Results
A total of 10 940 young people experienced youth justice supervision at some time during 2012-13. The majority of young offenders experienced community-based youth justice supervision - nationally, on an average day in 2012-13, 85.5 per cent of young people aged 10-17 years who were supervised by youth justice services were in the community.
Aboriginal and Torres Strait Islander young people were significantly overrepresented in youth justice detention. The daily average number of Aboriginal and Torres Strait Islander young people aged 10-17 years detained in youth justice detention centres was 454 in 2012-13.
Nationally, the daily average detention rate for Aboriginal and Torres Strait Islander young people aged 10-17 years in 2012-13 was 364.4 per 100 000 Aboriginal and Torres Strait Islander people aged 10-17 years. The number and rate for non-Indigenous young people aged 10-17 years in 2012-13 was 329 and 15.4 per 100 000 young people respectively.
Total recurrent expenditure on youth justice services - comprising detention-based supervision, community-based supervision and group conferencing - was approximately $673 million across Australia in 2013-14. Detention-based supervision accounted for the majority of government expenditure (60.8 per cent, or $409 million).
Youth justice services aim to assist young people to address their offending behaviour and take responsibility for the effect their behaviour has on victims and the wider community, and to promote community safety.
In so doing, youth justice services aim to ensure that the interests and views of victims are heard and that services are delivered to rehabilitate young offenders and reintegrate them into their community.
The performance indicator framework provides information on equity, efficiency and effectiveness, and distinguishes the outputs and outcomes of youth justice services. The performance indicator framework shows which data are complete and comparable in the 2015 Report.
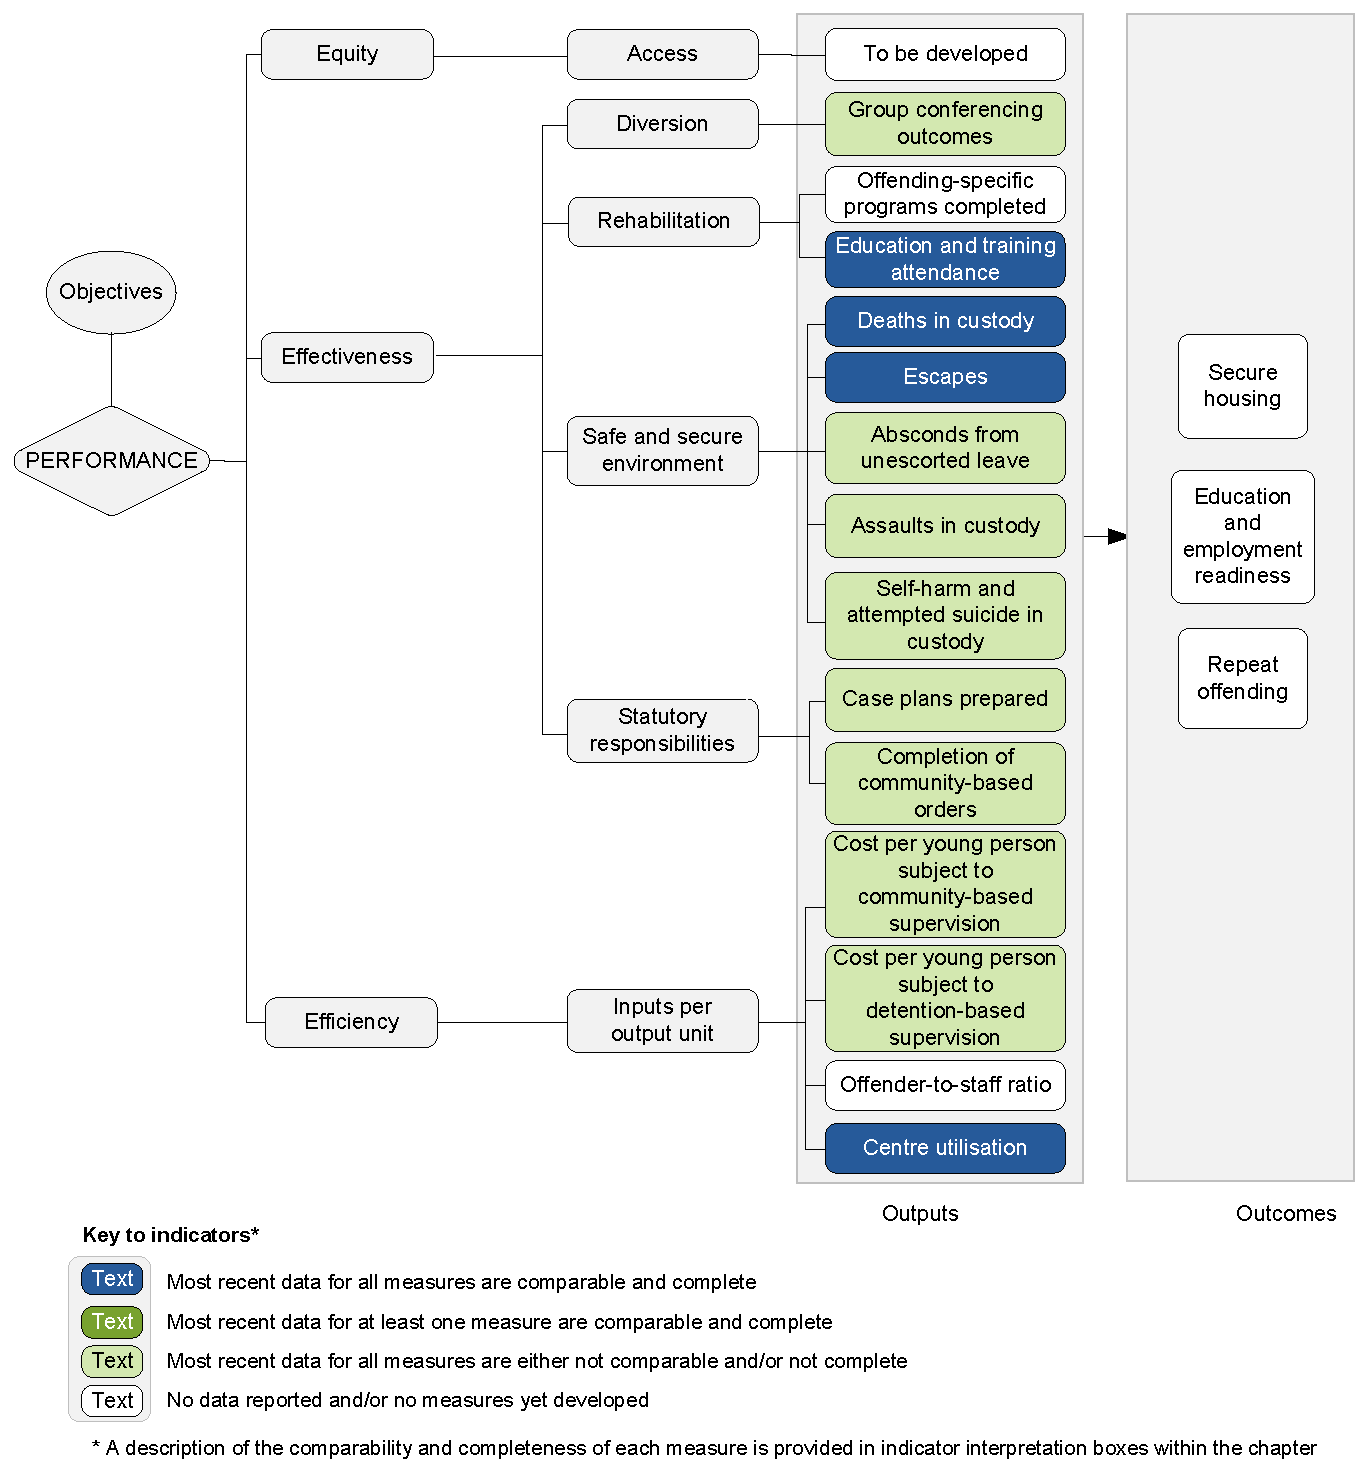
An overview of the Youth justice services performance indicator results are presented. Information to assist the interpretation of these data can be found in the indicator interpretation boxes in the Youth justice services chapter and attachment tables.
Effectiveness — Diversion indicators
Group conferencing outcomes
Data for this indicator are not complete or not directly comparable (chapter 16)
| NSW | Vic | Qld | WA | SA | Tas | ACT | NT | Aust | |
|---|---|---|---|---|---|---|---|---|---|
| % | 99.0 | 100.0 | 95.4 | 92.3 | 85.9 | 89.3 | 95.9 | 100.0 | 92.9 |
Effectiveness — Rehabilitation indicators
Education and training attendance
Data for this indicator are comparable, subject to caveats (chapter 16)
| NSW | Vic | Qld | WA | SA | Tas | ACT | NT | Aust | |
|---|---|---|---|---|---|---|---|---|---|
| % | 100.0 | 100.0 | 100.0 | 90.2 | 100.0 | 100.0 | 100.0 | 100.0 | 98.8 |
Effectiveness — Safe and secure environment indicators
Deaths in custody
Data for this indicator are comparable, subject to caveats (chapter 16)
| NSW | Vic | Qld | WA | SA | Tas | ACT | NT | Aust | |
|---|---|---|---|---|---|---|---|---|---|
| No. | – | – | – | – | – | – | – | – | – |
Source: Attachment table 16A.14
Escapes
Data for this indicator are comparable, subject to caveats (chapter 16)
| NSW | Vic | Qld | WA | SA | Tas | ACT | NT | Aust | |
|---|---|---|---|---|---|---|---|---|---|
| Rate | – | 0.2 | – | – | – | 7.0 | – | 2.3 | 0.2 |
Source: Attachment table 16A.16
| NSW | Vic | Qld | WA | SA | Tas | ACT | NT | Aust | |
|---|---|---|---|---|---|---|---|---|---|
| Rate | 12.9 | 14.8 | – | – | – | – | 49.5 | – | 12.9 |
Source: Attachment table 16A.16
Absconds from unescorted leave
Data for this indicator are not complete or not directly comparable (chapter 16)
| NSW | Vic | Qld | WA | SA | Tas | ACT | NT | Aust | |
|---|---|---|---|---|---|---|---|---|---|
| Rate | – | – | .. | .. | – | – | – | – | – |
Source: Attachment table 16A.17
Assaults in custody
Data for this indicator are not complete or not directly comparable (chapter 16)
| NSW | Vic | Qld | WA | SA | Tas | ACT | NT | Aust | |
|---|---|---|---|---|---|---|---|---|---|
| Rate | – | 1.1 | 0.3 | na | 0.5 | – | 1.7 | – | – |
Source: Attachment table 16A.18
| NSW | Vic | Qld | WA | SA | Tas | ACT | NT | Aust | |
|---|---|---|---|---|---|---|---|---|---|
| Rate | 3.0 | 10.4 | 7.1 | na | 11.5 | 53.7 | 5.1 | 14.4 | – |
Source: Attachment table 16A.19
Self-harm and attempted suicide in custody
Data for this indicator are not complete or not directly comparable (chapter 16)
| NSW | Vic | Qld | WA | SA | Tas | ACT | NT | Aust | |
|---|---|---|---|---|---|---|---|---|---|
| Rate | 0.9 | 0.4 | 0.5 | na | – | – | – | 1.2 | – |
Source: Attachment table 16A.20
| NSW | Vic | Qld | WA | SA | Tas | ACT | NT | Aust | |
|---|---|---|---|---|---|---|---|---|---|
| Rate | 2.4 | 0.8 | 1.5 | na | 3.8 | – | 6.8 | 10.4 | – |
Source: Attachment table 16A.20
Effectiveness — Statutory responsibilities indicators
Case plans prepared
Data for this indicator are not complete or not directly comparable (chapter 16)
| NSW | Vic | Qld | WA | SA | Tas | ACT | NT | Aust | |
|---|---|---|---|---|---|---|---|---|---|
| % | 100.0 | 96.5 | 84.7 | 100.0 | na | 100.0 | 100.0 | 88.2 | 96.9 |
Source: Attachment table 16A.22
| NSW | Vic | Qld | WA | SA | Tas | ACT | NT | Aust | |
|---|---|---|---|---|---|---|---|---|---|
| % | 96.9 | 97.1 | 88.1 | na | na | 56.5 | 93.0 | 11.6 | 90.1 |
Source: Attachment table 16A.22
Completion of community-based orders
Data for this indicator are not complete or not directly comparable (chapter 16)
| NSW | Vic | Qld | WA | SA | Tas | ACT | NT | Aust | |
|---|---|---|---|---|---|---|---|---|---|
| % | 80.8 | 91.2 | 78.7 | 66.9 | 88.6 | 90.5 | 65.1 | 59.0 | 79.6 |
Efficiency indicators
Centre utilisation
Data for this indicator are comparable, subject to caveats (chapter 16)
| NSW | Vic | Qld | WA | SA | Tas | ACT | NT | Aust | |
|---|---|---|---|---|---|---|---|---|---|
| % | 72.9 | 68.2 | 98.0 | 81.8 | 59.5 | 39.1 | 40.2 | 74.2 | 74.3 |