Report on Government Services 2015
Chapter 12, Volume E
Mental health management
The Mental health management chapter (chapter 12) of the Report on Government Services reports on the performance of governments in the management of mental health. Mental illness is a significant cause of morbidity and mortality in Australia and is identified by governments as a national health priority area.
Download the chapter
- Chapter 12 Mental health management, attachment tables, and data quality information (PDF - 4029 Kb)
- Chapter 12 Attachment tables (XLSX - 1787 Kb)
- Key Facts
- Indicator Framework
- Indicator Results
Governments provide or fund a range of mental health management services. The key services are Medicare Benefits Schedule (MBS) subsidised mental health services; admitted patient care in hospitals; and community-based services that provide ambulatory care, residential care and support services for people with a mental illness living in the community.
Real government recurrent expenditure of around $7.3 billion was allocated to mental health services in 2012-13. State and Territory governments made the largest contribution ($4.5 billion, or 61.9 per cent), although this included some Australian Government funds under the National Health Reform Agreement. The Australian Government spent $2.8 billion or 38.1 per cent.
In 2012-13, 1.9 per cent and 7.8 per cent of the total population received State and Territory governments' specialised public mental health services (excluding Victoria, for which data were not available) and MBS subsidised mental health services, respectively.
The key broad objectives of National Mental Health Policy are to:
- promote the mental health and well-being of the Australian community and, where possible, prevent the development of mental health problems and mental illness
- reduce the impact of mental health problems and mental illness, including the effects of stigma on individuals, families and the community
- promote recovery from mental health problems and mental illness
- assure the rights of people with mental health problems and mental illness, and enable them to participate meaningfully in society.
The performance indicator framework provides information on equity, efficiency and effectiveness, and distinguishes the outputs and outcomes of mental health management. The performance indicator framework shows which data are complete and comparable in the 2015 Report.
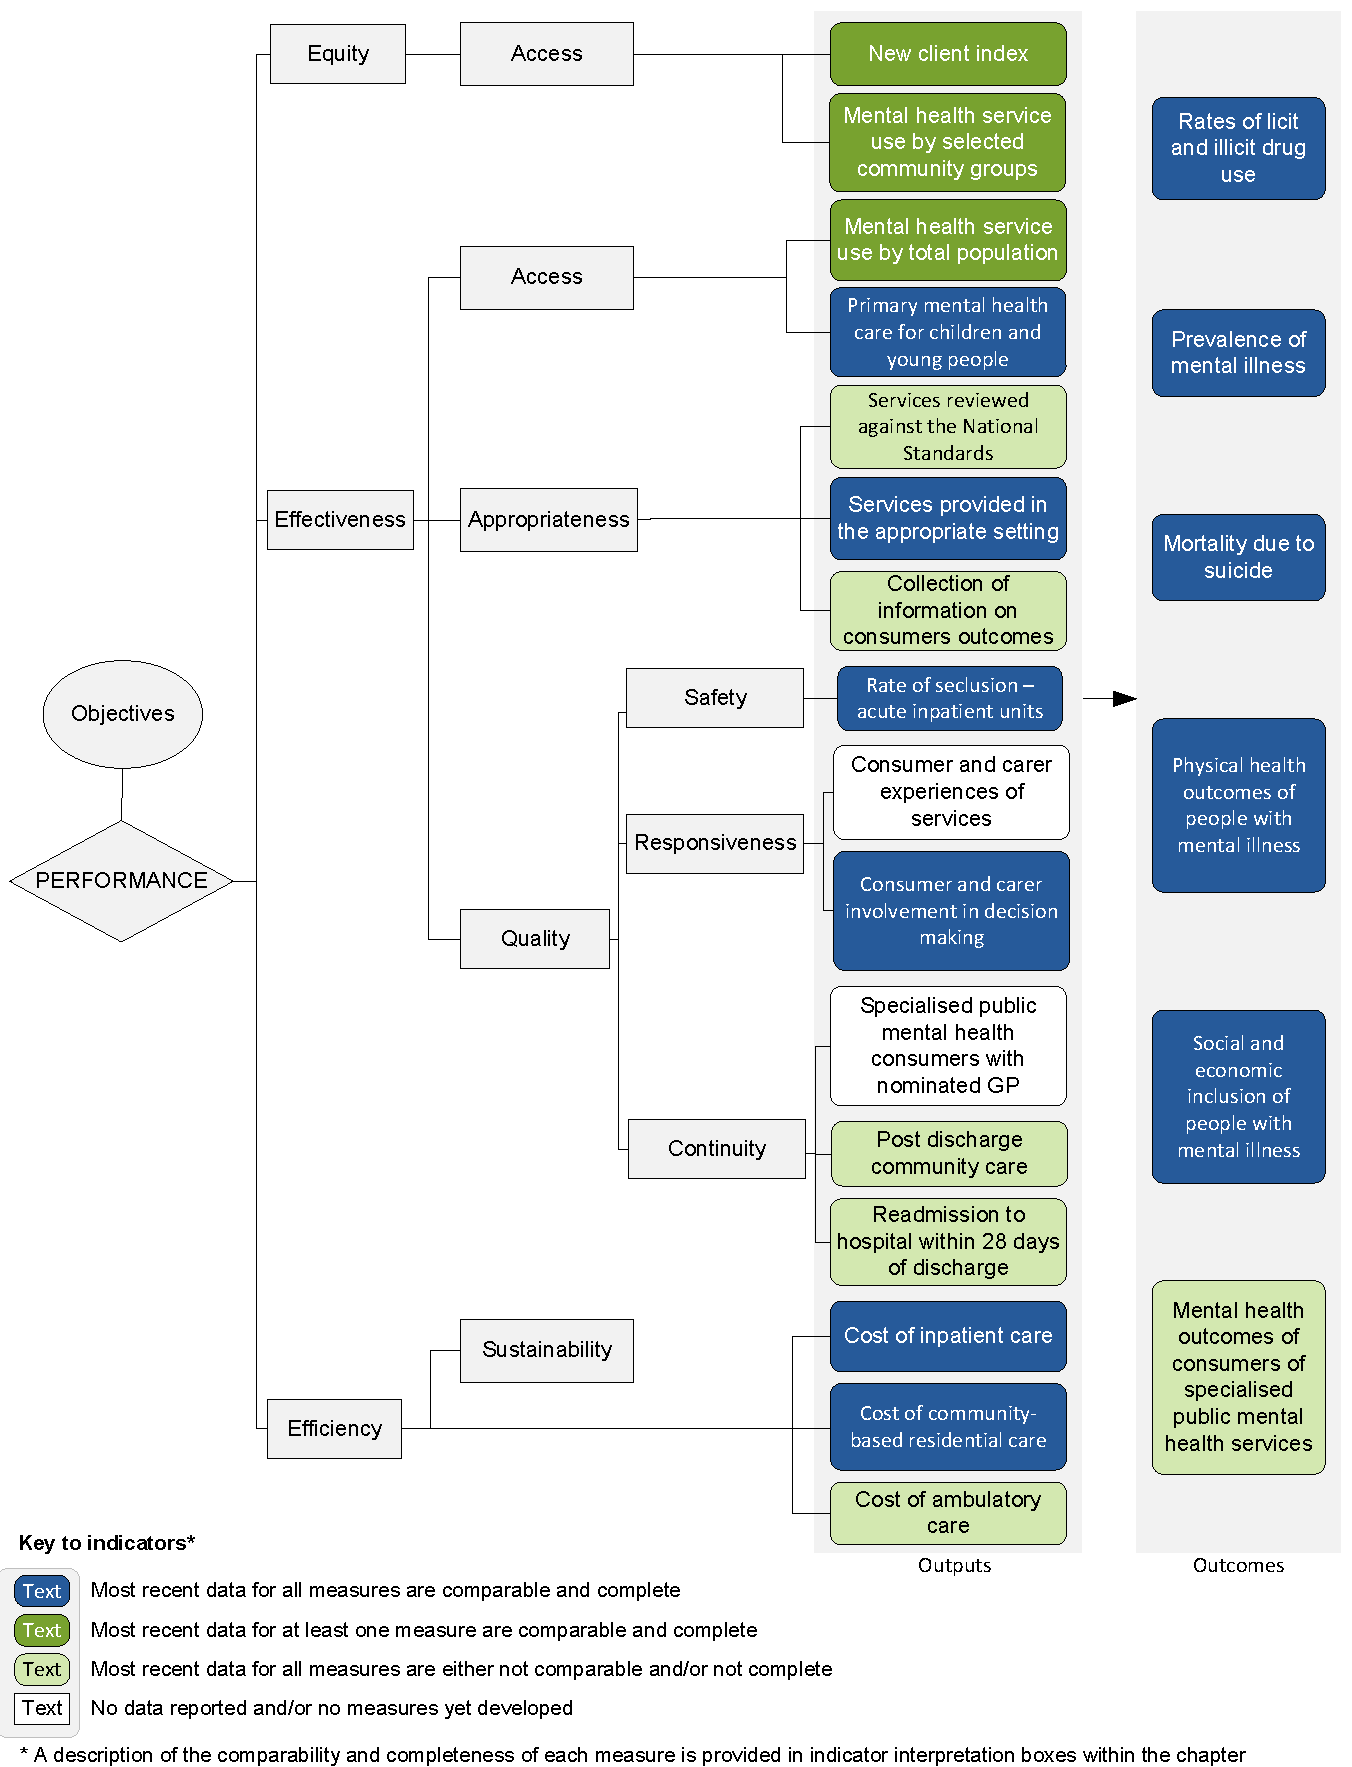
An overview of the Mental health management performance indicator results are presented. Information to assist the interpretation of these data can be found in the indicator interpretation boxes in the Mental health management chapter and attachment tables.
Equity — Access indicators
New client index
Most recent data for this measure are not comparable nor complete (chapter 12).
| NSW | Vic | Qld | WA | SA | Tas | ACT | NT | Aust | |
|---|---|---|---|---|---|---|---|---|---|
| % | 40.0 | na | 45.3 | 42.6 | 43.6 | 58.1 | 41.5 | 47.9 | 42.8 |
Source: Attachment table 12A.33 and tables 12A.35-36.
| NSW | Vic | Qld | WA | SA | Tas | ACT | NT | Aust | |
|---|---|---|---|---|---|---|---|---|---|
| % | 35.1 | 33.7 | 37.3 | 38.9 | 34.2 | 36.8 | 38.7 | 48.6 | 35.6 |
Mental health service use by selected community groups
Most recent data for this measure are comparable (subject to caveats), but not complete (chapter 12).
| NSW | Vic | Qld | WA | SA | Tas | ACT | NT | Aust | |
|---|---|---|---|---|---|---|---|---|---|
| Aboriginal and Torres Strait Islander | 4.9 | na | 4.5 | 5.3 | 5.9 | 1.4 | 6.3 | 4.1 | 4.7 |
| Non-Indigenous | 1.5 | na | 1.8 | 1.9 | 1.8 | 1.2 | 2.2 | 2.4 | 1.7 |
Source: Attachment table 12A.33 and tables 12A.35-36.
Most recent data for this measure are comparable and complete (chapter 12).
| NSW | Vic | Qld | WA | SA | Tas | ACT | NT | Aust | |
|---|---|---|---|---|---|---|---|---|---|
| Aboriginal and Torres Strait Islander | 10.7 | 12.0 | 7.1 | 4.0 | 8.2 | 8.8 | 11.4 | 1.4 | 7.7 |
| Non-Indigenous | 7.9 | 8.7 | 7.7 | 5.9 | 7.6 | 7.0 | 6.2 | 4.1 | 7.7 |
Source: Attachment table 12A.33 and tables 12A.35-36.
Effectiveness — Access indicators
Mental health service use by total population
Most recent data for this indicator are comparable, but not complete (chapter 12).
| NSW | Vic | Qld | WA | SA | Tas | ACT | NT | Aust | |
|---|---|---|---|---|---|---|---|---|---|
| Specialised public mental health | 1.8 | na | 1.9 | 2.1 | 2.3 | 1.3 | 2.4 | 2.9 | 1.9 |
| MBS and DVA subsidised service | 8.0 | 8.8 | 7.8 | 5.9 | 7.8 | 7.1 | 6.3 | 3.4 | 7.8 |
Source: Attachment tables 12A.41 and 12A.44.
Primary mental health care for children and young people
Most recent data for this measure are comparable and complete (chapter 12).
| NSW | Vic | Qld | WA | SA | Tas | ACT | NT | Aust | |
|---|---|---|---|---|---|---|---|---|---|
| % | 6.1 | 6.9 | 6.1 | 4.7 | 6.3 | 6.2 | 5.6 | 2.2 | 6.1 |
Effectiveness — Appropriateness indicators
Services reviewed against the National Standards
Most recent data for this indicator are complete, but not comparable (chapter 12).
| NSW | Vic | Qld | WA | SA | Tas | ACT | NT | Aust | |
|---|---|---|---|---|---|---|---|---|---|
| % | 82.6 | 78.3 | 99.7 | 85.8 | 42.1 | 9.2 | 100.0 | – | 80.0 |
Source: Attachment tables 12A.47-49.
Services provided in the appropriate setting
Most recent data for this measure are comparable and complete (chapter 12).
| NSW | Vic | Qld | WA | SA | Tas | ACT | NT | Aust | |
|---|---|---|---|---|---|---|---|---|---|
| % | 41.6 | 64.1 | 55.3 | 52.9 | 61.5 | 58.8 | 73.3 | 61.6 | 53.4 |
Collection of information on consumers outcomes
Most recent data for this measure are comparable, but not complete (chapter 12).
| NSW | Vic | Qld | WA | SA | Tas | ACT | NT | Aust | |
|---|---|---|---|---|---|---|---|---|---|
| % | 19.4 | na | 41.2 | 31.4 | 37.6 | 26.8 | 8.7 | 19.6 | 28.3 |
Source: Attachment tables 12A.47-49.
Effectiveness — Quality — Safety indicators
Rate of seclusion — acute inpatient units
Most recent data for this indicator are comparable and complete (chapter 12).
| NSW | Vic | Qld | WA | SA | Tas | ACT | NT | Aust | |
|---|---|---|---|---|---|---|---|---|---|
| No. | 7.4 | 9.2 | 11.1 | 5.0 | 4.5 | 15.2 | 1.1 | 21.6 | 8.0 |
Effectiveness — Quality — Responsiveness indicators
Consumer and carer involvement in decision making
Most recent data for this measure are comparable and complete (chapter 12).
| NSW | Vic | Qld | WA | SA | Tas | ACT | NT | Aust | |
|---|---|---|---|---|---|---|---|---|---|
| No. | 2.3 | 3.2 | 2.8 | 1.3 | 6.3 | – | – | 0.7 | 2.7 |
Source: Attachment table 12A.52.
Effectiveness — Quality — Continuity indicators
Post discharge community care
Most recent data for this indicator are not comparable nor complete (chapter 12).
| NSW | Vic | Qld | WA | SA | Tas | ACT | NT | Aust | |
|---|---|---|---|---|---|---|---|---|---|
| % | 59.5 | na | 72.8 | 53.3 | 54.0 | 20.8 | 73.9 | 46.6 | 60.7 |
Source: Attachment tables 12A.53 and 12A.56.
Readmissions to hospital within 28 days of discharge
Most recent data for this indicator are complete, but not comparable (chapter 12).
| NSW | Vic | Qld | WA | SA | Tas | ACT | NT | Aust | |
|---|---|---|---|---|---|---|---|---|---|
| % | 14.7 | 14.7 | 14.3 | 13.4 | 7.7 | 12.7 | 14.4 | 10.7 | 13.9 |
Efficiency indicators
Cost of inpatient care
Most recent data for this indicator are comparable and complete (chapter 12).
Cost per inpatient bed day, 2012-13
| NSW | Vic | Qld | WA | SA | Tas | ACT | NT | Aust | |
|---|---|---|---|---|---|---|---|---|---|
| $ per bed day | 1013.22 | 843.83 | 921.38 | 1238.68 | 899.55 | 895.20 | 868.26 | 1376.80 | 981.17 |
| NSW | Vic | Qld | WA | SA | Tas | ACT | NT | Aust | |
|---|---|---|---|---|---|---|---|---|---|
| $ per bed day | 1013.25 | 843.60 | 940.69 | 1204.42 | 864.21 | 1123.84 | 843.75 | 1376.80 | 975.73 |
Cost of community based residential care
Most recent data for this indicator are comparable and complete (chapter 12).
| NSW | Vic | Qld | WA | SA | Tas | ACT | NT | Aust | |
|---|---|---|---|---|---|---|---|---|---|
| $ per patient day | 183.97 | 514.54 | .. | 408.18 | 456.02 | 641.44 | 671.96 | 353.46 | 468.79 |
Source: Attachment tables 12A.59, 12A.61-63.
Cost of ambulatory care
Most recent data for this indicator are not comparable nor complete (chapter 12).
| NSW | Vic | Qld | WA | SA | Tas | ACT | NT | Aust | |
|---|---|---|---|---|---|---|---|---|---|
| $ per episode | 223.84 | na | 362.05 | 428.58 | 332.35 | 665.90 | 234.40 | 439.27 | 303.28 |
Source: Attachment tables 12A.59, 12A.61-63.
Outcome indicators
Rates of licit and illicit drug use
Most recent data for this indicator are comparable and complete (chapter 12).
| NSW | Vic | Qld | WA | SA | Tas | ACT | NT | Aust | |
|---|---|---|---|---|---|---|---|---|---|
| % | 11.4 | 11.0 | 12.6 | 13.7 | 12.5 | 13.3 | 12.4 | 19.0 | 12.0 |
Prevalence of mental illness
Most recent data for this indicator are comparable and complete (chapter 12).
| NSW | Vic | Qld | WA | SA | Tas | ACT | NT | Aust | |
|---|---|---|---|---|---|---|---|---|---|
| % | 20.1 ±2.2 | 20.7 ±2.3 | 19.2 ±2.6 | 21.4 ±4.1 | 19.1 ±3.4 | 14.1 ±5.4 | np | np | 20.0 ±1.1 |
Source: Attachment tables 12A.66, 12A.75, 12A.81, 12A.85, 12A.87 and 12A.94.
Mortality due to suicide
Most recent data for this indicator are comparable and complete (chapter 12).
| NSW | Vic | Qld | WA | SA | Tas | ACT | NT | Aust | |
|---|---|---|---|---|---|---|---|---|---|
| 8.9 | 9.7 | 13.0 | 13.5 | 11.8 | 14.1 | 9.1 | 18.1 | 10.8 |
Physical health outcomes of people with mental illness
Most recent data for this indicator are comparable and complete (chapter 12).
| NSW | Vic | Qld | WA | SA | Tas | ACT | NT | Aust | |
|---|---|---|---|---|---|---|---|---|---|
| People with mental illness | 23.6 ±4.5 | 28.9 ±6.4 | 25.7 ±4.6 | 26.0 ±5.8 | 26.7 ±4.9 | 32.4 ±5.7 | 20.0 ±5.6 | 29.1 ±10.1 | 26.1 ±2.4 |
| People without mental illness | 13.4 ±1.5 | 14.7 ±1.7 | 15.8 ±2.1 | 15.0 ±1.9 | 15.5 ±2.1 | 21.5 ±2.3 | 11.7 ±2.7 | 21.8 ±3.0 | 14.7 ±0.8 |
Social and economic inclusion of people with mental illness
Most recent data for this indicator are comparable and complete (chapter 12).
| NSW | Vic | Qld | WA | SA | Tas | ACT | NT | Aust | |
|---|---|---|---|---|---|---|---|---|---|
| % | 65.2 ±7.7 | 59.4 ±6.4 | 57.7 ±6.7 | 65.0 ±5.9 | 61.2 ±7.2 | 51.6 ±8.7 | 72.5 ±8.2 | 63.2 ±10.3 | 61.7 ±3.1 |
Mental health outcomes of consumers of specialised public mental health services
Most recent data for this indicator are not comparable nor complete (chapter 12).
| NSW | Vic | Qld | WA | SA | Tas | ACT | NT | Aust | |
|---|---|---|---|---|---|---|---|---|---|
| % | 70.0 | na | 72.7 | 74.3 | 72.6 | 76.4 | np | 77.3 | 72.1 |
Source: Attachment tables 12A.66, 12A.75, 12A.81, 12A.85, 12A.87 and 12A.94.
Some results reported here include 95 per cent confidence intervals (for example, 80 per cent ± 2.7 per cent).