Report on Government Services 2015
Chapter 18, Volume G
Homelessness services
The Homelessness services chapter (chapter 18) of the Report on Government Services reports on the performance of governments in providing specialist homelessness services, and the people accessing these services.
The National Affordable Housing Agreement (NAHA) and the National Partnership Agreement on Homelessness (NPAH) provide the framework for Australian Government and State and Territory governments to work together to reduce homelessness and improve housing outcomes for Australians.
Data reported in this edition are sourced from the Specialist Homelessness Services data collection (SHSC).
Download the chapter
- Chapter 18 Homelessness services, attachment tables, and data quality information (PDF - 1790 Kb)
- Chapter 18 Attachment tables (XLSX - 2697 Kb)
- Key Facts
- Indicator Framework
- Indicator Results
Nationally, in 2013-14, homelessness services agencies provided support to an estimated 254 001 people. In 2013-14, homelessness services agencies provided a range of services to clients, including accommodation (34.4 per cent), assistance to sustain housing (26.9 per cent), domestic violence services (22.9 per cent), and other specialist services (13.7 per cent).
The overall aim of specialist homelessness services is to provide crisis and transitional supported accommodation and a range of related support services. Specialist homelessness agencies provide services to people who are homeless, or at risk of homelessness aimed at preventing them from becoming homeless, and to achieve the maximum possible degree of self reliance and independence.
Within this aim, the goals are to:
- resolve crises
- re-establish family links where appropriate
- re-establish the capacity of clients to live independently, achieve sustainable housing and social inclusion
- provide homelessness services in an equitable and efficient manner.
The performance indicator framework provides information on equity, efficiency and effectiveness, and distinguishes the outputs and outcomes of homelessness services. The performance indicator framework shows which data are complete and comparable in the 2015 Report.
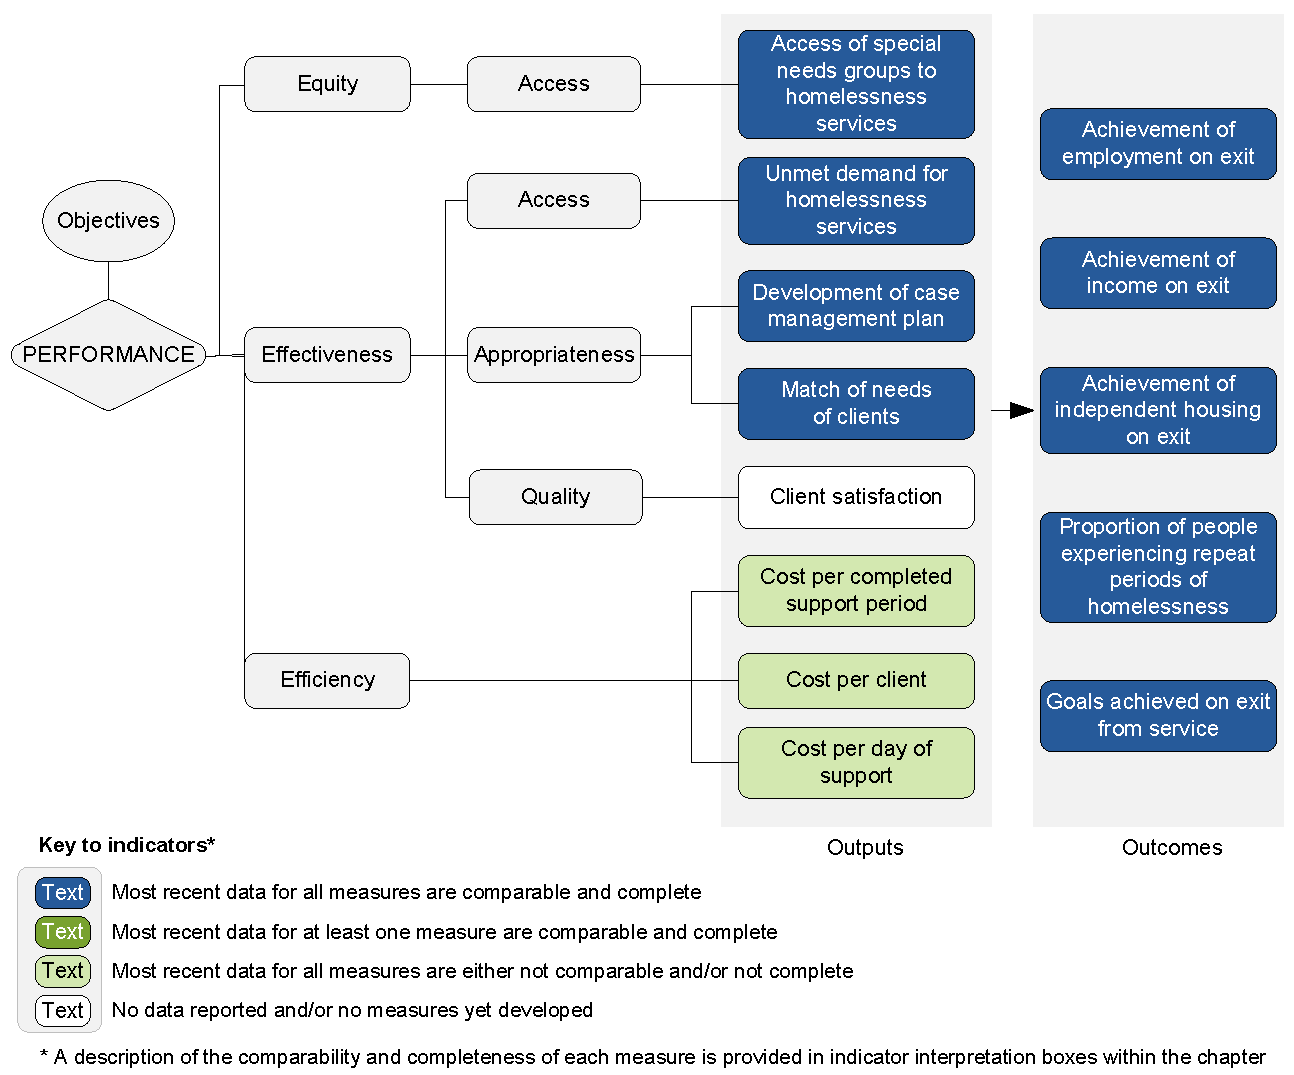
An overview of the Homelessness services performance indicator results are presented. Information to assist the interpretation of these data can be found in the indicator interpretation boxes in the Homelessness services chapter and attachment tables.
Equity — Access indicators
Access of special needs groups to homelessness services
Data for this indicator are comparable, subject to caveats.
Aboriginal and Torres Strait Islander people, and their representation in the population
| NSW | Vic | Qld | WA | SA | Tas | ACT | NT | Aust | |
|---|---|---|---|---|---|---|---|---|---|
| 2013-14 % | 24.0 | 11.3 | 32.6 | 43.4 | 27.9 | 15.1 | 18.2 | 74.8 | 26.3 |
| 2012-13 % | 23.2 | 11.0 | 31.6 | 39.8 | 24.3 | 14.9 | 16.1 | 69.5 | 25.3 |
| 2011-12 % | 23.6 | 10.1 | 30.4 | 40.4 | na | 14.9 | 16.1 | 71.8 | 25.1 |
Source: Attachment tables 18A.5-8.
| NSW | Vic | Qld | WA | SA | Tas | ACT | NT | Aust | |
|---|---|---|---|---|---|---|---|---|---|
| 2013-14 % | 20.4 | 5.2 | 26.1 | 23.5 | 20.3 | 12.0 | 11.6 | 67.1 | 14.1 |
| 2012-13 % | 19.4 | 5.4 | 25.1 | 22.4 | 18.4 | 13.4 | 10.2 | 68.1 | 14.1 |
| 2011-12 % | 18.6 | 4.7 | 22.6 | 22.2 | na | 14.3 | 9.9 | 59.0 | 12.7 |
Source: Attachment tables 18A.5-8.
| NSW | Vic | Qld | WA | SA | Tas | ACT | NT | Aust | |
|---|---|---|---|---|---|---|---|---|---|
| % | 2.9 | 0.9 | 4.3 | 3.7 | 2.3 | 4.9 | 1.7 | 29.7 | 3.0 |
People born in non-main English-speaking countries, and their representation in the population
| NSW | Vic | Qld | WA | SA | Tas | ACT | NT | Aust | |
|---|---|---|---|---|---|---|---|---|---|
| 2013-14 % | 11.7 | 15.4 | 8.0 | 9.9 | 6.2 | 3.9 | 17.0 | 3.3 | 11.0 |
| 2012-13 % | 11.4 | 14.4 | 7.6 | 10.3 | 6.5 | 3.5 | 16.8 | 3.6 | 10.6 |
| 2011-12 % | 11.0 | 12.8 | 6.7 | 10.6 | na | 4.0 | 14.4 | 4.1 | 9.7 |
Source: Attachment tables 18A.5-8.
| NSW | Vic | Qld | WA | SA | Tas | ACT | NT | Aust | |
|---|---|---|---|---|---|---|---|---|---|
| 2013-14 % | 8.9 | 13.2 | 7.5 | 12.3 | 6.0 | 4.8 | 16.1 | 2.0 | 10.6 |
| 2012-13 % | 7.8 | 13.1 | 7.2 | 13.8 | 5.5 | 3.5 | 16.2 | 1.8 | 10.3 |
| 2011-12 % | 8.5 | 10.5 | 5.6 | 12.2 | na | 4.0 | 14.3 | 2.5 | 9.4 |
Source: Attachment tables 18A.5-8.
| NSW | Vic | Qld | WA | SA | Tas | ACT | NT | Aust | |
|---|---|---|---|---|---|---|---|---|---|
| % | 24.6 | 25.4 | 19.8 | 29.2 | 21.5 | 11.3 | 23.5 | 15.2 | 23.7 |
People with disability, and their representation in the population
| NSW | Vic | Qld | WA | SA | Tas | ACT | NT | Aust | |
|---|---|---|---|---|---|---|---|---|---|
| % | 3.1 | 4.9 | 2.9 | 3.1 | 1.9 | 3.8 | 2.8 | 2.2 | 3.4 |
| NSW | Vic | Qld | WA | SA | Tas | ACT | NT | Aust | |
|---|---|---|---|---|---|---|---|---|---|
| % | 2.1 | 2.6 | 2.6 | 2.3 | 1.2 | 4.7 | 2.1 | 3.3 | 2.4 |
| NSW | Vic | Qld | WA | SA | Tas | ACT | NT | Aust | |
|---|---|---|---|---|---|---|---|---|---|
| % | 6.4 | 6.4 | 5.5 | 4.9 | 6.9 | 7.7 | 5.2 | 3.8 | 6.1 |
Effectiveness indicators
Development of case management plan
Data for this indicator are comparable, subject to caveats.
| NSW | Vic | Qld | WA | SA | Tas | ACT | NT | Aust | |
|---|---|---|---|---|---|---|---|---|---|
| 2013-14 % | 58.5 | 38.2 | 72.7 | 48.2 | 30.6 | 48.4 | 50.1 | 72.4 | 48.2 |
| 2012-13 % | 56.6 | 33.4 | 69.7 | 50.2 | 36.4 | 56.9 | 45.6 | 63.5 | 45.7 |
| 2011-12 % | 55.1 | 31.5 | 61.3 | 58.4 | 34.0 | 54.2 | 43.0 | 60.5 | 44.1 |
Match of needs of clients
Data for this indicator are comparable, subject to caveats.
| NSW | Vic | Qld | WA | SA | Tas | ACT | NT | Aust | |
|---|---|---|---|---|---|---|---|---|---|
| 2013-14 % | 64.0 | 45.4 | 59.7 | 72.9 | 89.3 | 49.6 | 46.1 | 89.2 | 58.7 |
| 2012-13 % | 63.0 | 44.5 | 63.0 | 73.2 | 95.9 | 67.0 | 43.6 | 89.5 | 59.7 |
| 2011-12 % | 64.4 | 42.7 | 60.0 | 73.6 | na | 61.0 | 43.8 | 86.1 | 57.7 |
Source: Attachment tables 18A.11 and 18A.14.
Efficiency indicators
Cost per completed support period
Data for this indicator not complete or not directly comparable.
| NSW | Vic | Qld | WA | SA | Tas | ACT | NT | Aust | |
|---|---|---|---|---|---|---|---|---|---|
| 2013-14 $ | 2255 | 1120 | 2010 | 2550 | 1767 | 2903 | 3682 | 1080 | 1683 |
| 2012-13 $ | 2248 | 1131 | 1815 | 2535 | 1974 | 2786 | 3863 | 887 | 1674 |
| 2011-12 $ | 2246 | 1178 | 1800 | 2588 | 2280 | 2353 | 3969 | 1532 | 1743 |
Cost per client
Data for this indicator not complete or not directly comparable.
| NSW | Vic | Qld | WA | SA | Tas | ACT | NT | Aust | |
|---|---|---|---|---|---|---|---|---|---|
| 2013-14 $ | 2674 | 1910 | 2422 | 3205 | 2696 | 3796 | 4147 | 1339 | 2437 |
| 2012-13 $ | 2610 | 1976 | 2194 | 3186 | 2669 | 3303 | 4432 | 1112 | 2407 |
| 2011-12 $ | 2589 | 2042 | 2189 | 3225 | 2866 | 2823 | 4111 | 1756 | 2453 |
Cost per day of support
Data for this indicator not complete or not directly comparable.
| NSW | Vic | Qld | WA | SA | Tas | ACT | NT | Aust | |
|---|---|---|---|---|---|---|---|---|---|
| 2013-14 $ | 27 | 28 | 38 | 39 | 28 | 50 | 28 | 16 | 30 |
| 2012-13 $ | 24 | 29 | 35 | 36 | 25 | 40 | 29 | 30 | 29 |
Outcome indicators
Achievement of employment on exit
Data for this indicator are comparable, subject to caveats.
| NSW | Vic | Qld | WA | SA | Tas | ACT | NT | Aust | |
|---|---|---|---|---|---|---|---|---|---|
| 2013-14 % | 20.8 | 14.5 | 15.5 | 15.8 | 20.2 | 9.7 | 23.5 | 15.0 | 17.7 |
| 2012-13 % | 21.9 | 14.8 | 16.5 | 16.2 | 15.7 | 14.9 | 26.0 | 24.8 | 18.8 |
| 2011-12 % | 23.7 | 15.4 | 15.7 | 22.4 | na | 13.4 | 20.6 | 28.0 | 20.1 |
Source: Attachment table 18A.21.
Achievement of income on exit
Data for this indicator are comparable, subject to caveats.
| NSW | Vic | Qld | WA | SA | Tas | ACT | NT | Aust | |
|---|---|---|---|---|---|---|---|---|---|
| 2013-14 % | 92.6 | 94.3 | 94.4 | 93.9 | 87.5 | 95.4 | 95.6 | 95.6 | 93.6 |
| 2012-13 % | 93.4 | 94.0 | 94.5 | 96.0 | 85.4 | 91.6 | 97.2 | 95.5 | 93.9 |
| 2011-12 % | 94.5 | 95.0 | 94.7 | 93.4 | na | 92.4 | 96.5 | 95.1 | 94.5 |
Source: Attachment table 18A.24.
Achievement of independent housing on exit
Data for this indicator are comparable, subject to caveats.
| NSW | Vic | Qld | WA | SA | Tas | ACT | NT | Aust | |
|---|---|---|---|---|---|---|---|---|---|
| 2013-14 % | 64.8 | 61.7 | 61.7 | 62.3 | 67.2 | 62.2 | 62.6 | 56.4 | 63.0 |
| 2012-13 % | 63.8 | 61.3 | 59.3 | 64.0 | 64.5 | 53.6 | 47.9 | 45.2 | 61.2 |
| 2011-12 % | 57.5 | 59.2 | 54.3 | 66.5 | na | 52.1 | 52.4 | 48.3 | 58.0 |
Source: Attachment table 18A.26.
Proportion of people experiencing repeat periods of homelessness
Data for this indicator are comparable, subject to caveats.
| NSW | Vic | Qld | WA | SA | Tas | ACT | NT | Aust | |
|---|---|---|---|---|---|---|---|---|---|
| 2013-14 % | 6.1 | 4.5 | 5.0 | 5.2 | 8.7 | 4.8 | 6.5 | 5.0 | 5.0 |
| 2012-13 % | 5.7 | 4.0 | 4.7 | 5.1 | 3.7 | 4.5 | 7.4 | 4.8 | 4.3 |
| 2011-12 % | 6.4 | 4.8 | 5.5 | 4.9 | 2.6 | 5.2 | 12.5 | 6.2 | 5.1 |
Goals achieved on exit from service
Data for this indicator are comparable, subject to caveats.
| NSW | Vic | Qld | WA | SA | Tas | ACT | NT | Aust | |
|---|---|---|---|---|---|---|---|---|---|
| 2013-14 % | 64.3 | 73.3 | 77.4 | 57.4 | na | 56.6 | 67.6 | 63.9 | 72.0 |
| 2012-13 % | 61.2 | 70.1 | 72.0 | 53.3 | 90.3 | 56.7 | 62.6 | 56.8 | 68.0 |
| 2011-12 % | 61.9 | 68.3 | 57.9 | 53.4 | 60.5 | 51.8 | 58.7 | 49.2 | 61.5 |
Source: Attachment table 18A.33.