Report on Government Services 2015
Chapter 17, Volume G
Housing
The Housing chapter (chapter 17) of the Report on Government Services focuses on the performance of governments in providing social housing, including public housing, State owned and managed Indigenous housing (SOMIH), community housing and Indigenous community housing.
The National Affordable Housing Agreement (NAHA) is the overarching agreement between Australian, State and Territory governments for providing assistance to improve housing outcomes for Australian people.
Download the chapter
- Chapter 17 Housing, attachment tables, and data quality information (PDF - 2459 Kb)
- Chapter 17 Attachment tables (XLSX - 3892 Kb)
- Key Facts
- Indicator Framework
- Indicator Results
Nationally at 30 June 2014, there were 317 008 households in public housing and 323 803 public housing dwellings and 9790 households in State owned and managed Indigenous housing (SOMIH) and 10 113 SOMIH dwellings. A further 67 046 households were assisted with community housing and there were 71 036 community housing tenancy rental units in Australia.
There were 15 394 permanent dwellings managed by funded Indigenous community housing organisations at 30 June 2013.
Social housing, through the delivery of affordable, appropriate, flexible and diverse social housing, aims to assist people unable to access alternative suitable housing options. Some forms of social housing aim specifically to contribute to Aboriginal and Torres Strait Islander community wellbeing by improving housing outcomes, especially for Aboriginal and Torres Strait Islander people living in remote communities.
The performance indicator framework provides information on equity, efficiency and effectiveness, and distinguishes the outputs and outcomes of social housing. The performance indicator framework shows which data are complete and comparable in the 2015 Report.
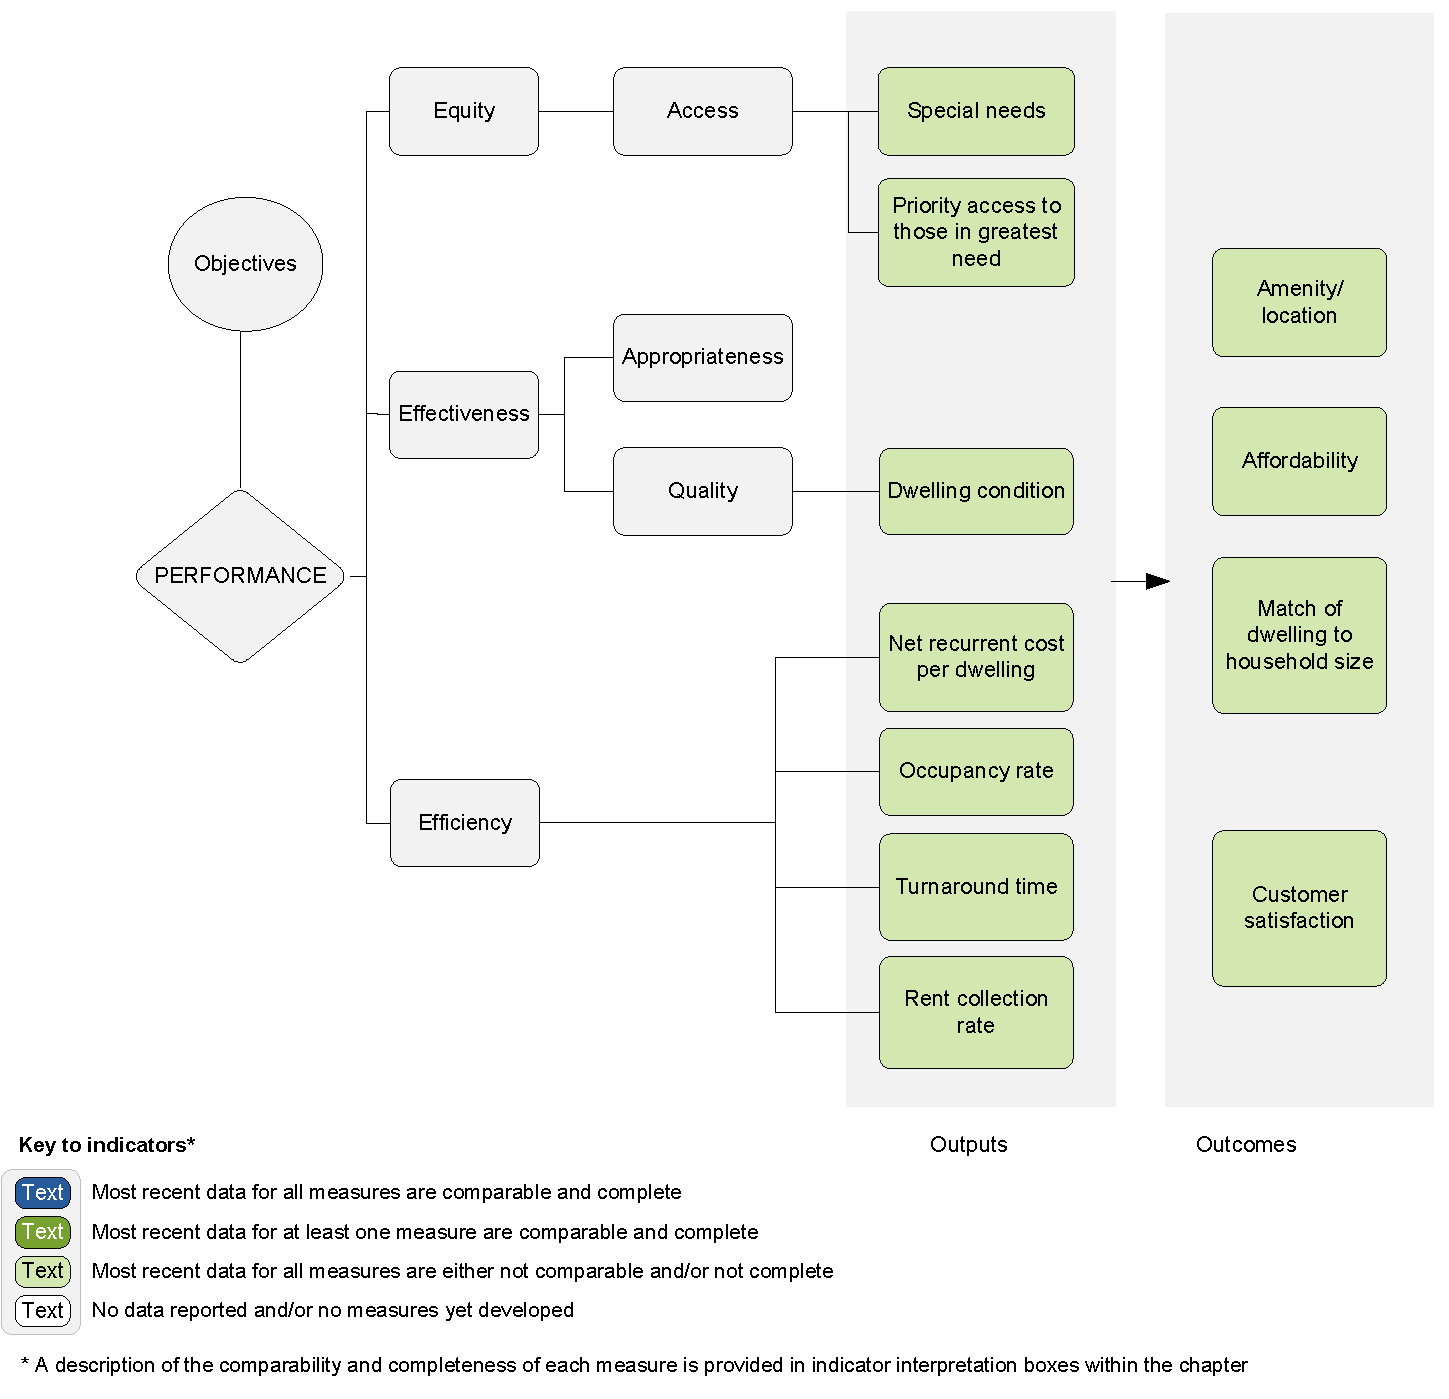
An overview of the Social housing performance indicator results are presented. Information to assist the interpretation of these data can be found in the indicator interpretation boxes in the Housing chapter and attachment tables.
Equity — Access indicators
Special needs
Data comparability and completeness vary for this indicator (chapter 17).
Public housing
| NSW | Vic | Qld | WA | SA | Tas | ACT | NT | Aust | |
|---|---|---|---|---|---|---|---|---|---|
| % | 68.9 | 58.4 | 66.6 | 63.6 | 70.2 | 65.3 | 57.6 | 71.8 | 65.4 |
State owned and managed Indigenous housing
| NSW | Vic | Qld | WA | SA | Tas | ACT | NT | Aust | |
|---|---|---|---|---|---|---|---|---|---|
| % | 58.0 | .. | 50.0 | .. | 53.2 | 77.8 | .. | .. | 55.6 |
Source: Attachment tables 17A.9-11
Community housing
| NSW | Vic | Qld | WA | SA | Tas | ACT | NT | Aust | |
|---|---|---|---|---|---|---|---|---|---|
| % | 61.6 | 49.8 | 67.0 | 50.9 | 55.6 | 72.3 | 48.2 | na | 58.7 |
Source: Attachment tables 17A.9-11
Priority access to those in greatest need
Data comparability and completeness vary for this indicator (chapter 17).
Public housing
| NSW | Vic | Qld | WA | SA | Tas | ACT | NT | Aust | |
|---|---|---|---|---|---|---|---|---|---|
| % | 55.5 | 79.4 | 96.5 | 58.0 | 86.5 | 85.3 | 96.9 | 67.7 | 74.1 |
State owned and managed Indigenous housing
| NSW | Vic | Qld | WA | SA | Tas | ACT | NT | Aust | |
|---|---|---|---|---|---|---|---|---|---|
| % | 21.8 | .. | 98.1 | .. | 93.6 | na | .. | .. | 56.3 |
Source: Attachment tables 17A.12-14
Community housing
| NSW | Vic | Qld | WA | SA | Tas | ACT | NT | Aust | |
|---|---|---|---|---|---|---|---|---|---|
| % | 70.2 | 86.9 | 95.9 | 84.1 | 76.6 | 29.2 | 97.0 | na | 75.1 |
Effectiveness indicators
Dwelling condition
Data for this indicator are not directly comparable (chapter 17).
Public housing
| NSW | Vic | Qld | WA | SA | Tas | ACT | NT | Aust | |
|---|---|---|---|---|---|---|---|---|---|
| % | 75.9 ±1.3 | 83.1 ±3.2 | 88.3 ±2.8 | 81.9 ±2.9 | 84.0 ±3.0 | 80.6 ±3.6 | 75.7 ±3.8 | 81.7 ±3.6 | 81.0 ±1.0 |
| Relative standard error % | 0.9 | 2.0 | 1.6 | 1.8 | 1.8 | 2.3 | 2.6 | 2.2 | 0.7 |
State owned and managed Indigenous housing
| NSW | Vic | Qld | WA | SA | Tas | ACT | NT | Aust | |
|---|---|---|---|---|---|---|---|---|---|
| % | 65.5 ±4.2 | .. | 80.3 ±3.5 | .. | 61.4 ±5.7 | 75.6 ±9.1 | .. | .. | 70.1 ±2.5 |
| Relative standard error % | 3.3 | .. | 2.2 | .. | 4.9 | 6.4 | .. | .. | 1.8 |
Source: Attachment tables 17A.15-17.
Community housing
| NSW | Vic | Qld | WA | SA | Tas | ACT | NT | Aust | |
|---|---|---|---|---|---|---|---|---|---|
| % | 87.9 ±2.1 | 87.7 ±3.5 | 93.8 ±2.5 | 94.4 ±2.5 | 86.4 ±3.7 | 80.5 ±4.7 | 87.6 ±5.9 | na | 89.3 ±1.2 |
| Relative standard error % | 1.2 | 2.0 | 1.4 | 1.3 | 2.2 | 3.0 | 3.4 | na | 0.7 |
Source: Attachment tables 17A.15-17.
Efficiency indicators
Net recurrent cost per dwelling
Data comparability and completeness vary for this indicator (chapter 17).
Public housing
| NSW | Vic | Qld | WA | SA | Tas | ACT | NT | Aust | |
|---|---|---|---|---|---|---|---|---|---|
| $ | 7995 | 5639 | 7116 | 11 523 | 8945 | 10 644 | 9231 | 16 054 | 8101 |
State owned and managed Indigenous housing
| NSW | Vic | Qld | WA | SA | Tas | ACT | NT | Aust | |
|---|---|---|---|---|---|---|---|---|---|
| $ | 8750 | .. | 10 830 | .. | 11 760 | 8809 | .. | .. | 9988 |
Source: Attachment tables 17A.19-22.
Community housing
| NSW | Vic | Qld | WA | SA | Tas | ACT | NT | Aust | |
|---|---|---|---|---|---|---|---|---|---|
| $ | 10 681 | 8558 | 6270 | 6949 | 7282 | 14 757 | 6095 | na | 8841 |
Source: Attachment tables 17A.19-22.
Indigenous community housing
| NSW | Vic | Qld | WA | SA | Tas | ACT | NT | Aust | |
|---|---|---|---|---|---|---|---|---|---|
| $ | 7860 | 7689 | 6211 | 10 464 | na | 9895 | na | na | 7750 |
Source: Attachment tables 17A.19-22.
Occupancy rate
Data comparability and completeness vary for this indicator (chapter 17).
Public housing
| NSW | Vic | Qld | WA | SA | Tas | ACT | NT | Aust | |
|---|---|---|---|---|---|---|---|---|---|
| % | 98.7 | 97.8 | 98.4 | 96.6 | 96.4 | 98.1 | 98.9 | 93.2 | 97.9 |
State owned and managed Indigenous housing
| NSW | Vic | Qld | WA | SA | Tas | ACT | NT | Aust | |
|---|---|---|---|---|---|---|---|---|---|
| % | 97.2 | .. | 96.7 | .. | 95.9 | 97.2 | .. | .. | 96.8 |
Source: Attachment tables 17A.23-26.
Community housing
| NSW | Vic | Qld | WA | SA | Tas | ACT | NT | Aust | |
|---|---|---|---|---|---|---|---|---|---|
| % | 93.9 | 91.8 | 97.3 | 93.7 | 97.2 | 95.6 | 86.9 | 100.0 | 94.4 |
Indigenous community housing
| NSW | Vic | Qld | WA | SA | Tas | ACT | NT | Aust | |
|---|---|---|---|---|---|---|---|---|---|
| % | 96.9 | 97.9 | 90.8 | 87.5 | 74.8 | 91.9 | na | na | 91.0 |
Source: Attachment tables 17A.23-26.
Turnaround time
Data for this indicator are comparable and complete, subject to caveats (chapter 17).
Public housing
| NSW | Vic | Qld | WA | SA | Tas | ACT | NT | Aust | |
|---|---|---|---|---|---|---|---|---|---|
| Days | 29.9 | 32.9 | 25.3 | 19.2 | na | 33.6 | 37.3 | 74.0 | na |
Source: Attachment tables 17A.27-28.
State owned and managed Indigenous housing
| NSW | Vic | Qld | WA | SA | Tas | ACT | NT | Aust | |
|---|---|---|---|---|---|---|---|---|---|
| Days | 22.9 | .. | 40.8 | .. | na | 44.0 | .. | .. | na |
Source: Attachment tables 17A.27-28.
Rent collection rate
Data comparability and completeness vary for this indicator.
Public housing
| NSW | Vic | Qld | WA | SA | Tas | ACT | NT | Aust | |
|---|---|---|---|---|---|---|---|---|---|
| % | 99.6 | 98.8 | 100.0 | 102.7 | 99.7 | 98.0 | 99.6 | 99.4 | 99.7 |
State owned and managed Indigenous housing
| NSW | Vic | Qld | WA | SA | Tas | ACT | NT | Aust | |
|---|---|---|---|---|---|---|---|---|---|
| % | 99.2 | .. | 102.6 | .. | 98.9 | 98.0 | .. | .. | 100.1 |
Source: Attachment tables 17A.29-32.
Community housing
| NSW | Vic | Qld | WA | SA | Tas | ACT | NT | Aust | |
|---|---|---|---|---|---|---|---|---|---|
| % | 97.6 | 100.3 | 100.9 | 101.0 | 100.6 | 100.9 | 96.0 | na | 99.3 |
Source: Attachment tables 17A.29-32.
Indigenous community housing
| NSW | Vic | Qld | WA | SA | Tas | ACT | NT | Aust | |
|---|---|---|---|---|---|---|---|---|---|
| % | 91.6 | 99.8 | 92.1 | 88.1 | na | 105.0 | na | 73.6 | 92.7 |
Source: Attachment tables 17A.29-32.
Outcome indicators
Amenity/location
Data comparability and completeness vary for this indicator (chapter 17).
Public housing
| NSW | Vic | Qld | WA | SA | Tas | ACT | NT | Aust | |
|---|---|---|---|---|---|---|---|---|---|
| % | 81.7 | 82.5 | 87.2 | 86.7 | 87.7 | 85.6 | 81.0 | 83.1 | 84.1 |
State owned and managed Indigenous housing
| NSW | Vic | Qld | WA | SA | Tas | ACT | NT | Aust | |
|---|---|---|---|---|---|---|---|---|---|
| % | 76.3 | .. | 82.8 | .. | 80.0 | 81.6 | .. | .. | 79.2 |
Source: Attachment tables 17A.33-37.
Community housing
| NSW | Vic | Qld | WA | SA | Tas | ACT | NT | Aust | |
|---|---|---|---|---|---|---|---|---|---|
| % | 84.7 | 86.4 | 85.9 | 89.1 | 88.9 | 83.0 | 82.6 | na | 85.9 |
Source: Attachment tables 17A.33-37.
Public housing
| NSW | Vic | Qld | WA | SA | Tas | ACT | NT | Aust | |
|---|---|---|---|---|---|---|---|---|---|
| % | 87.6 | 86.3 | 89.7 | 88.6 | 88.3 | 88.2 | 88.7 | 86.8 | 87.8 |
State owned and managed Indigenous housing
| NSW | Vic | Qld | WA | SA | Tas | ACT | NT | Aust | |
|---|---|---|---|---|---|---|---|---|---|
| % | 87.7 | .. | 88.7 | .. | 88.3 | 93.0 | .. | .. | 88.3 |
Source: Attachment tables 17A.33-37.
Community housing
| NSW | Vic | Qld | WA | SA | Tas | ACT | NT | Aust | |
|---|---|---|---|---|---|---|---|---|---|
| % | 85.4 | 88.5 | 85.6 | 88.3 | 90.3 | 87.4 | 82.5 | na | 86.6 |
Source: Attachment tables 17A.33-37.
Affordability
Data comparability and completeness vary for this indicator (chapter 17).
Public housing
| NSW | Vic | Qld | WA | SA | Tas | ACT | NT | Aust | |
|---|---|---|---|---|---|---|---|---|---|
| % | 0.4 | 0.3 | 0.1 | 1.4 | – | 0.1 | 0.1 | 6.9 | 0.5 |
Source: Attachment table 17A.41.
State owned and managed Indigenous housing
| NSW | Vic | Qld | WA | SA | Tas | ACT | NT | Aust | |
|---|---|---|---|---|---|---|---|---|---|
| % | 0.5 | .. | 0.5 | .. | – | – | .. | .. | 0.4 |
Source: Attachment table 17A.41.
Community housing
| NSW | Vic | Qld | WA | SA | Tas | ACT | NT | Aust | |
|---|---|---|---|---|---|---|---|---|---|
| % | 10.4 | 4.9 | na | 10.4 | 3.7 | 23.0 | – | na | 9.0 |
Source: Attachment table 17A.41.
Match of dwelling to household size
Data comparability and completeness vary for this indicator (chapter 17).
Public housing
| NSW | Vic | Qld | WA | SA | Tas | ACT | NT | Aust | |
|---|---|---|---|---|---|---|---|---|---|
| % | 4.7 | 5.7 | 4.7 | 5.0 | 2.2 | 3.7 | 4.8 | 7.4 | 4.6 |
State owned and managed Indigenous housing
| NSW | Vic | Qld | WA | SA | Tas | ACT | NT | Aust | |
|---|---|---|---|---|---|---|---|---|---|
| % | 8.5 | .. | 13.6 | .. | 8.7 | 4.4 | .. | .. | 10.2 |
Source: Attachment table 17A.46-49.
Community housing
| NSW | Vic | Qld | WA | SA | Tas | ACT | NT | Aust | |
|---|---|---|---|---|---|---|---|---|---|
| % | 6.4 | 2.2 | na | 1.8 | 2.1 | 1.0 | 0.4 | na | 4.1 |
Source: Attachment table 17A.46-49.
Indigenous community housing
| NSW | Vic | Qld | WA | SA | Tas | ACT | NT | Aust | |
|---|---|---|---|---|---|---|---|---|---|
| % | na | 9.9 | 31.9 | 27.4 | na | na | na | na | na |
Source: Attachment table 17A.46-49.
Customer satisfaction
Public housing
| NSW | Vic | Qld | WA | SA | Tas | ACT | NT | Aust | |
|---|---|---|---|---|---|---|---|---|---|
| % | 64.8 ±1.5 | 75.5 ±3.6 | 83.3 ±3.2 | 73.0 ±3.4 | 75.7 ±3.4 | 73.2 ±3.9 | 75.7 ±3.8 | 71.6 ±4.0 | 72.7 ±1.2 |
| Relative standard error % | 1.2 | 2.4 | 1.9 | 2.4 | 2.3 | 2.8 | 2.6 | 2.9 | 0.8 |
State owned and managed Indigenous housing
| NSW | Vic | Qld | WA | SA | Tas | ACT | NT | Aust | |
|---|---|---|---|---|---|---|---|---|---|
| % | 49.1 ±4.4 | .. | 66.8 ±4.1 | .. | 66.2 ±5.5 | 62.2 ±10.5 | .. | .. | 58.3 ±2.7 |
| Relative standard error % | 4.6 | .. | 3.2 | .. | 4.3 | 8.6 | .. | .. | 2.4 |
Source: Attachment tables 17A.35 and 17A.54-55.
Community housing
| NSW | Vic | Qld | WA | SA | Tas | ACT | NT | Aust | |
|---|---|---|---|---|---|---|---|---|---|
| % | 78.5 ±2.5 | 76.6 ±4.4 | 83.2 ±3.9 | 83.0 ±3.9 | 82.6 ±4.0 | 75.7 ±5.0 | 69.4 ±8.2 | na | 79.7 ±1.6 |
| Relative standard error % | 1.6 | 2.9 | 2.4 | 2.4 | 2.5 | 3.3 | 6.0 | na | 1.0 |
Source: Attachment tables 17A.35 and 17A.54-55.
Some results reported here include 95 per cent confidence intervals (for example, 80 per cent ± 2.7 per cent).