Report on Government Services 2016
Chapter 12, Volume E
Mental health management
The Mental health management chapter (chapter 12) reports on the performance of governments in the management of mental health. Mental illness is a significant cause of morbidity and mortality in Australia and is identified by governments as a national health priority area.
Download the chapter
- Chapter 12 Mental health management, attachment tables, and data quality information (PDF - 4309 Kb)
- Chapter 12 Attachment tables (XLSX - 2558 Kb)
- Key Facts
- Indicator Framework
- Indicator Results
- Indigenous Data
This chapter reports on the performance of governments in the management of mental health. Mental illness is a significant cause of morbidity and mortality in Australia and is identified by governments as a national health priority area.
- Governments provide or fund a range of mental health management services. The key services are Medicare Benefits Schedule (MBS) subsidised mental health services; admitted patient care in hospitals; and community-based services that provide ambulatory care, residential care and support services for people with a mental illness living in the community.
- Real government recurrent expenditure of around $7.7 billion was allocated to mental health services in 2013-14. State and Territory governments made the largest contribution ($4.8 billion, or 62.4 per cent), although this included some Australian Government funds under the National Health Reform Agreement. The Australian Government spent $2.9 billion or 37.6 per cent.
- In 2013-14, 1.8 per cent and 8.4 per cent of the total population received State and Territory governments' specialised mental health services and MBS subsidised mental health services, respectively.
The key objectives of National Mental Health Policy are to:
- promote the mental health and wellbeing of the Australian community and, where possible, prevent the development of mental health problems and mental illness
- reduce the impact of mental health problems and mental illness, including the effects of stigma on individuals, families and the community
- promote recovery from mental health problems and mental illness
- assure the rights of people with mental health problems and mental illness, and enable them to participate meaningfully in society.
The performance indicator framework provides information on equity, efficiency and effectiveness, and distinguishes the outputs and outcomes of mental health management. The performance indicator framework shows which data are complete and comparable in the 2016 Report.
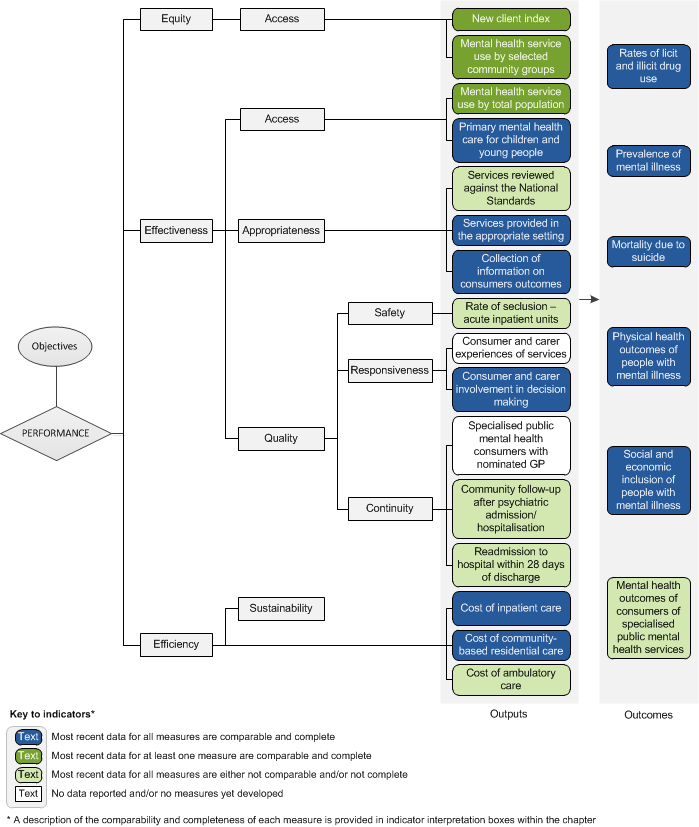
An overview of the Mental health management performance indicator results are presented. Information to assist the interpretation of these data can be found in the indicator interpretation boxes in the Mental health management chapter and attachment tables.
Equity — Access indicators
New client index
Proportion of total clients of State and Territory specialised public mental health services who are new, 2013-14
| NSW | Vic | Qld | WA | SA | Tas | ACT | NT | Aust | |
|---|---|---|---|---|---|---|---|---|---|
| % | 40.6 | 36.8 | 45.4 | 42.9 | 42.8 | 45.2 | 40.2 | 46.1 | 41.7 |
Proportion of total clients of MBS subsidised mental health services who are new, 2014-15
| NSW | Vic | Qld | WA | SA | Tas | ACT | NT | Aust | |
|---|---|---|---|---|---|---|---|---|---|
| % | 34.1 | 32.5 | 35.9 | 38.3 | 33.2 | 36.4 | 37.3 | 49.0 | 34.5 |
Mental health service use by selected community groups
Proportion of the Aboriginal and Torres Strait Islander population using State and Territory specialised public mental health services, compared with the proportion for non-Indigenous population, 2013-14
| NSW | Vic | Qld | WA | SA | Tas | ACT | NT | Aust | |
|---|---|---|---|---|---|---|---|---|---|
| Aboriginal and Torres Strait Islander | 5.4 | 2.9 | 4.5 | 5.6 | 6.0 | 2.0 | 8.1 | 4.2 | 4.8 |
| Non-Indigenous | 1.5 | 1.1 | 1.8 | 1.9 | 1.9 | 1.6 | 2.4 | 2.3 | 1.6 |
Proportion of the Aboriginal and Torres Strait Islander population using MBS subsidised mental health services, compared with the proportion for non-Indigenous population, 2013-14
| NSW | Vic | Qld | WA | SA | Tas | ACT | NT | Aust | |
|---|---|---|---|---|---|---|---|---|---|
| Aboriginal and Torres Strait Islander | 12.0 | 13.5 | 8.1 | 5.1 | 9.2 | 9.9 | 11.8 | 1.6 | 8.7 |
| Non-Indigenous | 8.4 | 9.4 | 8.4 | 6.4 | 8.2 | 7.7 | 6.7 | 4.3 | 8.3 |
Effectiveness — Access indicators
Mental health service use by total population
Proportion of the population using a State and Territory governments' specialised public mental health service, 2013-14
| NSW | Vic | Qld | WA | SA | Tas | ACT | NT | Aust | |
|---|---|---|---|---|---|---|---|---|---|
| % | 1.8 | 1.1 | 2.0 | 2.1 | 2.3 | 1.7 | 2.6 | 2.8 | 1.8 |
Proportion of the population using a MBS subsidised service, 2013-14
| NSW | Vic | Qld | WA | SA | Tas | ACT | NT | Aust | |
|---|---|---|---|---|---|---|---|---|---|
| % | 8.6 | 9.4 | 8.6 | 6.4 | 8.3 | 7.8 | 6.9 | 3.5 | 8.4 |
Primary mental health care for children and young people
Proportion of young people aged under 25 years who had contact with primary mental health care services subsidised through the MBS, 2014-15
| NSW | Vic | Qld | WA | SA | Tas | ACT | NT | Aust | |
|---|---|---|---|---|---|---|---|---|---|
| % | 6.6 | 7.4 | 6.8 | 5.2 | 7.0 | 6.8 | 6.2 | 2.5 | 6.7 |
Effectiveness — Appropriateness indicators
Services reviewed against the National Standards
Proportion of expenditure on specialised public mental health services that had completed an external review against national standards and were assessed as meeting 'all Standards' (level 1), June 2014
| NSW | Vic | Qld | WA | SA | Tas | ACT | NT | Aust | |
|---|---|---|---|---|---|---|---|---|---|
| % | 71.9 | 67.9 | 81.8 | 81.7 | – | – | 100.0 | 100.0 | 67.3 |
Services provided in the appropriate setting
Proportion of State and Territory governments' recurrent expenditure on specialised public mental health services that was on community-based services, 2013-14
| NSW | Vic | Qld | WA | SA | Tas | ACT | NT | Aust | |
|---|---|---|---|---|---|---|---|---|---|
| % | 41.3 | 64.7 | 55.2 | 53.1 | 59.6 | 59.7 | 73.0 | 63.7 | 53.3 |
Collection of information on consumers outcomes
Proportion of episodes with completed consumer outcomes measures collected for people in specialised public mental health services — ongoing ambulatory care, 2013-14
| NSW | Vic | Qld | WA | SA | Tas | ACT | NT | Aust | |
|---|---|---|---|---|---|---|---|---|---|
| % | 19.8 | 37.2 | 23.6 | 27.3 | 39.5 | 25.0 | 6.9 | 11.1 | 27.2 |
Effectiveness — Quality — Safety indicators
Rate of seclusion — acute inpatient units
Number of seclusion events per 1000 bed days in specialised public mental health acute inpatient units, 2014-15
| NSW | Vic | Qld | WA | SA | Tas | ACT | NT | Aust | |
|---|---|---|---|---|---|---|---|---|---|
| No. | 7.7 | 7.5 | 11.4 | 4.3 | 5.0 | 10.1 | 2.7 | 31.0 | 7.8 |
Effectiveness — Quality — Responsiveness indicators
Consumer and carer involvement in decision making
Number of paid FTE consumer workers per 1000 FTE paid direct care staff, 2013-14
| NSW | Vic | Qld | WA | SA | Tas | ACT | NT | Aust | |
|---|---|---|---|---|---|---|---|---|---|
| No. | 3.2 | 2.6 | 1.8 | 1.5 | 6.1 | 0.8 | – | 0.6 | 2.7 |
Effectiveness — Quality — Continuity indicators
Community follow up after psychiatric admission/hospitalisation
Proportion of State and Territory governments' specialised public admitted patient overnight acute separations from psychiatric units for which a community-based ambulatory contact was recorded in the seven days following separation, 2013-14.
| NSW | Vic | Qld | WA | SA | Tas | ACT | NT | Aust | |
|---|---|---|---|---|---|---|---|---|---|
| % | 63.7 | 72.2 | 73.7 | 57.0 | 57.8 | 59.5 | 72.5 | 47.9 | 66.4 |
Readmissions to hospital within 28 days of discharge
Proportion of State and Territory governments' admitted patient overnight separations from psychiatric acute inpatient units that were followed by readmission to a psychiatric acute inpatient unit within 28 days of discharge, 2013-14
| NSW | Vic | Qld | WA | SA | Tas | ACT | NT | Aust | |
|---|---|---|---|---|---|---|---|---|---|
| % | 14.3 | 14.7 | 13.4 | 14.3 | 6.9 | 13.5 | 10.7 | 10.9 | 13.7 |
Efficiency indicators
Cost of inpatient care
Cost per inpatient bed day — General mental health services (acute units) ($ per bed day), 2013-14
| NSW | Vic | Qld | WA | SA | Tas | ACT | NT | Aust | |
|---|---|---|---|---|---|---|---|---|---|
| $ | 1091.72 | 878.53 | 993.99 | 1287.11 | 1140.01 | 977.63 | 1063.98 | 1571.39 | 1060.56 |
Cost per inpatient bed day — General hospital with a psychiatric unit or ward (acute units) ($ per bed day)
| NSW | Vic | Qld | WA | SA | Tas | ACT | NT | Aust | |
|---|---|---|---|---|---|---|---|---|---|
| $ | 1111.51 | 874.72 | 1014.41 | 1267.47 | 1081.86 | 1181.06 | 1025.44 | 1571.39 | 1057.94 |
Cost of community based residential care
Average cost per patient day, 2013-14
| NSW | Vic | Qld | WA | SA | Tas | ACT | NT | Aust | |
|---|---|---|---|---|---|---|---|---|---|
| General adult units — 24-hour staffed units ($ per patient day) | 249.60 | 587.88 | .. | 545.56 | 511.06 | 516.96 | 668.45 | 442.30 | 535.58 |
Cost of ambulatory care
Average cost per treatment day, 2013-14 ($ per treatment day)
| NSW | Vic | Qld | WA | SA | Tas | ACT | NT | Aust | |
|---|---|---|---|---|---|---|---|---|---|
| $ | 218.17 | 366.92 | 344.03 | 426.38 | 345.34 | 317.71 | 217.39 | 431.66 | 304.47 |
Outcome indicators
Rates of licit and illicit drug use
Proportion of people aged 14 years or over who used any illicit drug in the preceding 12 months, 2013
| NSW | Vic | Qld | WA | SA | Tas | ACT | NT | Aust | |
|---|---|---|---|---|---|---|---|---|---|
| % | 11.4 | 11.0 | 12.6 | 13.7 | 12.5 | 13.3 | 12.4 | 19.0 | 12.0 |
Prevalence of mental illness
Proportion of people with lifetime mental disorders (with symptoms in the previous 12 months) among adults aged 16-85 years, 2007
| NSW | Vic | Qld | WA | SA | Tas | ACT | NT | Aust | |
|---|---|---|---|---|---|---|---|---|---|
| % | 20.1 ±2.2 | 20.7 ±2.3 | 19.2 ±2.6 | 21.4 ±4.1 | 19.1 ±3.4 | 14.1 ±5.4 | np | np | 20.0 ±1.1 |
Mortality due to suicide
Suicide rate per 100 000 people, 2009-2013
| NSW | Vic | Qld | WA | SA | Tas | ACT | NT | Aust | |
|---|---|---|---|---|---|---|---|---|---|
| Rate | 9.1 | 9.4 | 13.3 | 13.4 | 11.9 | 14.0 | 9.1 | 17.6 | 10.9 |
Physical health outcomes of people with mental illness
Proportion of people with a mental illness (compared to the proportion for people without a mental illness) who were daily smokers, 2011-12 (per cent)
| NSW | Vic | Qld | WA | SA | Tas | ACT | NT | Aust | |
|---|---|---|---|---|---|---|---|---|---|
| People with mental illness | 23.6 ±4.5 | 28.9 ±6.4 | 25.7 ±4.6 | 26.0 ±5.8 | 26.7 ±4.9 | 32.4 ±5.7 | 20.0 ±5.6 | 29.1 ±10.1 | 26.1 ±2.4 |
| People without mental illness | 13.4 ±1.5 | 14.7 ±1.7 | 15.8 ±2.1 | 15.0 ±1.9 | 15.5 ±2.1 | 21.5 ±2.3 | 11.7 ±2.7 | 21.8 ±3.0 | 14.7 ±0.8 |
Social and economic inclusion of people with mental illness
Proportion of people aged 15 years or over with a mental illness who had face-to-face contact with family or friends living outside the household in the last week, compared with the proportion for people without a mental illness, 2014
| NSW | Vic | Qld | WA | SA | Tas | ACT | NT | Aust | |
|---|---|---|---|---|---|---|---|---|---|
| % People with mental illness | 75.4 ±7.3 | 79.0 ±5.3 | 72.5 ±5.2 | 77.0 ±6.6 | 81.7 ±8.1 | 78.1 ±5.2 | 76.3 ±5.9 | 54.8 ±11.5 | 76.5 ±3.1 |
| % People without mental illness | 75.1 ±2.8 | 77.9 ±3.1 | 75.6 ±3.3 | 77.4 ±3.1 | 85.1 ±2.1 | 86.5 ±2.8 | 75.8 ±2.6 | 69.6 ±4.6 | 77.1 ±1.4 |
Mental health outcomes of consumers of specialised public mental health services
Proportion of people discharged from a State or Territory public hospital psychiatric inpatient unit who had a significant improvement in their clinical mental health outcomes, 2013-14
| NSW | Vic | Qld | WA | SA | Tas | ACT | NT | Aust | |
|---|---|---|---|---|---|---|---|---|---|
| % | 69.1 | 73.3 | 74.8 | 75.6 | 68.9 | 75.5 | 39.1 | 77.5 | 72.4 |
Legend
.. Not applicable.
np Not published.
Source: Chapter 12 and attachment 12APerformance indicator data for Aboriginal and Torres Strait Islander people in this chapter are available in the attachment tables listed below. Contextual data and further supporting information can be found in the chapter.
| Table number | Table title |
|---|---|
| Table 12A.34 | New clients as a proportion of total clients under the care of State or Territory specialised public mental health services, by selected characteristics, 2013-14 |
| Table 12A.36 | New clients as a proportion of total clients under the care of MBS subsidised mental health services, by selected characteristics, 2013-14 |
| Table 12A.37 | Proportion of people receiving clinical mental health services by service type and Indigenous status |
| Table 12A.46 | Proportion of young people (aged < 25 years) who had contact with MBS-subsidised primary mental health care services, by selected characteristics (per cent) |
| Table 12A.55 | Rate of community follow up within first seven days of discharge from a psychiatric admission, by State and Territory, by Indigenous status and remoteness (a), (b) |
| Table 12A.58 | Readmissions to hospital within 28 days of discharge, by selected characteristics, 2013-14 |
| Table 12A.66 | Recent drinkers lifetime and single occasion risk, people aged 14 years or older, by social characteristics, 2013 (per cent) |
| Table 12A.75 | Illicit drug use, people aged 14 years or older, by social characteristics (per cent) |
| Table 12A.85 | Suicide deaths, by Indigenous status, 2009-2013 |