Report on Government Services 2016
Chapter 11, Volume E
Public hospitals
The Public hospitals chapter (chapter 11) reports on the performance of governments in providing public hospitals, with a focus on acute care services. It also reports separately on a significant component of the services provided by public hospitals - maternity services.
Download the chapter
- Chapter 11 Public hospitals, attachment tables, and data quality information (PDF - 4740 Kb)
- Chapter 11 Attachment tables (XLSX - 1585 Kb)
- Key Facts
- Indicator Framework
- Indicator Results
- Indigenous Data
In this tab
This chapter reports on the performance of governments in providing public hospitals, with a focus on acute care services including maternity services.
Public hospitals
Total recurrent expenditure on public hospitals (excluding depreciation) was $44.4 billion in 2013-14. In 2013-14, government real recurrent expenditure on public hospitals was $1905 per person for Australia, up from $1692 in 2009-10 (in 2013-14 dollars).
Funding for public hospitals comes from a number of sources. The Australian, State and Territory governments contributed 91.0 per cent of funding for public hospital services in 2013 14, with non-government sources contributing 9.0 per cent.
Non-government sources include health insurance funds, individuals, workers' compensation and compulsory third-party motor vehicle insurers.
In 2013-14, Australia had 747 public hospitals. Although 72 per cent of hospitals had 50 or fewer beds, these smaller hospitals represented only 15 per cent of total available beds.
There were approximately 5.7 million separations from public (non-psychiatric) hospitals in 2013-14. Nationally, this translates into 234.0 separations per 1000 people. Acute separations accounted for 95.3 per cent of separations from public hospitals. Of the total number of separations in public (non-psychiatric) hospitals, 51.4 per cent were for same day patients.
A total of 46.5 million individual occasions of service were provided to non-admitted patients in public acute hospitals in 2013-14.
Public hospitals services aim to provide acute and specialist services that are:
- safe and of high quality
- appropriate and responsive to individual needs
- affordable, timely and accessible
- equitably and efficiently delivered.
Maternity services
Maternity services accounted for 8.3 per cent of total acute separations in public hospitals and 10.6 per cent of the total cost of all acute separations in public hospitals in 2013-14.
In Australian public hospitals in 2013-14, vaginal deliveries accounted for a substantial proportion of the separations for pregnancy, childbirth and the puerperium (41.1 per cent). The cost of vaginal deliveries was $780.5 million in 2013-14.
Maternity services aim to provide acute and specialist services that are:
- safe and of high quality
- appropriate and responsive to individual needs
- affordable, timely and accessible
- equitably and efficiently delivered.
In this tab
Public hospitals
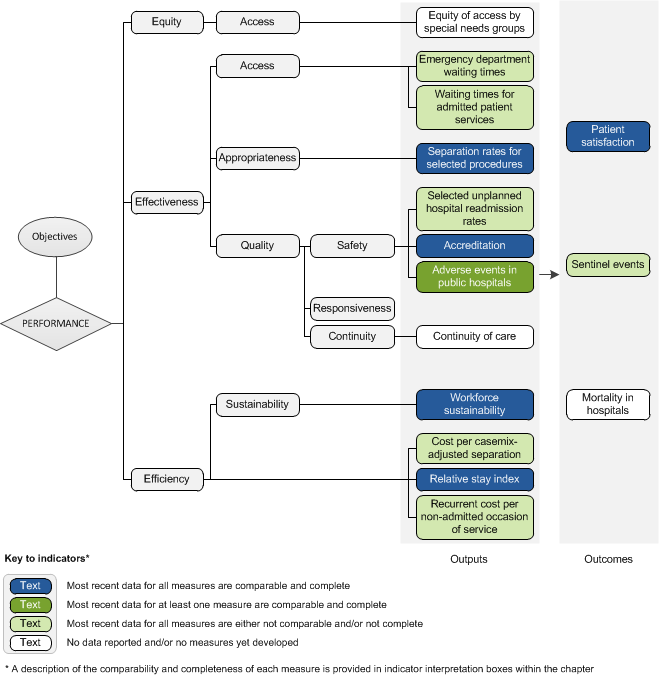
The performance indicator framework provides information on equity, efficiency and effectiveness, and distinguishes the outputs and outcomes of public hospitals. The performance indicator framework shows which data are complete and comparable in the 2016 Report.
Maternity services
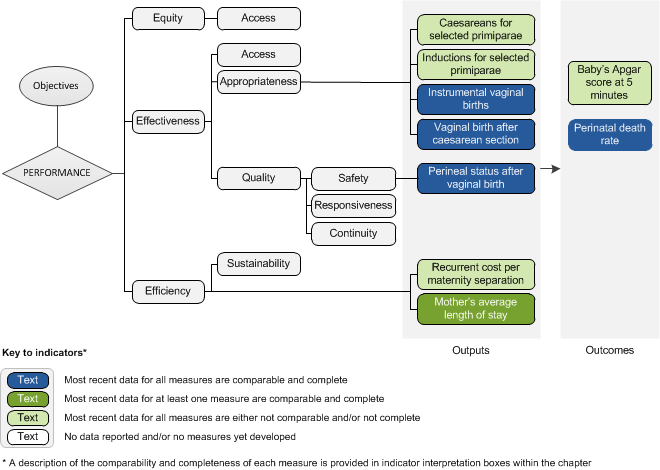
The performance indicator framework provides information on equity, efficiency and effectiveness, and distinguishes the outputs and outcomes of maternity services. The performance indicator framework shows which data are complete and comparable in the 2016 Report.
In this tab
Public hospitals
An overview of the Public hospitals performance indicator results are presented. Information to assist the interpretation of these data can be found in the indicator interpretation boxes in the Public hospitals chapter and attachment tables.
Effectiveness — Access indicators
Emergency department waiting times
Emergency department waiting times by triage category — proportion of patients seen on time (per cent), 2014-15
| Triage category | NSW | Vic | Qld | WA | SA | Tas | ACT | NT | Aust |
|---|---|---|---|---|---|---|---|---|---|
| Resuscitation | 100 | 100 | 99 | 100 | 100 | 100 | 100 | 100 | 100 |
| Emergency | 82 | 80 | 77 | 83 | 69 | 83 | 78 | 62 | 79 |
| Urgent | 76 | 73 | 64 | 57 | 57 | 64 | 48 | 54 | 68 |
| Semi-urgent | 81 | 73 | 74 | 69 | 69 | 67 | 53 | 59 | 74 |
| Non-urgent | 95 | 89 | 93 | 93 | 89 | 89 | 86 | 88 | 92 |
| Total | 81 | 75 | 71 | 68 | 66 | 70 | 59 | 60 | 74 |
Length of stay for emergency department care, proportion of patients staying for four hours or less, 2014-15
| NSW | Vic | Qld | WA | SA | Tas | ACT | NT | Aust | |
|---|---|---|---|---|---|---|---|---|---|
| % | 74.9 | 69.9 | 76.7 | 78.7 | 63.8 | 66.6 | 63.1 | 62.1 | 73.2 |
Emergency department waiting time to commencement of clinical care (minutes), 2014-15
| NSW | Vic | Qld | WA | SA | Tas | ACT | NT | Aust | |
|---|---|---|---|---|---|---|---|---|---|
| 50th percentile | 15 | 19 | 20 | 25 | 20 | 25 | 37 | 31 | 18 |
| 90th percentile | 78 | 97 | 93 | 99 | 113 | 107 | 147 | 130 | 93 |
Waiting times for admitted patient services
Overall elective surgery waiting times, 2014-15 (days waited)
| NSW | Vic | Qld | WA | SA | Tas | ACT | NT | Aust | |
|---|---|---|---|---|---|---|---|---|---|
| 50th percentile | 54 | 29 | 27 | 29 | 37 | 55 | 45 | 32 | 35 |
| 90th percentile | 330 | 177 | 147 | 148 | 210 | 424 | 245 | 217 | 253 |
Presentations to emergency departments with a length of stay of 4 hours or less ending in admission, public hospitals (per cent), 2014-15
| Triage category | NSW | Vic | Qld | WA | SA | Tas | ACT | NT | Aust |
|---|---|---|---|---|---|---|---|---|---|
| Resuscitation | 51 | 56 | 59 | 68 | 54 | 58 | 57 | 46 | 56 |
| Emergency | 43 | 49 | 56 | 60 | 37 | 35 | 46 | 24 | 48 |
| Urgent | 40 | 48 | 56 | 52 | 34 | 26 | 31 | 21 | 45 |
| Semi-urgent | 45 | 51 | 60 | 53 | 40 | 28 | 35 | 22 | 48 |
| Non-urgent | 65 | 64 | 66 | 63 | 58 | 45 | 42 | 29 | 63 |
| Total | 43 | 49 | 57 | 55 | 37 | 29 | 36 | 23 | 47 |
Length of stay of emergency department presentations ending in admission — Time waited at 50th percentile by triage category (hours:minutes), 2014-15
| NSW | Vic | Qld | WA | SA | Tas | ACT | NT | Aust | |
|---|---|---|---|---|---|---|---|---|---|
| Resuscitation | 3:59 | 3:45 | 3:37 | 3:04 | 3:36 | 3:24 | 3:27 | 4:28 | 3:45 |
| Emergency | 4:39 | 4:03 | 3:49 | 3:38 | 5:11 | 5:28 | 4:24 | 7:17 | 4:11 |
| Urgent | 4:58 | 4:14 | 3:52 | 3:58 | 5:31 | 6:24 | 5:51 | 7:22 | 4:26 |
| Semi-urgent | 4:32 | 3:59 | 3:44 | 3:56 | 4:52 | 6:12 | 5:22 | 6:54 | 4:11 |
| Non-urgent | 3:18 | 3:24 | 3:20 | 3:37 | 3:12 | 4:25 | 4:36 | 6:32 | 3:26 |
| Total | 4:43 | 4:05 | 3:50 | 3:53 | 5:12 | 6:05 | 5:21 | 7:08 | 4:16 |
Effectiveness — Appropriateness indicators
Separation rates for selected procedures
Separation rates for selected procedures in public hospitals, per 1000 people (age standardised), 2013-14
| NSW | Vic | Qld | WA | SA | Tas | ACT | NT | Aust | |
|---|---|---|---|---|---|---|---|---|---|
| Cataract extraction | 8.3 | 8.7 | 9.6 | 10.6 | 8.0 | 10.4 | 7.4 | 9.1 | 8.9 |
| Cholecystectomy | 2.2 | 2.3 | 2.4 | 2.0 | 2.1 | 2.4 | 2.5 | 1.7 | 2.2 |
| Coronary angioplasty | 1.5 | 1.5 | 1.5 | 1.4 | 1.2 | 1.2 | 3.2 | 0.3 | 1.5 |
| Coronary artery bypass graft | 0.5 | 0.5 | 0.6 | 0.4 | 0.6 | 0.3 | 0.7 | .. | 0.5 |
| Cystoscopy | 3.9 | 6.1 | 5.5 | 7.8 | 6.0 | 4.8 | 5.8 | 3.1 | 5.4 |
| Haemorrhoidectomy | 2.7 | 1.8 | 1.5 | 1.2 | 1.5 | 1.9 | 1.0 | 1.9 | 1.9 |
| Hip replacement | 1.4 | 1.7 | 1.4 | 1.7 | 1.7 | 1.9 | 2.3 | 0.7 | 1.6 |
| Hysterectomy | 2.1 | 2.3 | 2.7 | 3.8 | 1.8 | 2.7 | 3.8 | 0.8 | 2.4 |
| Inguinal herniorrhaphy | 2.0 | 2.1 | 2.1 | 2.1 | 2.0 | 2.1 | 2.4 | 1.7 | 2.1 |
| Knee replacement | 1.9 | 1.7 | 2.0 | 2.2 | 2.1 | 1.6 | 2.4 | 0.8 | 1.9 |
| Myringotomy | 1.4 | 1.7 | 1.4 | 2.0 | 2.6 | 1.2 | 2.3 | 0.7 | 1.6 |
| Prostatectomy | 2.5 | 2.8 | 2.7 | 2.9 | 1.9 | 2.6 | 8.1 | 0.2 | 2.6 |
| Septoplasty | 1.2 | 1.3 | 0.9 | 1.0 | 1.4 | 0.5 | 1.2 | 0.5 | 1.1 |
| Tonsillectomy | 2.3 | 2.6 | 2.3 | 2.8 | 2.8 | 1.8 | 4.0 | 1.2 | 2.5 |
| Varicose veins, stripping and ligation | 0.6 | 0.7 | 0.5 | 0.6 | 0.6 | 0.4 | 1.0 | 0.5 | 0.6 |
Effectiveness — Quality — Safety indicators
Selected unplanned hospital readmission rates
Rate at which patients unexpectedly return to hospital within 28 days for further treatment of the same condition (per 1000 separations), 2013-14
| Surgical procedure prior to separation | NSW | Vic | Qld | WA | SA | Tas | ACT | NT | Aust |
|---|---|---|---|---|---|---|---|---|---|
| Knee replacement | 21.4 | 21.2 | 31.3 | 34.4 | 18.5 | 33.8 | 30.6 | np | 23.7 |
| Hip replacement | 18.1 | 16.3 | 19.3 | 24.8 | 20.9 | 14.9 | 18.4 | – | 17.8 |
| Tonsillectomy and adenoidectomy | 28.5 | 30.1 | 43.4 | 45.4 | 35.7 | 35.3 | 27.3 | 58.5 | 33.0 |
| Hysterectomy | 28.6 | 26.0 | 34.8 | 37.3 | 30.9 | 8.4 | 64.1 | np | 29.8 |
| Prostatectomy | 25.8 | 19.8 | 30.4 | 29.6 | 29.3 | 30.5 | np | np | 25.5 |
| Cataract surgery | 2.7 | 3.7 | 4.3 | 2.1 | 1.7 | 2.1 | – | 9.3 | 3.1 |
| Appendicectomy | 18.3 | 20.3 | 19.7 | 32.9 | 25.7 | 19.1 | 30.2 | 34.9 | 20.3 |
Accreditation
Selected healthcare-associated infections in acute care hospitals, per 10 000 patient days, 2014-15
| NSW | Vic | Qld | WA | SA | Tas | ACT | NT | Aust | |
|---|---|---|---|---|---|---|---|---|---|
| % | 92.9 | 100.0 | 91.1 | 100.0 | 98.8 | 17.4 | 100.0 | 100.0 | 93.2 |
Adverse events in public hospitals
Selected healthcare-associated infections in acute care hospitals, per 10 000 patient days, 2014-15
| NSW | Vic | Qld | WA | SA | Tas | ACT | NT | Aust | |
|---|---|---|---|---|---|---|---|---|---|
| rate | 0.8 | 0.7 | 0.8 | 0.8 | 0.8 | 0.8 | 0.8 | 0.7 | 0.8 |
Adverse events treated in hospitals, per 100 separations, 2013-14
| NSW | Vic | Qld | WA | SA | Tas | ACT | NT | Aust | |
|---|---|---|---|---|---|---|---|---|---|
| Rate | 6.4 | 7.0 | 6.4 | 7.0 | 7.3 | 8.4 | 7.3 | 3.7 | 6.7 |
Falls resulting in patient harm in public hospitals, per 1000 separations, 2013-14
| NSW | Vic | Qld | WA | SA | Tas | ACT | NT | Aust | |
|---|---|---|---|---|---|---|---|---|---|
| Rate | 5.1 | 3.4 | 3.4 | 4.5 | 4.9 | 6.5 | 3.8 | 1.8 | 4.2 |
Efficiency sustainability indicators
Workforce sustainability
Nursing workforce by age group (per cent), 2014
| NSW | Vic | Qld | WA | SA | Tas | ACT | NT | Aust | |
|---|---|---|---|---|---|---|---|---|---|
| <30 | 15.8 | 18.0 | 15.3 | 16.4 | 14.5 | 13.1 | 16.7 | 17.2 | 16.2 |
| 30-39 | 20.2 | 20.9 | 20.7 | 20.8 | 19.3 | 15.9 | 22.3 | 26.6 | 20.5 |
| 40-49 | 23.5 | 24.7 | 26.7 | 25.3 | 25.2 | 25.5 | 25.2 | 22.8 | 24.9 |
| 50-59 | 28.3 | 25.6 | 26.8 | 26.5 | 30.4 | 33.9 | 25.7 | 23.8 | 27.3 |
| 60+ | 12.3 | 10.7 | 10.4 | 11.0 | 10.7 | 11.6 | 10.1 | 9.7 | 11.1 |
Medical practitioner workforce by age group (per cent), 2014
| NSW | Vic | Qld | WA | SA | Tas | ACT | NT | Aust | |
|---|---|---|---|---|---|---|---|---|---|
| <30 | 9.1 | 10.6 | 9.8 | 10.4 | 9.8 | 9.7 | 9.8 | 10.6 | 9.8 |
| 30-39 | 26.2 | 28.5 | 28.5 | 29.2 | 27.6 | 24.5 | 26.8 | 37.3 | 27.8 |
| 40-49 | 24.3 | 23.4 | 25.8 | 25.7 | 24.5 | 25.8 | 24.4 | 22.2 | 24.5 |
| 50-59 | 20.8 | 20.6 | 20.9 | 19.5 | 20.5 | 22.5 | 23.1 | 16.8 | 20.7 |
| 60+ | 19.5 | 16.9 | 15.0 | 15.2 | 17.6 | 17.5 | 15.8 | 13.1 | 17.2 |
Efficiency indicators
Cost per casemix adjusted separation
Recurrent cost per casemix-adjusted separation, 2013-14
| NSW | Vic | Qld | WA | SA | Tas | ACT | NT | Aust | |
|---|---|---|---|---|---|---|---|---|---|
| $ | 4788 | 4228 | 4783 | 5624 | 5402 | 4942 | 6664 | 6840 | 4836 |
Total cost per casemix-adjusted separation, 2013-14
| NSW | Vic | Qld | WA | SA | Tas | ACT | NT | Aust | |
|---|---|---|---|---|---|---|---|---|---|
| $ | 738 | 819 | 614 | 554 | 710 | 668 | 907 | 548 | 709 |
Relative stay index, 2013-14
Acute care patient days divided by expected number of acute care patient days, adjusted for casemix
| NSW | Vic | Qld | WA | SA | Tas | ACT | NT | Aust | |
|---|---|---|---|---|---|---|---|---|---|
| Total | 1.03 | 0.92 | 0.86 | 0.97 | 1.05 | 0.99 | 1.08 | 1.14 | 0.97 |
Recurrent cost per non-admitted occasion of service, 2013-14
Most recent data for this measure are neither comparable nor complete (chapter 11) Data are available in attachment tables 11A.61-11A.65
Outcome indicators
Patient satisfaction, 2014-15
Proportion (%) of persons who went to an emergency department in the last 12 months reporting that:
ED doctors, specialists or nurses always or often listened carefully to them
| NSW | Vic | Qld | WA | SA | Tas | ACT | NT | Aust | |
|---|---|---|---|---|---|---|---|---|---|
| Doctors / specialists | 86.9 | 83.7 | 83.9 | 88.8 | 84.4 | 87.4 | 86.8 | 85.5 | 85.2 |
| Nurses | 90.5 | 91.2 | 88.6 | 92.6 | 88.2 | 91.2 | 91.8 | 91.2 | 90.4 |
ED doctors, specialists or nurses always or often showed respect to them
| NSW | Vic | Qld | WA | SA | Tas | ACT | NT | Aust | |
|---|---|---|---|---|---|---|---|---|---|
| Doctors / specialists | 90.1 | 86.1 | 86.6 | 89.5 | 86.4 | 88.1 | 89.3 | 88.2 | 87.7 |
| Nurses | 90.8 | 90.3 | 88.7 | 92.7 | 88.6 | 93.7 | 94.8 | 91.2 | 90.7 |
ED doctors, specialists or nurses always or often spent enough time with them
| NSW | Vic | Qld | WA | SA | Tas | ACT | NT | Aust | |
|---|---|---|---|---|---|---|---|---|---|
| Doctors / specialists | 85.0 | 80.9 | 81.2 | 83.7 | 80.4 | 82.5 | 82.0 | 87.1 | 82.4 |
| Nurses | 87.6 | 85.9 | 84.4 | 90.7 | 85.1 | 88.5 | 89.4 | 91.5 | 86.8 |
Proportion (%) of persons who were admitted to hospital in the last 12 months reporting that:
Hospital doctors, specialists or nurses always or often listened carefully to them
| NSW | Vic | Qld | WA | SA | Tas | ACT | NT | Aust | |
|---|---|---|---|---|---|---|---|---|---|
| Doctors / specialists | 92.0 | 88.8 | 88.8 | 88.9 | 89.1 | 88.8 | 88.1 | 94.3 | 89.9 |
| Nurses | 92.9 | 89.6 | 90.0 | 90.7 | 89.9 | 91.8 | 91.6 | 94.7 | 90.8 |
Hospital doctors, specialists or nurses always or often showed respect to them
| NSW | Vic | Qld | WA | SA | Tas | ACT | NT | Aust | |
|---|---|---|---|---|---|---|---|---|---|
| Doctors / specialists | 92.5 | 90.7 | 90.2 | 90.5 | 91.1 | 90.1 | 88.5 | 90.5 | 91.0 |
| Nurses | 93.7 | 91.1 | 90.3 | 90.7 | 90.3 | 92.7 | 90.1 | 94.7 | 91.9 |
Hospital doctors, specialists or nurses always or often spent enough time with them
| NSW | Vic | Qld | WA | SA | Tas | ACT | NT | Aust | |
|---|---|---|---|---|---|---|---|---|---|
| Doctors / specialists | 89.6 | 84.9 | 86.4 | 87.0 | 88.2 | 84.5 | 83.3 | 90.2 | 87.2 |
| Nurses | 90.0 | 88.6 | 87.7 | 85.9 | 86.4 | 90.3 | 88.4 | 93.1 | 88.6 |
Sentinel events, 2012-13
Adverse events occurring due to hospital system and process deficiencies that result in death of, or serious harm to, a patient
Most recent data for this measure are not comparable but are complete (subject to caveats) (chapter 11) Data are available in tables 11A.77-11A.85
Maternity services
An overview of the Maternity services performance indicator results are presented. Information to assist the interpretation of these data can be found in the indicator interpretation boxes in the Public hospitals chapter and attachment tables.
Effectiveness — Appropriateness indicators
Caesareans and inductions for selected primiparae
Proportion (%) of births for selected primiparae that were caesareans / inductions, public hospitals, 2014
| NSW | Vic | Qld | WA | SA | Tas | ACT | NT | Aust | |
|---|---|---|---|---|---|---|---|---|---|
| Caesareans | 23.5 | 25.1 | 22.6 | 25.0 | 28.4 | 24.1 | 22.4 | 29.7 | 24.3 |
| Inductions | 40.4 | 38.6 | 31.1 | 37.6 | 41.0 | 50.1 | 30.4 | 41.7 | 37.9 |
Instrumental vaginal births
Proportion of births for women giving birth for the first time that were instrumental vaginal births, 2013
| NSW | Vic | Qld | WA | SA | Tas | ACT | NT | Aust | |
|---|---|---|---|---|---|---|---|---|---|
| % | 22.9 | 29.1 | 22.4 | 29.6 | 24.2 | 23.0 | 28.4 | 19.4 | 25.3 |
Vaginal birth after caesarean section, 2013
Proportion (%) of multiparous mothers who have had a previous caesarean, whose current method of birth was either an instrumental or non-instrumental vaginal birth, 2013
| NSW | Vic | Qld | WA | SA | Tas | ACT | NT | Aust | |
|---|---|---|---|---|---|---|---|---|---|
| Non-instrumental | 12.5 | 10.2 | 12.8 | 9.7 | 12.7 | 13.2 | 14.1 | 19.1 | 11.8 |
| Instrumental | 3.7 | 4.1 | 2.7 | 3.6 | 3.5 | 3.1 | 5.5 | 3.4 | 3.6 |
Effectiveness — Quality — Safety indicators
Perineal status after vaginal birth
Proportion of women with third or fourth degree lacerations to the perineum following vaginal birth, 2013
| NSW | Vic | Qld | WA | SA | Tas | ACT | NT | Aust | |
|---|---|---|---|---|---|---|---|---|---|
| % | 2.0 | 1.9 | 2.2 | 1.6 | 2.3 | 1.8 | 4.4 | 2.0 | 2.0 |
Efficiency indicators
Recurrent cost per maternity separation
Recurrent cost per maternity separation without catastrophic or severe complications and comorbidities (dollars), public hospitals, 2013-14.
| NSW | Vic | Qld | WA | SA | Tas | ACT | NT | Aust | |
|---|---|---|---|---|---|---|---|---|---|
| $/Caesarean | 8279 | 10 241 | 9874 | 8803 | 13 458 | 9921 | 15 932 | 11 425 | 9811 |
| $/Vaginal delivery | 5930 | 6512 | 6167 | 5315 | 8291 | 5655 | 12 703 | 6214 | 6423 |
Mother's average length of stay
Average length of stay for selected maternity AR-DGs, public hospitals (days), 2013-14
| NSW | Vic | Qld | WA | SA | Tas | ACT | NT | Aust | |
|---|---|---|---|---|---|---|---|---|---|
| O01C Caesarean delivery | 3.6 | 3.5 | 3.2 | 3.5 | 3.7 | 3.6 | 3.5 | 4.2 | 3.5 |
| O60C Vaginal delivery | 2.3 | 2.2 | 1.9 | 2.2 | 2.1 | 2.3 | 1.8 | 2.8 | 2.2 |
Outcome indicators
Baby's Apgar score at 5 minutes
Proportion of live births with an Apgar score of less than 4, at 5 minutes, by birthweight category, 2014
| NSW | Vic | Qld | WA | SA | Tas | ACT | NT | Aust | |
|---|---|---|---|---|---|---|---|---|---|
| <1500g | 14.5 | 18.2 | 18.2 | 5.8 | 9.0 | 18.8 | 13.2 | 25.5 | 15.1 |
| 1500-1999g | 0.8 | 0.7 | 1.4 | 0.3 | – | – | 2.1 | 1.7 | 0.9 |
| 2000-2499g | 0.4 | 0.3 | 0.6 | 0.5 | 0.3 | 0.5 | 0.4 | 0.5 | 0.4 |
| 2500g+ | 0.2 | 0.2 | 0.2 | 0.2 | 0.1 | 0.1 | 0.5 | 0.3 | 0.2 |
Perinatal death rate
Perineal death rate per 1000 total births, 2013
| NSW | Vic | Qld | WA | SA | Tas | ACT | NT | Aust | |
|---|---|---|---|---|---|---|---|---|---|
| Fetal deaths | 5.6 | 6.0 | 5.9 | 5.9 | 3.8 | 7.2 | 5.2 | 9.5 | 5.7 |
| Neonatal deaths | 2.6 | 2.1 | 3.2 | 1.6 | 2.3 | 2.3 | 1.8 | 4.9 | 2.5 |
| Perinatal deaths | 8.1 | 8.2 | 9.1 | 7.5 | 6.1 | 9.5 | 7.0 | 14.4 | 8.2 |
Legend
– Nil or rounded to zero.
.. Not applicable.
np Not published.
Performance indicator data for Aboriginal and Torres Strait Islander people in this chapter are available in the attachment tables listed below. Contextual data and further supporting information can be found in the chapter.
| Table number | Table title |
|---|---|
| Table 11A.16 | Patients treated within national benchmarks for emergency department waiting time, by Indigenous status, by State and Territory |
| Table 11A.23 | Waiting times for elective surgery in public hospitals, by Indigenous status and procedure, by State and Territory (days) |
| Table 11A.48 | Selected unplanned hospital readmission rates, by Indigenous status, hospital peer group, remoteness and SEIFA IRSD quintiles, 2013-14 |
| Table 11A.52 | Separations for falls resulting in patient harm in hospitals, per 1000 separations, 2013-14 |
| Table 11A.109 | Perinatal, neonatal and fetal deaths |