Report on Government Services 2016
Chapter 8, Volume C
Corrective services
The Corrective services chapter (chapter 8) reports on prison custody and a range of community corrections orders and programs for adult offenders which are delivered separately by the eight States and Territories.
Download the chapter
- Chapter 8 Corrective services, attachment tables, and data quality information (PDF - 1799 Kb)
- Chapter 8 Attachment tables (XLSX - 1054 Kb)
- Key Facts
- Indicator Framework
- Indicator Results
- Indigenous Data
This chapter reports on prison custody and a range of community corrections orders and programs for adult offenders which are delivered separately by the eight States and Territories.
- In 2014-15, on average 34 982 people per day were held in Australian prisons — an increase of 7.0 per cent from 2013-14. Nationally, 18.3 per cent of the total prisoner population (excluding periodic detainees) were held in privately operated facilities. Males comprised 92.2 per cent of all prisoners in prison custody in Australia and 7.8 per cent were females. Aboriginal and Torres Strait Islander prisoners comprised 27.6 per cent of the total prisoner population.
- Nationally, corrective services agencies operated 111 custodial facilities at 30 June 2015. Community corrections is responsible for a range of non-custodial sanctions and also manages prisoners who are released into the community and continue to be subject to corrective services supervision.
- In some jurisdictions, community corrections responsibility includes managing offenders on supervised bail orders. Nationally, an average of 57 429 offenders per day were serving community corrections orders in 2014-15 — an increase of 2.0 per cent from 2013-14. Males comprised 81.6 per cent of the daily number of offenders serving community corrections orders and 18.4 per cent were females. Aboriginal and Torres Strait Islander offenders comprised 20.0 per cent of the total offender population.
- Nationally in 2014-15, net operating expenditure on corrective services including depreciation was $3.7 billion.
Corrective services contribute to the whole-of-government priority, in all jurisdictions, to create safer communities through the administration of correctional sentences and orders. In summary, the objectives of corrective services are to:
- provide a safe, secure and humane custodial environment
- provide an effective community corrections environment
- provide program interventions to reduce the risk of re-offending.
The performance indicator framework provides information on equity, efficiency and effectiveness, and distinguishes the outputs and outcomes of corrective services. The performance indicator framework shows which data are complete and comparable in the 2016 Report.
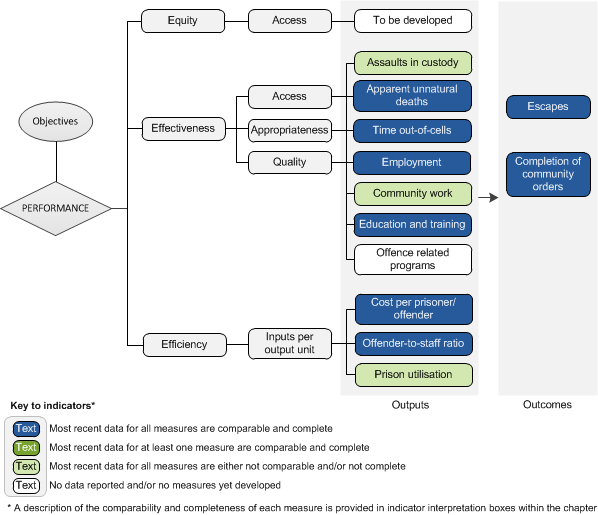
An overview of the Corrective services performance indicator results are presented. Information to assist the interpretation of these data can be found in the indicator interpretation boxes in the Corrective services chapter and attachment tables.
Effectiveness indicators
Assaults in custody
Number of victims of violent physical attacks reported over the year, per 100 prisoners, 2014-15 - prisoner on prisoner (rate)
| NSW | Vic | Qld | WA | SA | Tas | ACT | NT | Aust | |
|---|---|---|---|---|---|---|---|---|---|
| Serious assault | 0.56 | 1.69 | 1.80 | 0.59 | 1.40 | 2.14 | 3.21 | 0.13 | 1.11 |
| Assault | 15.07 | 12.24 | 5.00 | 5.42 | 5.86 | 8.55 | 12.56 | 3.06 | 9.64 |
Number of victims of violent physical attacks reported over the year, per 100 prisoners, 2014-15 - prisoner on officer (rate)
| NSW | Vic | Qld | WA | SA | Tas | ACT | NT | Aust | |
|---|---|---|---|---|---|---|---|---|---|
| Serious assault | – | 0.08 | 0.08 | 0.09 | – | – | – | – | 0.05 |
| Assault | 0.51 | 1.56 | 0.25 | 1.98 | 0.79 | 1.71 | 0.88 | – | 0.89 |
Apparent unnatural deaths
Rate of prisoner deaths from apparent unnatural causes (deaths per 100 prisoners), by Indigenous status, 2014-15
| NSW | Vic | Qld | WA | SA | Tas | ACT | NT | Aust | |
|---|---|---|---|---|---|---|---|---|---|
| Aboriginal and Torres Strait Islander | – | – | 0.09 | 0.05 | 0.17 | – | – | – | 0.04 |
| Non-Indigenous | 0.02 | 0.05 | 0.02 | 0.06 | 0.15 | 0.51 | – | – | 0.05 |
Number of prisoner deaths from apparent unnatural causes, by Indigenous status, 2014-15
| NSW | Vic | Qld | WA | SA | Tas | ACT | NT | Aust | |
|---|---|---|---|---|---|---|---|---|---|
| Aboriginal and Torres Strait Islander | – | – | 2 | 1 | 1 | – | – | – | 4 |
| Non-Indigenous | 2 | 3 | 1 | 2 | 3 | 2 | – | – | 13 |
Time out of cells
Average number of hours per day that prisoners are not confined to their cells or units, 2014-15
| NSW | Vic | Qld | WA | SA | Tas | ACT | NT | Aust | |
|---|---|---|---|---|---|---|---|---|---|
| Open | 10.3 | 14.6 | 15.8 | 15.8 | 15.5 | 16.8 | 11.5 | 24.0 | 13.5 |
| Secure | 6.7 | 10.7 | 9.0 | 11.7 | 8.5 | 8.8 | 8.8 | 7.9 | 9.1 |
| Total | 8.0 | 11.3 | 9.6 | 12.4 | 9.2 | 9.0 | 8.9 | 16.6 | 10.1 |
Employment
Number of prisoners employed as a percentage of those eligible to work, 2014-15
| NSW | Vic | Qld | WA | SA | Tas | ACT | NT | Aust | |
|---|---|---|---|---|---|---|---|---|---|
| % | 76.1 | 89.3 | 66.0 | 73.7 | 68.3 | 57.8 | 65.4 | 74.7 | 74.8 |
Community work
Ratio of number of hours directed to work and hours actually worked, 2014-15
| NSW | Vic | Qld | WA | SA | Tas | ACT | NT | Aust | |
|---|---|---|---|---|---|---|---|---|---|
| Ratio | na | 3.5 | 2.1 | 1.9 | 3.5 | na | 1.8 | 1.8 | na |
Education and training
Percentage of eligible prisoners participating in education and training courses, 2014-15
| NSW | Vic | Qld | WA | SA | Tas | ACT | NT | Aust | |
|---|---|---|---|---|---|---|---|---|---|
| % | 31.7 | 35.7 | 28.0 | 24.0 | 53.1 | 16.9 | 76.3 | 14.1 | 31.6 |
Efficiency indicators
Cost per prisoner/offender
Average net daily cost of providing corrective services per prisoner and per offender (excluding capital costs), 2014-15 ($)
| NSW | Vic | Qld | WA | SA | Tas | ACT | NT | Aust | |
|---|---|---|---|---|---|---|---|---|---|
| Prisoner | 180.9 | 297.3 | 177.9 | 282.9 | 207.4 | 363.3 | 296.0 | 211.5 | 224.2 |
| Offender | 23.8 | 25.7 | 14.0 | 46.9 | 17.8 | 13.4 | 31.8 | 43.5 | 22.6 |
Offender-to-staff ratio
Daily average number of offenders per full-time community corrections staff member employed, 2014-15
| NSW | Vic | Qld | WA | SA | Tas | ACT | NT | Aust | |
|---|---|---|---|---|---|---|---|---|---|
| Operational staff | 20.8 | 16.3 | 35.1 | 12.6 | 23.6 | 29.6 | 16.1 | 11.7 | 21.2 |
| Other staff | 86.2 | 78.5 | 74.8 | 38.1 | 66.9 | 152.5 | 56.1 | 43.8 | 72.2 |
| All staff | 16.7 | 13.5 | 23.9 | 9.5 | 17.5 | 24.8 | 12.5 | 9.2 | 16.4 |
Prison utilisation
Annual daily average prisoner population as a percentage of the number of single occupancy cells and designated beds in shared occupancy cells, 2014-15 (%)
| NSW | Vic | Qld | WA | SA | Tas | ACT | NT | Aust | |
|---|---|---|---|---|---|---|---|---|---|
| Open | 106.2 | na | 77.5 | 84.5 | na | 100.0 | 73.1 | 93.0 | 97.2 |
| Secure | 115.5 | na | 106.8 | 105.1 | na | 77.9 | 130.0 | 120.8 | 109.3 |
| Total | 112.0 | na | 103.5 | 100.7 | na | 78.4 | 126.8 | 107.2 | 106.1 |
Outcome indicators
Escapes
Rate of escapes by prisoners (number per 100 prisoners) from secure custody and open custody, 2014-15
| NSW | Vic | Qld | WA | SA | Tas | ACT | NT | Aust | |
|---|---|---|---|---|---|---|---|---|---|
| Open | 0.13 | 0.49 | 0.82 | 0.52 | 1.07 | – | – | 1.33 | 0.43 |
| Secure | 0.01 | – | – | 0.02 | – | – | – | 0.11 | 0.01 |
Number of escapes by prisoners from secure custody and open custody, 2014-15
| NSW | Vic | Qld | WA | SA | Tas | ACT | NT | Aust | |
|---|---|---|---|---|---|---|---|---|---|
| Open | 5 | 5 | 5 | 5 | 3 | – | – | 9 | 32 |
| Secure | 1 | – | – | 1 | – | – | – | – | 3 |
Completion of community orders
Percentage of orders completed during the year that were not breached for failure to meet the order requirements or because further offences were committed, 2014-15
| NSW | Vic | Qld | WA | SA | Tas | ACT | NT | Aust | |
|---|---|---|---|---|---|---|---|---|---|
| % | 75.8 | 66.5 | 75.6 | 61.2 | 67.5 | 87.6 | 79.9 | 69.0 | 72.9 |
Legend
a Caveats for these data are available in Chapter 8 and Attachment 8A. Refer to the indicator interpretation boxes in chapter 8 for information to assist with interpreting data presented in this table.
b These data are derived from detailed data in Chapter 8 and Attachment 8A.
na Not available.
.. Not applicable.
- Nil or rounded to zero.
Source: Chapter 8 and Attachment 8APerformance indicator data for Aboriginal and Torres Strait Islander people in this chapter are available in the attachment tables listed below. Contextual data and further supporting information can be found in the chapter.
| Table number | Table title |
|---|---|
| Table 8A.15 | Deaths from apparent unnatural causes, by Indigenous status, 2014-15 (per 100 prisoners/detainees) |
| Table 8A.26 | NSW Effectiveness, prisons |
| Table 8A.34 | Victoria Effectiveness, prisons |
| Table 8A.40 | Queensland Effectiveness, prisons |
| Table 8A.52 | SA Effectiveness, prisons |
| Table 8A.58 | Tasmania Effectiveness, prisons |
| Table 8A.64 | ACT Effectiveness, prisons |
| Table 8A.72 | NT Effectiveness, prisons |