Report on Government Services 2017
Volume E, Chapter 11
Ambulance services
Performance reporting for ambulance events includes information on ambulance service organisations, which are the primary agencies involved in providing services for out-of-hospital medical emergency events.
Please note: An errata was released with this chapter. The files below have been updated to reflect the changes.
Download the chapter
- Chapter 11 Ambulance services and attachment tables (PDF - 2224 Kb)
- Chapter 11 Attachment tables (XLSX - 618 Kb)
- Key Facts
- Indicator Framework
- Indicator Results
Nationally in 2015-16:
- there were 3.4 million incidents resulting in 4.3 million ambulance service responses to attend to 3.2 million patients
- recurrent expenditure across Australia was approximately $3.0 billion (or $126 per person)
- there were 16 087 full time equivalent paid personnel, 6182 volunteers and 2620 community first responders in ambulance service organisations. (Community first responders are trained volunteers that provide an emergency response (with no transport capacity) and first aid care before ambulance arrival.)
Ambulance services aim to promote health and reduce the adverse effects of emergency events on the community. Governments’ involvement in ambulance services is aimed at providing emergency medical care, pre-hospital and out-of-hospital care, and transport services that are:
- accessible and timely
- meet patients’ needs through delivery of appropriate health care
- high quality — safe, co-ordinated and responsive healthcare
- sustainable.
Governments aim for ambulance services to meet these objectives in an equitable and efficient manner.
The performance indicator framework provides information on equity, efficiency and effectiveness, and distinguishes the outputs and outcomes of ambulance services. The performance indicator framework shows which data are complete and comparable in the 2017 Report.
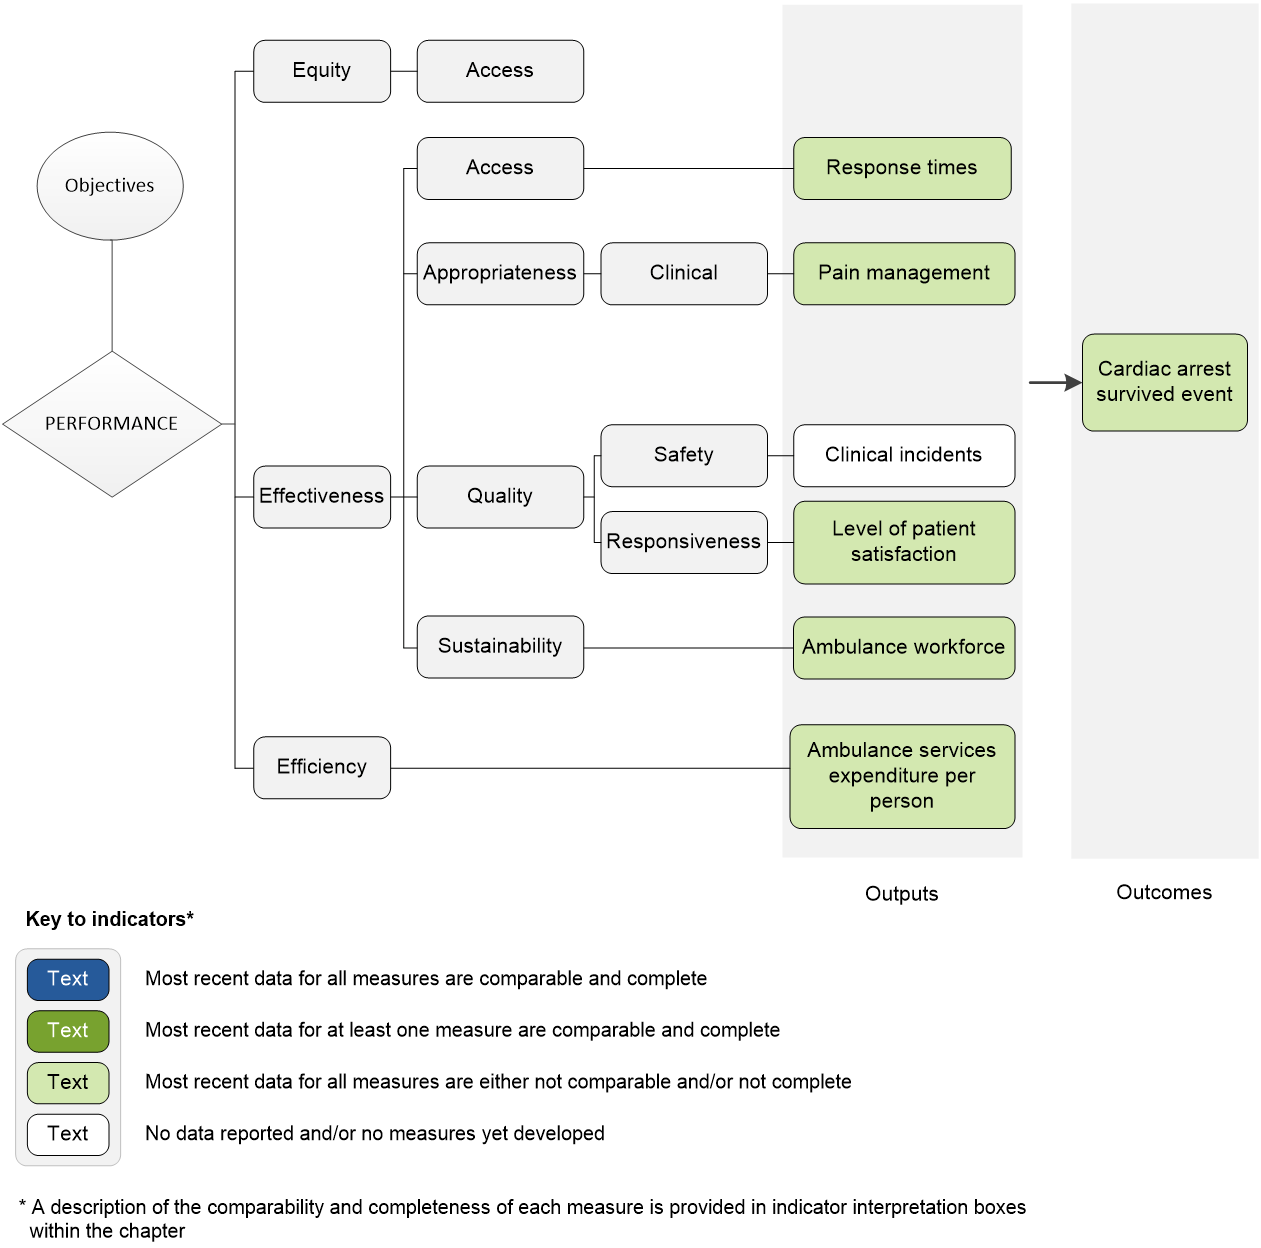
An overview of the Ambulance services performance indicator results are presented. Information to assist the interpretation of these data can be found in the indicator interpretation boxes in the Ambulance services chapter and attachment tables.
Effectiveness — Access indicators
Response times
Capital city centre response times, 90th percentile, 2015-16
| NSW | Vic | Qld | WA | SA | Tas | ACT | NT | Aust | |
|---|---|---|---|---|---|---|---|---|---|
| min. | 20.6 | 18.2 | 16.0 | 14.2 | 16.0 | 19.4 | 13.7 | 29.4 | .. |
State-wide response times, 90th percentile, 2015-16
| NSW | Vic | Qld | WA | SA | Tas | ACT | NT | Aust | |
|---|---|---|---|---|---|---|---|---|---|
| min. | 22.9 | 21.5 | 17.1 | 14.9 | 18.0 | 26.3 | 13.7 | 27.3 | .. |
Source: Attachment table 11A.14
Proportion of calls from the emergency call service answered by ambulance service communication centre staff in a time equal to or less than 10 seconds, 2015-16
| NSW | Vic | Qld | WA | SA | Tas | ACT | NT | Aust | |
|---|---|---|---|---|---|---|---|---|---|
| % | 81.2 | 93.1 | 91.6 | 95.2 | 95.3 | 95.3 | 96.6 | 95.9 | 93.2 |
Source: Attachment table 11A.15
Effectiveness — Appropriateness indicators
Pain management
Proportion of patients who report a clinically meaningful pain reduction, 2015-16
| NSW | Vic | Qld | WA | SA | Tas | ACT | NT | Aust | |
|---|---|---|---|---|---|---|---|---|---|
| % | 85.3 | 89.8 | 88.7 | 86.2 | 73.1 | 85.9 | 88.5 | 73.8 | 87.9 |
Source: Attachment table 11A.12
Effectiveness — Quality indicators
Level of patient satisfaction
Overall satisfaction rate, 2016
| NSW | Vic | Qld | WA | SA | Tas | ACT | NT | Aust | |
|---|---|---|---|---|---|---|---|---|---|
| % | na | 97 ± 1.6 | 100 ± 0.7 | 97 ± 1.8 | 98 ± 1.5 | 98 ± 1.1 | 98 ± 1.3 | 96 ± 3.3 | 98 ± 0.5 |
Effectiveness — Sustainability indicators
Ambulance workforce
Operational workforce under 50 years of age, 2015-16
| NSW | Vic | Qld | WA | SA | Tas | ACT | NT | Aust | |
|---|---|---|---|---|---|---|---|---|---|
| % | 74.5 | 75.5 | 79.6 | 82.2 | 73.8 | 77.2 | 76.2 | 84.5 | 77.3 |
Source: Attachment table 11A.6
Staff attrition rate, 2015-16
| NSW | Vic | Qld | WA | SA | Tas | ACT | NT | Aust | |
|---|---|---|---|---|---|---|---|---|---|
| % | 3.6 | 3.4 | 2.6 | 3.0 | 1.7 | 4.1 | 3.8 | 13.5 | 3.3 |
Source: Attachment table 11A.6
Efficiency indicators
Ambulance services expenditure per person
Ambulance services expenditure per person, 2015-16
| NSW | Vic | Qld | WA | SA | Tas | ACT | NT | Aust | |
|---|---|---|---|---|---|---|---|---|---|
| $ | 115.80 | 134.99 | 139.56 | 92.72 | 159.30 | 133.83 | 120.30 | 114.95 | 126.40 |
Outcome indicators
Cardiac arrest survived event rate
Adult cardiac arrest survival rate — where resuscitation attempted (excluding paramedic witnessed), 2014-15
| NSW | Vic | Qld | WA | SA | Tas | ACT | NT | Aust | |
|---|---|---|---|---|---|---|---|---|---|
| % | 31.9 | 27.6 | 29.6 | 22.3 | 24.2 | 25.0 | 24.7 | 21.6 | 28.2 |
Notes
These data and caveats for these data are available in chapter 11 and attachment 11A.
Some percentages reported in these tables include 95 per cent confidence intervals (for example, 80 per cent ± 2.7 per cent).
na Not available. .. Not applicable.