Report on Government Services 2018
Part F, Chapter 16
Child protection services
This chapter reports on the performance of governments in providing child protection, out-of-home care, family support services and intensive family support services.
Download the chapter
- Chapter 16 Child protection services and attachment tables (PDF - 2733 Kb)
- Chapter 16 Child protection services (Word - 383 Kb)
- Chapter 16 Attachment tables (XLSX - 1003 Kb)
- Key Facts
- Indicator Framework
- Indicator Results
- Indigenous Data
Nationally, 49 315 children aged 0–17 years were the subject of a substantiation in 2016‑17.
At 30 June 2017:
- 54 666 children aged 0–17 years were on care and protection orders nationally, 19 662 of whom were Aboriginal and Torres Strait Islander
- 47 915 children were in out-of-home care nationally, 17 664 of whom were Aboriginal and Torres Strait Islander.
Total recurrent expenditure on child protection, out-of-home care, family support services and intensive family support services was $5.2 billion nationally in 2016-17 — a real increase of 8.5 per cent from 2015-16.
Child protection services provide supports and interventions to promote child and family wellbeing, and to protect children and young people aged 0‑17 years who are at risk of abuse and neglect within their families, or whose families do not have the capacity to provide care and protection.
To achieve these aims, governments seek to provide child protection services that:
- are responsive, ensuring that notifications are responded to, and investigations are completed, in a timely and appropriate manner
- are targeted to children and young people who are at greatest risk
- support and strengthen families so that children can live in a safe and stable family environment
- provide quality care for children and young people aged 0–17 years who cannot live with their parents for reasons of safety or family crisis, with an emphasis on safety, stability and permanency in children's living arrangements
- meet the needs of individual children and young people in the child protection system.
Governments aim for child protection services to meet these objectives in an equitable and efficient manner.
The performance indicator framework provides information on equity, efficiency and effectiveness, and distinguishes the outputs and outcomes of child protection services. The performance indicator framework shows which data are complete and comparable in the 2018 Report.
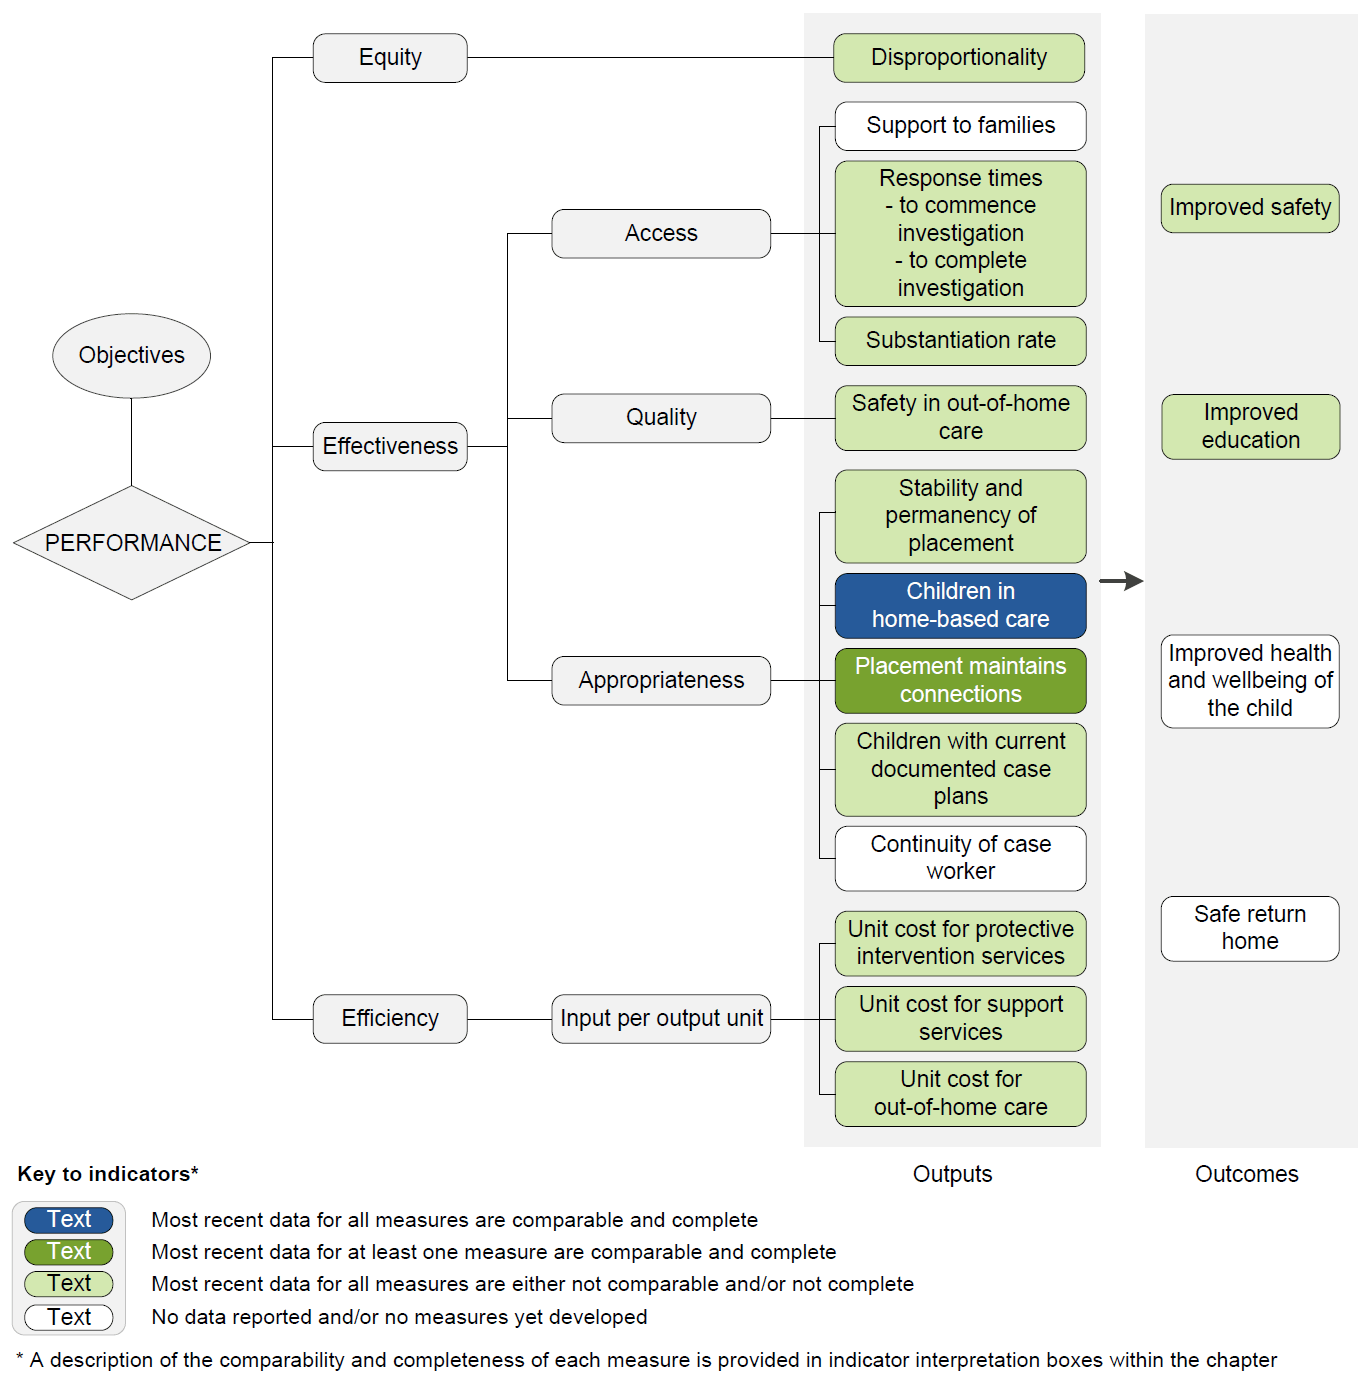
An overview of the Child protection services performance indicator results are presented. Information to assist the interpretation of these data can be found in the indicator interpretation boxes in the Child protection services chapter and attachment tables.
Equity indicators
Disproportionality
Disproportionality ratio for Aboriginal and Torres Strait Islander children in the child protection system, 2016-17
| NSW | Vic | Qld | WA | SA | Tas | ACT | NT | Aust | |
|---|---|---|---|---|---|---|---|---|---|
| Notifications | 3.90 | 4.69 | 4.06 | 5.22 | 5.13 | 1.27 | 4.33 | 1.79 | .. |
| Commencing IFSS | 3.48 | 2.70 | na | 3.36 | 7.03 | na | 9.44 | 1.88 | .. |
| Investigations | 4.70 | 6.87 | 4.08 | 6.27 | 6.97 | 1.75 | 8.48 | 1.88 | .. |
| Substantiations | 5.38 | 7.55 | 4.47 | 6.79 | 6.81 | 1.81 | 9.82 | 2.05 | .. |
| Care and protection orders | 6.86 | 12.35 | 5.32 | 8.43 | 7.37 | 2.73 | 10.26 | 2.09 | .. |
| Out of home care | 7.07 | 12.77 | 5.36 | 8.59 | 7.31 | 2.72 | 10.23 | 2.10 | .. |
Effectiveness — Access indicators
Response times — commencing investigations
Proportion of investigations commenced within 7 days of, or more than 29 days from, notification, 2016-17 (per cent)
| NSW | Vic | Qld | WA | SA | Tas | ACT | NT | Aust | |
|---|---|---|---|---|---|---|---|---|---|
| Within 7 days | 64.1 | 79.4 | 25.4 | 70.6 | 72.9 | 13.3 | 39.1 | 89.6 | 63.1 |
| More than 29 days | 15.1 | 0.3 | 50.5 | 13.3 | 12.2 | 65.6 | 27.9 | 1.2 | 16.7 |
Response times — completing investigations
Proportion of investigations completed within 28 days of, or more than 90 days from, notification, 2016‑17 (per cent)
| NSW | Vic | Qld | WA | SA | Tas | ACT | NT | Aust | |
|---|---|---|---|---|---|---|---|---|---|
| Within 28 days | 51.5 | 36.7 | 11.6 | 17.1 | 14.9 | 17.0 | 6.8 | 41.7 | 39.1 |
| More than 90 days | 12.2 | 17.1 | 41.9 | 39.3 | 47.1 | 51.0 | 47.1 | 21.4 | 20.8 |
Substantiation rate
Proportion of finalised child protection investigations that were substantiated, 2016‑17
| NSW | Vic | Qld | WA | SA | Tas | ACT | NT | Aust | |
|---|---|---|---|---|---|---|---|---|---|
| % | 38.3 | 54.8 | 32.4 | 49.1 | 50.0 | 74.1 | 27.9 | 36.7 | 41.6 |
Effectiveness — Quality indicators
Safety in out-of-home care
Children in care who were the subject of a substantiation and the person responsible was living in the household providing out‑of‑home care, as a proportion of all children in care, 2016‑17
| NSW | Vic | Qld | WA | SA | Tas | ACT | NT | Aust | |
|---|---|---|---|---|---|---|---|---|---|
| % | 2.5 | 1.0 | na | 0.2 | 2.8 | na | 0.4 | na | .. |
Effectiveness — Appropriateness indicators
Stability and permanency of placement
Proportion of children on a care and protection order exiting care after less than 12 months, or after after 12 months or more, in 1 or 2 placements, 2016‑17 (per cent)
| NSW | Vic | Qld | WA | SA | Tas | ACT | NT | Aust | |
|---|---|---|---|---|---|---|---|---|---|
| < 12 months | 91.0 | 88.4 | 86.2 | 87.3 | 83.5 | 90.0 | 92.3 | 66.1 | 87.8 |
| > 12 months | 52.2 | 52.1 | 38.2 | 60.7 | 41.0 | 55.7 | 60.7 | 35.1 | 49.0 |
Children in home-based care
Proportion of children aged under 12 years in out‑of‑home care who were in a home‑based placement at 30 June 2017
| NSW | Vic | Qld | WA | SA | Tas | ACT | NT | Aust | |
|---|---|---|---|---|---|---|---|---|---|
| % | 98.6 | 99.3 | 97.6 | 95.1 | 87.7 | 97.4 | 97.7 | 94.4 | 97.3 |
Placement maintains connections
Proportion of children in out-of-home care placed with relatives/kin, 2016-17
| NSW | Vic | Qld | WA | SA | Tas | ACT | NT | Aust | |
|---|---|---|---|---|---|---|---|---|---|
| % | 51.4 | 58.0 | 44.6 | 48.7 | 44.9 | 37.0 | 54.4 | 5.3 | 49.5 |
Proportion of Aboriginal and Torres Strait Islander children placed in accordance with the Aboriginal and Torres Strait Islander Child Placement Principle, 2016-17
| NSW | Vic | Qld | WA | SA | Tas | ACT | NT | Aust | |
|---|---|---|---|---|---|---|---|---|---|
| % | 80.9 | 77.9 | 57.0 | 60.2 | 62.5 | 41.3 | 60.1 | 32.3 | 67.6 |
Children with current documented case plans
Proportion of children with current documented case plans, 2016-17
| NSW | Vic | Qld | WA | SA | Tas | ACT | NT | Aust | |
|---|---|---|---|---|---|---|---|---|---|
| % | 85.6 | 85.3 | 96.2 | 77.2 | na | 60.2 | 73.1 | 63.4 | 85.3 |
Efficiency — Inputs per output unit indicators
Unit cost for protective intervention support services
Cost per notification investigated, 2016‑17
| NSW | Vic | Qld | WA | SA | Tas | ACT | NT | Aust | |
|---|---|---|---|---|---|---|---|---|---|
| $ | 858 | 1421 | 1677 | 2259 | 2728 | 1970 | 1215 | 486 | .. |
Unit cost for out-of-home care
Cost per placement night, 2016‑17
| NSW | Vic | Qld | WA | SA | Tas | ACT | NT | Aust | |
|---|---|---|---|---|---|---|---|---|---|
| $ | 173.13 | 158.49 | 162.92 | 173.18 | 324.08 | 147.64 | 149.72 | 327.26 | 181.37 |
Unit cost for support services
Cost per child receiving intensive family support services, 2016‑17
| NSW | Vic | Qld | WA | SA | Tas | ACT | NT | Aust | |
|---|---|---|---|---|---|---|---|---|---|
| $ | 10 423 | 7 888 | na | 9 153 | 23 696 | 2 549 | 12 924 | 11 680 | .. |
Outcome indicators
Improved safety
Substantiation rate after decision not to substantiate, 3 and 12 months, 2015‑16 (per cent)
| NSW | Vic | Qld | WA | SA | Tas | ACT | NT | Aust | |
|---|---|---|---|---|---|---|---|---|---|
| 3 months | 4.5 | 5.6 | 3.8 | 3.8 | 6.2 | 7.2 | 6.8 | 3.0 | .. |
| 12 months | 9.5 | 15.4 | 10.1 | 12.8 | 13.3 | 15.9 | 14.3 | 11.8 | .. |
Substantiation rate after a prior substantiation, 3 and 12 months, 2015‑16 (per cent)
| NSW | Vic | Qld | WA | SA | Tas | ACT | NT | Aust | |
|---|---|---|---|---|---|---|---|---|---|
| 3 months | 9.1 | 3.0 | 7.4 | 5.5 | 7.1 | 8.1 | 6.1 | 7.7 | .. |
| 12 months | 15.4 | 14.3 | 17.8 | 17.3 | 15.2 | 23.5 | 16.3 | 22.6 | .. |
Improved education
Children on guardianship/custody orders achieving the national benchmarks, reading and numeracy, 2013 (per cent)
| NSW | Vic | Qld | WA | SA | Tas | ACT | NT | Aust | |
|---|---|---|---|---|---|---|---|---|---|
| Reading | 86.0 | 79.2 | 78.0 | 80.1 | 78.9 | 79.2 | 88.2 | 66.7 | .. |
| Numeracy | 74.9 | 71.5 | 64.5 | 64.8 | 62.9 | 70.2 | 88.9 | 41.7 | .. |
Notes
These data and caveats for these data are available in chapter 16 and attachment 16A.
na Not available. .. Not applicable. np Not published.
Performance indicator data for Aboriginal and Torres Strait Islander people in this chapter are available in the attachment tables listed below. Contextual data and further supporting information can be found in the chapter.
| Table number | Table title |
|---|---|
| Table 16A.8 | Disproportionality ratios for Aboriginal and Torres Strait Islander children |
| Table 16A.17 | Children in out-of-home care and in a home-based placement, by Indigenous status, by age, at 30 June |
| Table 16A.19 | Children in out-of-home care placed with relatives/kin by Indigenous status, 30 June |
| Table 16A.20 | Aboriginal and Torres Strait Islander children in out-of-home care by relationship of caregiver, 30 June |
| Table 16A.21 | Children with documented case plans, by Indigenous status, at 30 June |