Report on Government Services 2015
Chapter 15, Volume F
Child protection
The Child protection services chapter (chapter 15) of the Report on Government Services reports on the performance of governments in providing child protection, out of home care and family support services.
Download the chapter
- Chapter 15 Child protection services, attachment tables, and data quality information (PDF - 2235 Kb)
- Chapter 15 Attachment tables (XLSX - 667 Kb)
- Key Facts
- Indicator Framework
- Indicator Results
Nationally, 40 844 children aged 0-17 years were the subject of a substantiation in 2013-14, however the criteria for substantiation vary across jurisdictions.
At 30 June 2014, 45 746 children aged 0-17 years were on care and protection orders nationally, 15 504 of which were Aboriginal and Torres Strait Islander.
At 30 June 2014, 43 009 children were in out-of-home care nationally, 14 991 of which were Aboriginal and Torres Strait Islander. Total recurrent expenditure on child protection and out-of-home care services was approximately $3.3 billion across Australia in 2013-14 — a real increase of $77.8 million (2.4 per cent) from 2012-13.
Child protection services aim to protect children and young people at risk of harm within their family or in circumstances in which the family of the child/young person does not have the capacity to protect them. Services also aim to assist families to protect children and young people. Out-of-home care services aim to provide quality care for children/young people who cannot live with their parents for reasons of safety or family crisis.
The performance indicator framework provides information on equity, efficiency and effectiveness, and distinguishes the outputs and outcomes of child protection services. The performance indicator framework shows which data are complete and comparable in the 2015 Report.
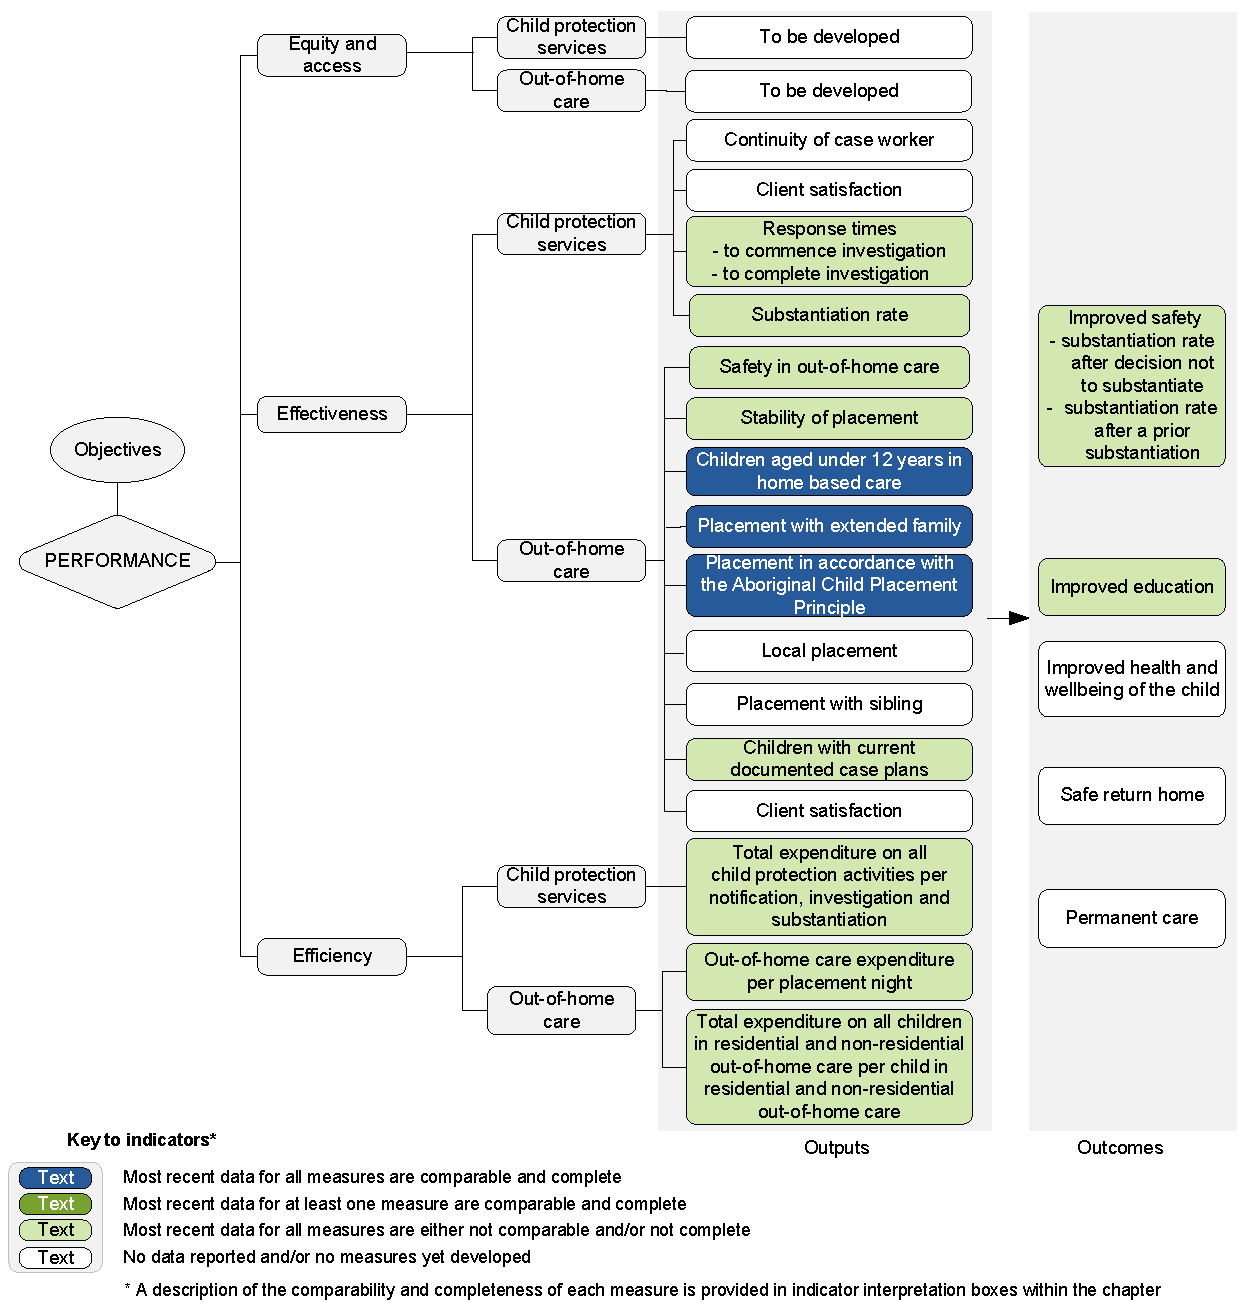
An overview of the Child protection services performance indicator results are presented. Information to assist the interpretation of these data can be found in the indicator interpretation boxes in the Child protection services chapter and attachment tables.
Effectiveness — Child protection indicators
Response times
Data for this indicator are not complete or not directly comparable (chapter 15)
| NSW | Vic | Qld | WA | SA | Tas | ACT | NT | Aust | |
|---|---|---|---|---|---|---|---|---|---|
| % | 62.9 | 33.6 | 26.5 | 27.6 | 32.8 | 29.2 | 19.5 | 37.1 | 45.8 |
Source: Attachment table 15A.16.
| NSW | Vic | Qld | WA | SA | Tas | ACT | NT | Aust | |
|---|---|---|---|---|---|---|---|---|---|
| % | 8.2 | 21.5 | 20.9 | 29.1 | 20.8 | 22.4 | 17.3 | 25.4 | 15.7 |
Source: Attachment table 15A.16.
Substantiation rate
Data for this indicator are not complete or not directly comparable (chapter 15)
| NSW | Vic | Qld | WA | SA | Tas | ACT | NT | Aust | |
|---|---|---|---|---|---|---|---|---|---|
| % | 40.7 | 59.8 | 36.1 | 30.1 | 48.9 | 60.9 | 38.3 | 46.1 | 42.7 |
Source: Attachment table 15A.9.
Effectiveness — Out-of-home care indicators
Safety in out-of-home care
Data for this indicator are not complete or not directly comparable (chapter 15)
| NSW | Vic | Qld | WA | SA | Tas | ACT | NT | Aust | ||
|---|---|---|---|---|---|---|---|---|---|---|
| % | 0.3 | 1.1 | 1.6 | 0.2 | 0.4 | 0.7 | 2.6 | na | .. |
Legend: na Not available; .. Not applicable
Source: Attachment table 15A.27.
Stability of placement
Data for this indicator are comparable, subject to caveats (chapter 15)
| NSW | Vic | Qld | WA | SA | Tas | ACT | NT | Aust | |
|---|---|---|---|---|---|---|---|---|---|
| % | 89.7 | 78.8 | 88.5 | na | 82.3 | 90.1 | 75.5 | 88.3 | 84.1 |
Legend: na Not available
Source: Attachment table 15A.26.
| NSW | Vic | Qld | WA | SA | Tas | ACT | NT | Aust | |
|---|---|---|---|---|---|---|---|---|---|
| % | 51.6 | 48.4 | 43.5 | na | 36.7 | 47.4 | 51.9 | 33.3 | 46.9 |
Legend: na Not available
Source: Attachment table 15A.26.
Children aged under 12 years in home based care
Data for this indicator are comparable, subject to caveats (chapter 15)
| NSW | Vic | Qld | WA | SA | Tas | ACT | NT | Aust | |
|---|---|---|---|---|---|---|---|---|---|
| % | 99.6 | 98.1 | 97.7 | 93.6 | 91.3 | 95.7 | 98.8 | 92.4 | 97.6 |
Source: Attachment table 15A.25.
Placement with extended family
Data for this indicator are comparable, subject to caveats (chapter 15)
| NSW | Vic | Qld | WA | SA | Tas | ACT | NT | Aust | |
|---|---|---|---|---|---|---|---|---|---|
| % | 55.2 | 50.3 | 40.4 | 48.9 | 44.2 | 28.7 | 53.0 | 1.9 | 48.5 |
Source: Attachment table 15A.23.
Placement in accordance with the Aboriginal Child Placement Principle
Data for this indicator are comparable, subject to caveats (chapter 15)
| NSW | Vic | Qld | WA | SA | Tas | ACT | NT | Aust | |
|---|---|---|---|---|---|---|---|---|---|
| % | 81.4 | 66.9 | 55.1 | 65.9 | 66.7 | 40.5 | 55.3 | 42.6 | 68.7 |
Source: Attachment table 15A.24.
Efficiency — Child protection services indicators
Total expenditure on all child protection activities per notification, investigation and substantiation
Data for this indicator are not complete or not directly comparable (chapter 15)
| NSW | Vic | Qld | WA | SA | Tas | ACT | NT | Aust | |
|---|---|---|---|---|---|---|---|---|---|
| $ | 3125 | 2300 | 12 835 | 8799 | 2782 | 1629 | 1104 | 2722 | .. |
Legend: .. Not applicable
Source: Attachment table 15A.2.
| NSW | Vic | Qld | WA | SA | Tas | ACT | NT | Aust | |
|---|---|---|---|---|---|---|---|---|---|
| $ | 5980 | 8887 | 12 835 | 11 384 | 8332 | 14 266 | 8711 | 7182 | .. |
Legend: .. Not applicable
Source: Attachment table 15A.2.
| NSW | Vic | Qld | WA | SA | Tas | ACT | NT | Aust | |
|---|---|---|---|---|---|---|---|---|---|
| $ | 15 019 | 15 796 | 40 305 | 42 254 | 19 889 | 26 938 | 26 075 | 21 577 | .. |
Legend: .. Not applicable
Source: Attachment table 15A.2.
Efficiency — Out-of-home care services indicators
Out-of-home care expenditure per placement night
Data for this indicator are not complete or not directly comparable (chapter 15)
| NSW | Vic | Qld | WA | SA | Tas | ACT | NT | Aust | |
|---|---|---|---|---|---|---|---|---|---|
| $ | 123 | 152 | 143 | 174 | 170 | 122 | 146 | 279 | 142 |
Source: Attachment table 15A.29.
Total expenditure on all children in residential and non-residential out-of-home care per child in residential and non-residential out-of-home care
Data for this indicator are not complete or not directly comparable (chapter 15)
| NSW | Vic | Qld | WA | SA | Tas | ACT | NT | Aust | |
|---|---|---|---|---|---|---|---|---|---|
| $ | 43 908 | 52 157 | 51 246 | 60 695 | 61 539 | 44 839 | 55 047 | 91 058 | .. |
Legend: .. Not applicable
Source: Attachment table 15A.3.
Outcomes
Improved safety
Data for this indicator are not complete or not directly comparable (chapter 15)
| NSW | Vic | Qld | WA | SA | Tas | ACT | NT | Aust | |
|---|---|---|---|---|---|---|---|---|---|
| % | 6.5 | 4.4 | 4.2 | 3.1 | 7.8 | 4.2 | 4.9 | 3.7 | .. |
Legend: .. Not applicable
Source: Attachment table 15A.10.
| NSW | Vic | Qld | WA | SA | Tas | ACT | NT | Aust | |
|---|---|---|---|---|---|---|---|---|---|
| % | 16.5 | 15.1 | 11.6 | 9.0 | 16.0 | 13.7 | 11.2 | 14.8 | .. |
Legend: .. Not applicable
Source: Attachment table 15A.10.
| NSW | Vic | Qld | WA | SA | Tas | ACT | NT | Aust | |
|---|---|---|---|---|---|---|---|---|---|
| % | 8.8 | 2.6 | 8.6 | 5.9 | 8.5 | 7.2 | 16.8 | 6.2 | .. |
Legend: .. Not applicable
Source: Attachment table 15A.11.
| NSW | Vic | Qld | WA | SA | Tas | ACT | NT | Aust | |
|---|---|---|---|---|---|---|---|---|---|
| % | 22.2 | 13.2 | 19.8 | 13.4 | 20.3 | 21.6 | 28.4 | 20.5 | .. |
Legend: .. Not applicable
Source: Attachment table 15A.11.