Report on Government Services 2015
Chapter 11, Volume E
Public hospitals
The Public hospitals chapter (chapter 11) of the Report on Government Services reports on the performance of governments in providing public hospitals, with a focus on acute care services. It also reports separately on a significant component of the services provided by public hospitals - maternity services.
Download the chapter
- Chapter 11 Public hospitals, attachment tables, and data quality information (PDF - 5444 Kb)
- Chapter 11 Attachment tables (XLSX - 1787 Kb)
- Key Facts
- Indicator Framework
- Indicator Results
In this tab
Public hospitals
Total recurrent expenditure on public hospitals (excluding depreciation) was $41.7 billion in 2012-13. In 2012-13, government real recurrent expenditure on public hospitals was $1819 per person for Australia, up from $1616 in 2008-09 (in 2012-13 dollars).
Funding for public hospitals comes from a number of sources. The Australian, State and Territory governments contributed 91.0 per cent of funding for public hospital services in 2012-13. Public hospital services accounted for 41.8 per cent of government recurrent expenditure on health services in 2012-13.
Non government sources contributed 9.0 per cent of all recurrent expenditure on public hospital services in 2012-13. Non-government sources include health insurance funds, individuals, workers' compensation and compulsory third-party motor vehicle insurers.
In 2012-13, Australia had 746 public hospitals (including 17 psychiatric hospitals). Although 71 per cent of hospitals had 50 or fewer beds, these smaller hospitals represented only 15 per cent of total available beds.
There were approximately 5.5 million separations from public (non psychiatric) hospitals in 2012-13. Nationally, this translates into 231.6 separations per 1000 people. Acute separations accounted for 95.1 per cent of separations from public hospitals. Of the total number of separations in public (non psychiatric) hospitals, 50.4 per cent were for same day patients.
A total of 54.1 million individual occasions of service were provided to non-admitted patients in public acute hospitals in 2012-13.
Public hospitals services aim to provide acute and specialist services that are:
- safe and of high quality
- appropriate and responsive to individual needs
- affordable, timely and accessible
- equitably and efficiently delivered.
Maternity services
Maternity services accounted for 8.5 per cent of total acute separations in public hospitals and 10.6 per cent of the total cost of all acute separations in public hospitals in 2012-13.
In Australian public hospitals in 2012-13, vaginal deliveries accounted for a substantial proportion of the separations for pregnancy, childbirth and the puerperium (41.9 per cent). In public hospitals, vaginal deliveries comprised the largest number of overnight acute separations of all overnight separation categories (4.6 per cent of all separations) with a cost of $775.6 million.
Maternity services aim to provide acute and specialist services that are:
- safe and of high quality
- appropriate and responsive to individual needs
- affordable, timely and accessible
- equitably and efficiently delivered.
In this tab
Public hospitals
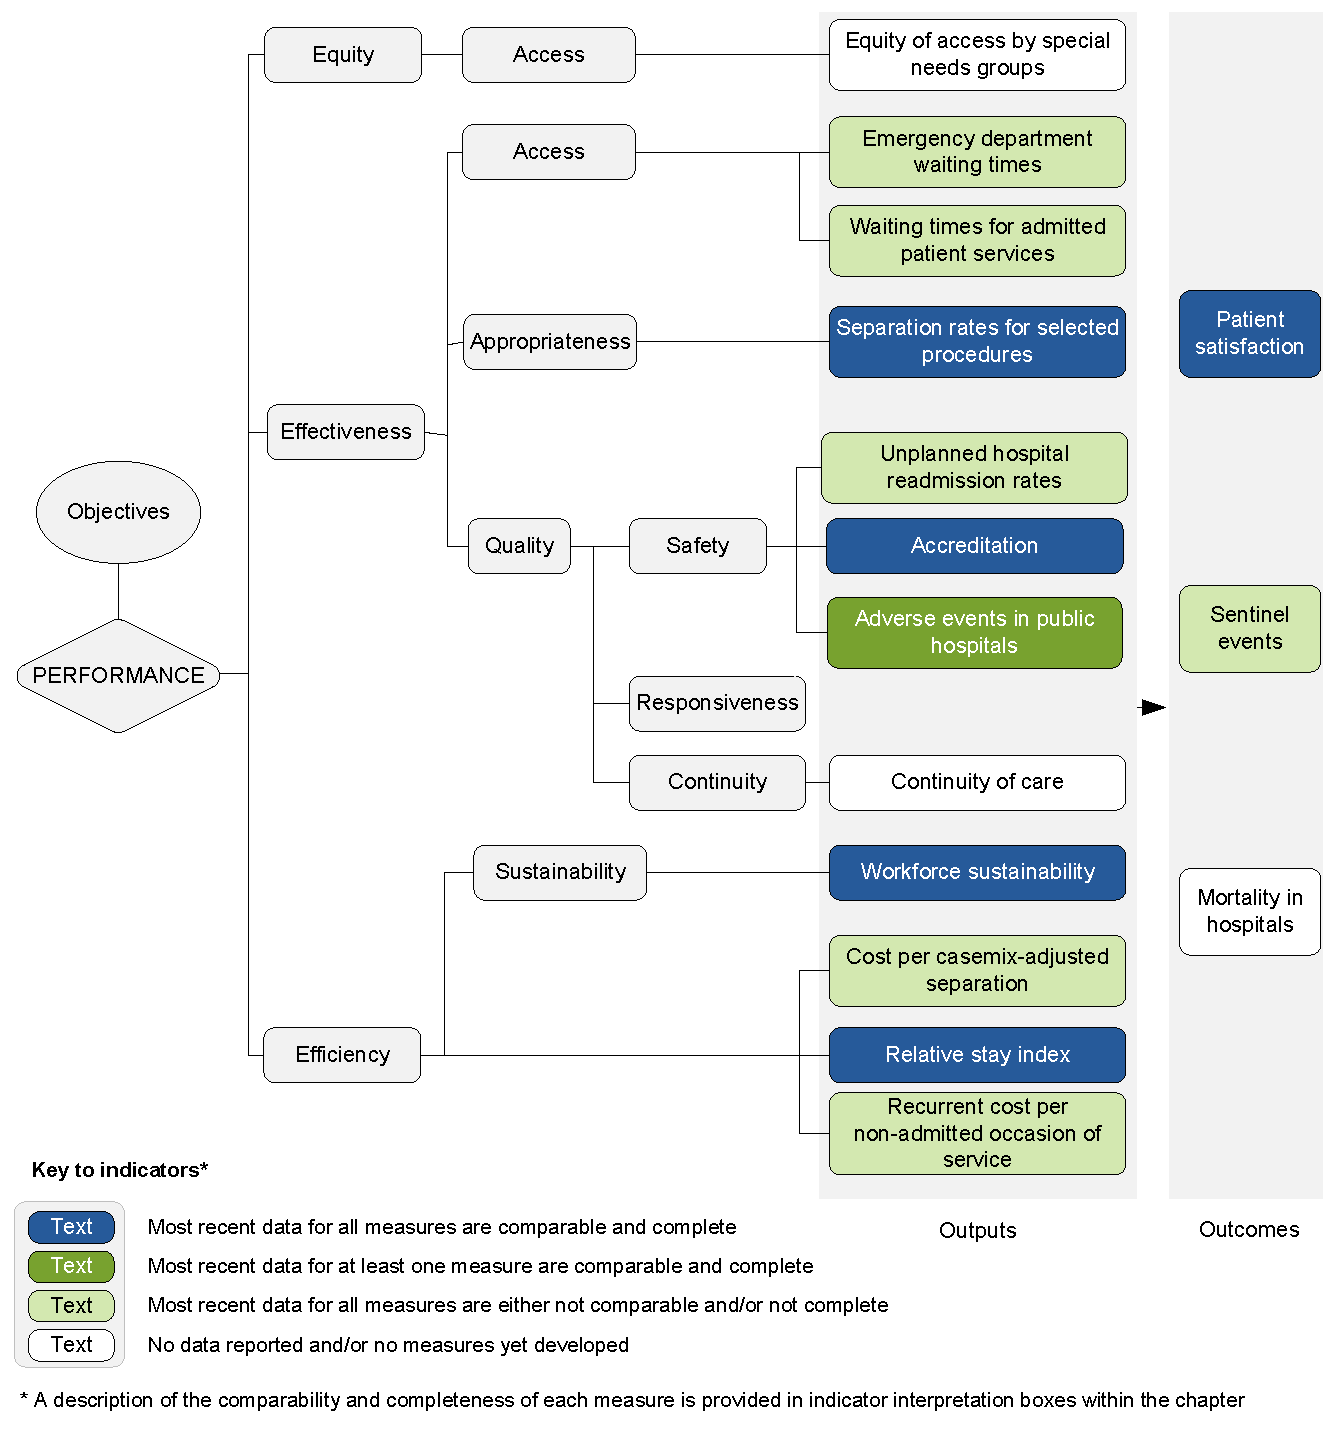
The performance indicator framework provides information on equity, efficiency and effectiveness, and distinguishes the outputs and outcomes of public hospitals. The performance indicator framework shows which data are complete and comparable in the 2015 Report.
Maternity services
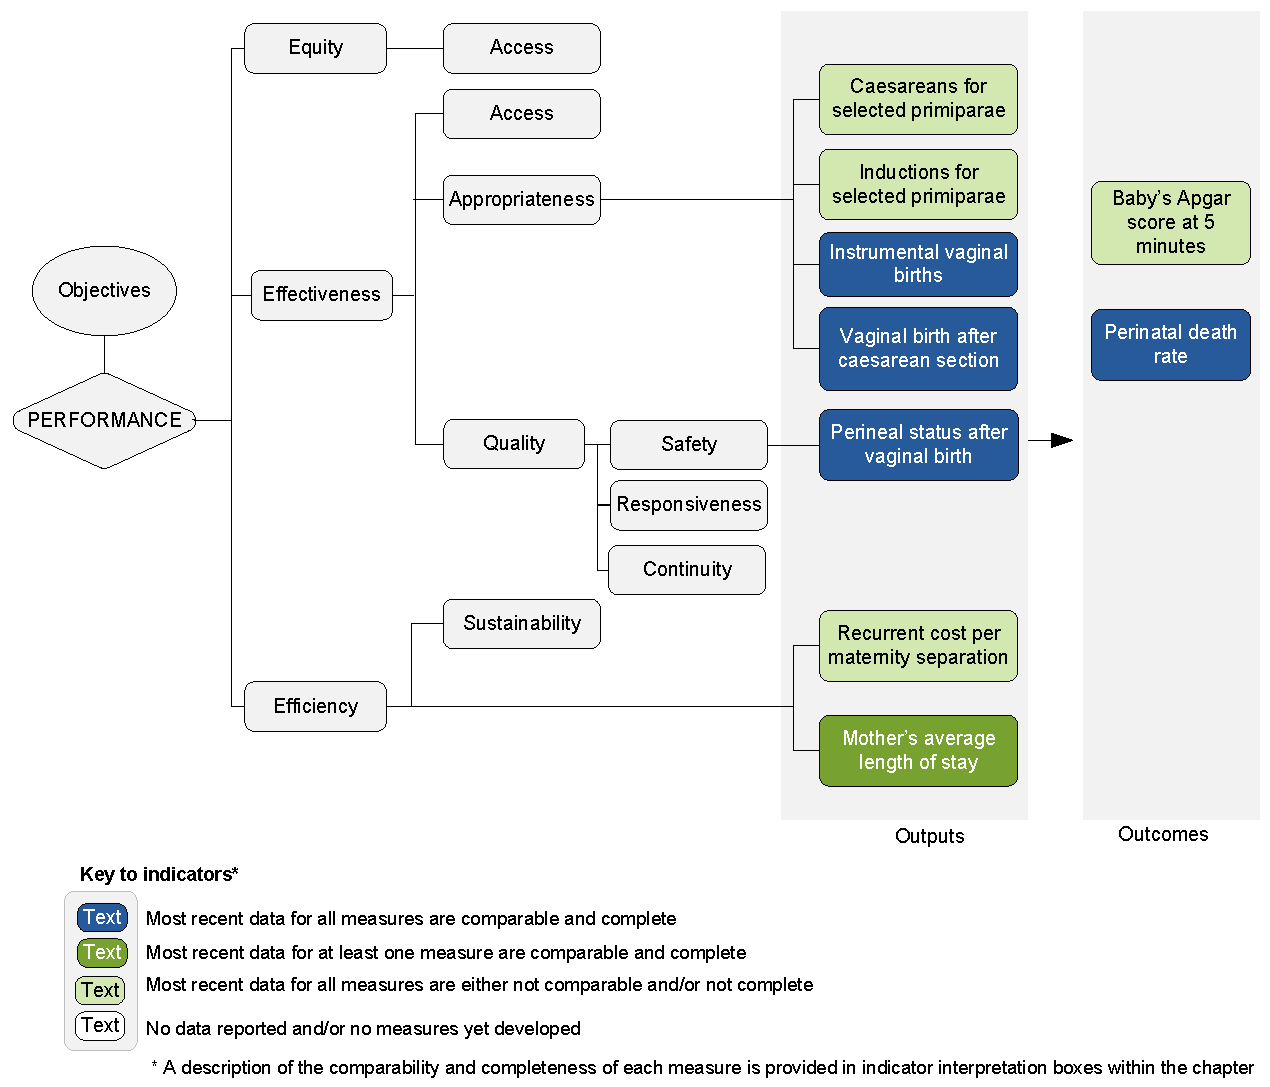
The performance indicator framework provides information on equity, efficiency and effectiveness, and distinguishes the outputs and outcomes of maternity services. The performance indicator framework shows which data are complete and comparable in the 2015 Report.
In this tab
Public hospitals
An overview of the Public hospitals performance indicator results are presented. Information to assist the interpretation of these data can be found in the indicator interpretation boxes in the Public hospitals chapter and attachment tables.
Effectiveness — Access indicators
Emergency department waiting times, 2013-14
Most recent data for this measure are complete but not directly comparable (chapter 11).
| NSW | Vic | Qld | WA | SA | Tas | ACT | NT | Aust | |
|---|---|---|---|---|---|---|---|---|---|
| Resuscitation | 100 | 100 | 100 | 100 | 100 | 100 | 100 | 100 | 100 |
| Emergency | 83 | 84 | 80 | 86 | 74 | 85 | 83 | 61 | 82 |
| Urgent | 76 | 73 | 67 | 58 | 65 | 66 | 50 | 51 | 70 |
| Semi-urgent | 80 | 71 | 75 | 71 | 77 | 71 | 57 | 53 | 75 |
| Non-urgent | 94 | 88 | 92 | 94 | 92 | 90 | 86 | 89 | 92 |
| Total | 81 | 75 | 73 | 70 | 73 | 72 | 61 | 57 | 75 |
| NSW | Vic | Qld | WA | SA | Tas | ACT | NT | Aust | |
|---|---|---|---|---|---|---|---|---|---|
| % | 73.9 | 69.0 | 76.3 | 79.5 | 64.5 | 67.7 | 61.8 | 61.6 | 72.7 |
Waiting times for admitted patient services
Most recent data for this measure are complete but not directly comparable (chapter 11).
| NSW | Vic | Qld | WA | SA | Tas | ACT | NT | Aust | |
|---|---|---|---|---|---|---|---|---|---|
| 50th percentile | 49 | 35 | 28 | 29 | 35 | 45 | 48 | 36 | 36 |
| 90th percentile | 329 | 222 | 186 | 142 | 180 | 401 | 270 | 183 | 262 |
| NSW | Vic | Qld | WA | SA | Tas | ACT | NT | Aust | |
|---|---|---|---|---|---|---|---|---|---|
| % | 1.8 | 3.2 | 2.8 | 0.7 | 0.8 | 11.5 | 4.7 | 2.8 | 2.4 |
| NSW | Vic | Qld | WA | SA | Tas | ACT | NT | Aust | |
|---|---|---|---|---|---|---|---|---|---|
| Resuscitation | 51 | 57 | 59 | 66 | 54 | 58 | 63 | 46 | 56 |
| Emergency | 43 | 49 | 53 | 58 | 37 | 33 | 45 | 21 | 47 |
| Urgent | 40 | 44 | 51 | 51 | 35 | 25 | 29 | 21 | 43 |
| Semi-urgent | 44 | 45 | 57 | 52 | 42 | 28 | 33 | 22 | 46 |
| Non-urgent | 65 | 60 | 68 | 60 | 59 | 44 | 45 | 50 | 62 |
| Total | 42 | 46 | 53 | 53 | 38 | 28 | 34 | 22 | 45 |
Effectiveness — Appropriateness indicators
Separation rates for selected procedures
Most recent data for this indicator are complete and comparable (chapter 11).
| NSW | Vic | Qld | WA | SA | Tas | ACT | NT | Aust | |
|---|---|---|---|---|---|---|---|---|---|
| Cataract extraction | 2.7 | 3.0 | 1.6 | 4.7 | 3.4 | 2.0 | 4.1 | 6.7 | 2.8 |
| Cholecystectomy | 1.4 | 1.5 | 1.2 | 1.2 | 1.5 | 1.4 | 1.4 | 1.2 | 1.4 |
| Coronary angioplasty | 0.9 | 0.8 | 0.8 | 0.8 | 0.9 | 1.0 | 2.0 | .. | 0.9 |
| Coronary artery bypass graft | 0.3 | 0.3 | 0.3 | 0.2 | 0.3 | 0.3 | 0.5 | .. | 0.3 |
| Cystoscopy | 1.6 | 2.9 | 2.0 | 3.3 | 2.7 | 1.6 | 3.0 | 2.0 | 2.3 |
| Haemorrhoidectomy | 1.0 | 0.8 | 0.3 | 0.5 | 0.5 | 0.6 | 0.3 | 0.9 | 0.7 |
| Hip replacement | 0.6 | 0.7 | 0.5 | 0.8 | 0.7 | 0.7 | 1.0 | 0.6 | 0.6 |
| Hysterectomy | 1.0 | 1.1 | 1.0 | 1.0 | 1.2 | 1.2 | 0.9 | 0.8 | 1.0 |
| Inguinal herniorrhaphy | 1.0 | 1.0 | 0.8 | 1.0 | 1.0 | 1.0 | 1.0 | 1.0 | 1.0 |
| Knee replacement | 0.7 | 0.5 | 0.5 | 0.7 | 0.6 | 0.4 | 0.7 | 0.5 | 0.6 |
| Myringotomy | 0.5 | 0.7 | 0.6 | 0.8 | 1.4 | 0.5 | 0.5 | 0.6 | 0.7 |
| Prostatectomy | 0.9 | 1.0 | 0.7 | 0.9 | 1.0 | 0.8 | 1.1 | 0.5 | 0.9 |
| Septoplasty | 0.3 | 0.4 | 0.2 | 0.2 | 0.5 | 0.1 | 0.3 | 0.2 | 0.3 |
| Tonsillectomy | 0.9 | 1.3 | 0.8 | 0.9 | 1.5 | 0.7 | 0.8 | 1.0 | 1.0 |
| Varicose veins, stripping and ligation | 0.2 | 0.3 | 0.1 | 0.1 | 0.3 | <0.1 | 0.5 | 0.2 | 0.2 |
Source: Attachment table 11A.48.
Effectiveness — Quality — Safety indicators
Unplanned hospital readmission rates
Most recent data for this indicator are complete but not directly comparable (chapter 11).
| NSW | Vic | Qld | WA | SA | Tas | ACT | NT | Aust | |
|---|---|---|---|---|---|---|---|---|---|
| Knee replacement | 21.6 | 15.1 | 35.1 | 22.3 | 18.6 | 37.0 | – | np | 22.4 |
| Hip replacement | 18.0 | 16.1 | 16.1 | 15.9 | 19.3 | 29.6 | 12.9 | np | 17.5 |
| Tonsillectomy and adenoidectomy | 30.3 | 29.1 | 35.7 | 42.4 | 37.5 | 51.9 | 44.7 | 83.0 | 33.1 |
| Hysterectomy | 31.6 | 25.9 | 31.8 | 43.6 | 28.7 | 52.0 | 23.1 | np | 30.6 |
| Prostatectomy | 27.3 | 26.5 | 40.7 | 33.9 | 28.9 | 57.8 | np | np | 31.1 |
| Cataract surgery | 3.4 | 3.0 | 4.6 | 2.6 | 2.9 | 4.4 | 0.9 | 6.0 | 3.4 |
| Appendicectomy | 22.4 | 22.8 | 22.0 | 29.0 | 27.0 | 26.5 | 20.4 | 43.5 | 23.1 |
Source: Attachment tables 11A.50-11A.55.
Accreditation
Most recent data for this indicator are complete and comparable (chapter 11).
| NSW | Vic | Qld | WA | SA | Tas | ACT | NT | Aust | |
|---|---|---|---|---|---|---|---|---|---|
| % | 97 | 100 | 95 | 100 | 100 | 87 | 100 | 100 | 98 |
Adverse events in public hospitals
Most recent data for this measure are complete but not directly comparable (chapter 11).
| NSW | Vic | Qld | WA | SA | Tas | ACT | NT | Aust | |
|---|---|---|---|---|---|---|---|---|---|
| 0.9 | 0.8 | 0.9 | 0.9 | 0.6 | 0.9 | 0.8 | 1.0 | 0.9 |
Most recent data for this measure are complete and comparable (chapter 11).
| NSW | Vic | Qld | WA | SA | Tas | ACT | NT | Aust | |
|---|---|---|---|---|---|---|---|---|---|
| Total | 6.3 | 6.8 | 6.3 | 6.4 | 7.2 | 8.2 | 7.4 | 3.4 | 6.5 |
Most recent data for this measure are complete and comparable (chapter 11).
| NSW | Vic | Qld | WA | SA | Tas | ACT | NT | Aust | |
|---|---|---|---|---|---|---|---|---|---|
| 4.8 | 3.5 | 3.5 | 3.6 | 4.3 | 5.3 | 3.8 | 1.6 | 4.0 |
Efficiency — Sustainability indicators
Workforce sustainability
Most recent data for this indicator are complete and comparable (chapter 11) .
| NSW | Vic | Qld | WA | SA | Tas | ACT | NT | Aust | |
|---|---|---|---|---|---|---|---|---|---|
| <30 | 15.1 | 17.7 | 15.1 | 16.8 | 14.4 | 12.7 | 16.6 | 18.5 | 15.9 |
| 30-39 | 20.1 | 21.0 | 20.7 | 20.6 | 19.2 | 15.2 | 21.8 | 25.7 | 20.4 |
| 40-49 | 23.9 | 25.2 | 27.2 | 25.7 | 25.8 | 26.7 | 25.5 | 21.9 | 25.4 |
| 50-59 | 29.1 | 26.0 | 26.8 | 26.4 | 30.7 | 34.4 | 26.2 | 24.4 | 27.7 |
| 60+ | 11.7 | 10.1 | 10.3 | 10.5 | 9.9 | 11.0 | 9.8 | 9.5 | 10.6 |
| NSW | Vic | Qld | WA | SA | Tas | ACT | NT | Aust | |
|---|---|---|---|---|---|---|---|---|---|
| <30 | 8.8 | 10.6 | 9.8 | 12.1 | 10.2 | 9.8 | 9.7 | 11.0 | 10.0 |
| 30-39 | 26.3 | 28.4 | 28.9 | 28.3 | 26.6 | 24.0 | 27.3 | 36.5 | 27.6 |
| 40-49 | 24.0 | 23.5 | 25.8 | 25.5 | 25.4 | 25.9 | 25.5 | 23.2 | 24.6 |
| 50-59 | 21.1 | 20.9 | 20.9 | 19.7 | 20.5 | 23.7 | 21.4 | 17.5 | 20.9 |
| 60+ | 19.8 | 16.6 | 14.5 | 14.3 | 17.3 | 16.6 | 16.2 | 11.9 | 17.0 |
Efficiency indicators
Cost per casemix adjusted separation
Most recent data for this indicator are complete but not directly comparable (chapter 11).
| NSW | Vic | Qld | WA | SA | Tas | ACT | NT | Aust | |
|---|---|---|---|---|---|---|---|---|---|
| Total recurrent | 5280 | 4693 | 5246 | 5733 | 5251 | 6033 | 6384 | 6017 | 5204 |
| Capital | 475 | 804 | 424 | 542 | 395 | 427 | 556 | 693 | 493 |
Relative stay index
Most recent data for this indicator are complete and comparable (chapter 11).
| NSW | Vic | Qld | WA | SA | Tas | ACT | NT | Aust | |
|---|---|---|---|---|---|---|---|---|---|
| Total | 1.04 | 0.93 | 0.86 | 0.98 | 1.04 | 1.01 | 1.02 | 1.13 | 0.97 |
Recurrent cost per non-admitted occasion of service, 2012-13
Most recent data for this indicator not complete or not directly comparable (chapter 11). Data are available in tables 11A.65-11A.69.
Outcome indicators
Patient satisfaction, 2013-14
Most recent data for this indicator are complete and comparable (chapter 11).
Proportion (%) of persons who went to an emergency department in the last 12 months reporting:
| NSW | Vic | Qld | WA | SA | Tas | ACT | NT | Aust | |
|---|---|---|---|---|---|---|---|---|---|
| Doctors / specialists | 86.6 | 84.9 | 84.4 | 86.7 | 86.8 | 76.9 | 75.2 | 90.6 | 85.4 |
| Nurses | 90.2 | 89.7 | 90.4 | 87.0 | 90.3 | 85.3 | 81.7 | 90.6 | 89.1 |
| NSW | Vic | Qld | WA | SA | Tas | ACT | NT | Aust | |
|---|---|---|---|---|---|---|---|---|---|
| Doctors / specialists | 87.2 | 86.2 | 86.1 | 87.4 | 86.3 | 85.5 | 77.3 | 87.2 | 86.5 |
| Nurses | 90.7 | 90.1 | 91.7 | 88.7 | 90.4 | 87.6 | 85.1 | 92.0 | 90.2 |
| NSW | Vic | Qld | WA | SA | Tas | ACT | NT | Aust | |
|---|---|---|---|---|---|---|---|---|---|
| Doctors / specialists | 81.5 | 80.4 | 81.3 | 81.3 | 81.7 | 77.9 | 75.3 | 85.0 | 81.0 |
| Nurses | 85.9 | 86.0 | 86.7 | 85.5 | 84.9 | 79.7 | 82.5 | 94.2 | 85.8 |
Proportion (%) of persons who were admitted to hospital in the last 12 months reporting:
| NSW | Vic | Qld | WA | SA | Tas | ACT | NT | Aust | |
|---|---|---|---|---|---|---|---|---|---|
| Doctors / specialists | 91.3 | 90.5 | 88.4 | 90.0 | 93.6 | 88.5 | 83.9 | 91.0 | 90.6 |
| Nurses | 92.3 | 92.5 | 90.1 | 91.3 | 91.4 | 88.5 | 83.9 | 91.3 | 91.5 |
| NSW | Vic | Qld | WA | SA | Tas | ACT | NT | Aust | |
|---|---|---|---|---|---|---|---|---|---|
| Doctors / specialists | 92.7 | 93.0 | 90.3 | 91.2 | 96.0 | 89.5 | 84.8 | 91.8 | 92.4 |
| Nurses | 94.0 | 93.3 | 91.4 | 91.5 | 92.9 | 90.9 | 83.9 | 94.2 | 92.6 |
| NSW | Vic | Qld | WA | SA | Tas | ACT | NT | Aust | |
|---|---|---|---|---|---|---|---|---|---|
| Doctors / specialists | 87.7 | 88.4 | 86.1 | 86.9 | 92.3 | 84.7 | 79.1 | 92.3 | 87.7 |
| Nurses | 88.6 | 91.2 | 87.2 | 88.4 | 88.9 | 86.2 | 81.9 | 94.2 | 89.0 |
Sentinel events, 2012-13
Most recent data for this indicator are complete but not directly comparable (chapter 11). Data are available in tables 11A.89-11A.97.
Maternity services
An overview of the Maternity services performance indicator results are presented. Information to assist the interpretation of these data can be found in the indicator interpretation boxes in the Public hospitals chapter and attachment tables.
Effectiveness — Appropriateness indicators
Caesareans for selected primiparae
Most recent data for this indicator not complete or not directly comparable (chapter 11).
| NSW | Vic | Qld | WA | SA | Tas | ACT | NT | Aust | |
|---|---|---|---|---|---|---|---|---|---|
| % | 23.2 | 24.9 | 22.8 | 24.8 | 27.3 | na | 24.3 | 30.4 | 24.2 |
Inductions for selected primiparae
Most recent data for this indicator not complete or not directly comparable (chapter 11).
| NSW | Vic | Qld | WA | SA | Tas | ACT | NT | Aust | |
|---|---|---|---|---|---|---|---|---|---|
| % | 39.4 | 34.6 | 29.9 | 35.9 | 41.6 | na | 29.6 | 35.7 | 35.8 |
Source: Attachment tables 11A.102-11A.112.
Instrumental vaginal births
Most recent data for this indicator are complete and comparable (chapter 11).
| NSW | Vic | Qld | WA | SA | Tas | ACT | NT | Aust | |
|---|---|---|---|---|---|---|---|---|---|
| % | 22.7 | 28.2 | 21.7 | 30.2 | 24.5 | 26.1 | 27.4 | 18.7 | 11.9 |
Vaginal birth after caesarean section
Most recent data for this indicator are complete and comparable (chapter 11).
| NSW | Vic | Qld | WA | SA | Tas | ACT | NT | Aust | |
|---|---|---|---|---|---|---|---|---|---|
| Non-instrumental | 12.5 | 11.6 | 12.3 | 9.1 | 12.4 | 12.2 | 12.2 | 18.7 | 11.9 |
| Instrumental | 3.8 | 4.3 | 2.9 | 3.0 | 3.7 | 3.4 | 5.9 | 3.5 | 3.7 |
Effectiveness — Quality — Safety indicators
Perineal status after vaginal birth
Most recent data for this indicator are complete and comparable (chapter 11).
| NSW | Vic | Qld | WA | SA | Tas | ACT | NT | Aust | |
|---|---|---|---|---|---|---|---|---|---|
| % | 2.0 | 1.9 | 2.0 | 2.3 | 2.3 | 1.6 | 4.1 | 2.8 | 2.1 |
Efficiency indicators
Recurrent cost per maternity separation
Most recent data for this indicator are complete but not directly comparable (chapter 11).
| NSW | Vic | Qld | WA | SA | Tas | ACT | NT | Aust | |
|---|---|---|---|---|---|---|---|---|---|
| Caesarean | 8848 | 7889 | 9651 | 13 675 | 10 712 | 7746 | 12 936 | 15 333 | 9546 |
| Vaginal delivery | 4975 | 3634 | 4900 | 6499 | 4911 | 4050 | 5706 | 7503 | 4826 |
Mother's average length of stay
Most recent data for this indicator are complete and comparable (chapter 11).
| NSW | Vic | Qld | WA | SA | Tas | ACT | NT | Aust | |
|---|---|---|---|---|---|---|---|---|---|
| Caesarean | 3.8 | 3.7 | 3.3 | 3.7 | 4.0 | 3.8 | 3.8 | 4.4 | 3.7 |
| Vaginal delivery | 1.8 | 1.8 | 1.5 | 1.7 | 1.7 | 1.8 | 1.4 | 2.1 | 1.7 |
Outcome indicators
Baby's Apgar score at 5 minutes
Most recent data for this indicator are not complete and are not directly comparable (chapter 11).
| NSW | Vic | Qld | WA | SA | Tas | ACT | NT | Aust | |
|---|---|---|---|---|---|---|---|---|---|
| <1500g | 15.1 | 18.7 | 18.6 | 5.4 | 8.0 | na | 13.8 | 26.0 | na |
| 1500-1999g | 1.7 | 1.3 | 1.5 | 1.1 | 0.6 | na | 1.4 | np | na |
| 2000-2499g | 0.8 | 0.3 | 0.6 | 0.6 | 0.6 | na | 1.0 | np | na |
| 2500g+ | 0.3 | 0.2 | 0.2 | 0.2 | 0.1 | na | 0.3 | 0.4 | na |
Source: Attachment tables 11A.116-11A.121.
Perinatal death rate
Most recent data for this indicator are not complete but are comparable (chapter 11)
| NSW | Vic | Qld | WA | SA | Tas | ACT | NT | Aust | |
|---|---|---|---|---|---|---|---|---|---|
| Fetal deaths | 5.2 | 5.6 | 7.0 | 7.1 | 3.5 | 7.2 | 7.5 | 5.6 | 5.9 |
| Neonatal deaths | 2.3 | 2.1 | 3.0 | 1.4 | 2.4 | 2.9 | 2.6 | 3.9 | 2.3 |
| Perinatal deaths | 7.5 | 7.7 | 10.0 | 8.4 | 5.9 | 10.1 | 10.0 | 9.4 | 8.2 |