Report on Government Services 2015
Chapter 8, Volume C
Corrective services
The Corrective services chapter (chapter 8) of the Report on Government Services reports on prison custody and a range of community corrections orders and programs for adult offenders which are delivered separately by the eight States and Territories.
Download the chapter
- Chapter 8 Corrective services, attachment tables, and data quality information (PDF - 1739 Kb)
- Chapter 8 Attachment tables (XLSX - 1044 Kb)
- Key Facts
- Indicator Framework
- Indicator Results
In 2013-14, on average, 32 683 people per day were held in Australian prisons — an increase of 8.6 per cent from 2012-13. Nationally, 18.5 per cent of the total prisoner population (excluding periodic detainees) were held in privately operated facilities.
Males comprised 92.2 per cent of all prisoners in prison custody in Australia and 7.8 per cent were females. Aboriginal and Torres Strait Islander prisoners comprised 27.6 per cent of the total prisoner population.
Nationally, corrective services agencies operated 111 custodial facilities at 30 June 2014 — 85 government-operated prisons, nine privately operated prisons, four transitional centres, one periodic detention centre (ACT), and twelve 24-hour court-cell complexes (under the responsibility of corrective services in NSW).
Community corrections is responsible for a range of non-custodial sanctions and also manages prisoners who are released into the community and continue to be subject to corrective services supervision. In some jurisdictions, community corrections responsibility includes managing offenders on supervised bail orders.
Nationally, an average of 56 315 offenders per day were serving community corrections orders in 2013-14 — an increase of 3.1 per cent from 2012-13.
Males comprised 81.7 per cent of the daily number of offenders serving community corrections orders and 18.3 per cent were females. Aboriginal and Torres Strait Islander offenders comprised 20.5 per cent of the total offender population.
Nationally, net operating expenditure on corrective services including depreciation was $3.4 billion in 2013-14.
Corrective services contribute to the whole-of-government priority, in all jurisdictions, to create safer communities through the administration of correctional sentences and orders. In summary, the objectives of corrective services are to:
- provide a safe, secure and humane custodial environment
- provide an effective community corrections environment
- provide program interventions to reduce the risk of re-offending.
The performance indicator framework provides information on equity, efficiency and effectiveness, and distinguishes the outputs and outcomes of corrective services. The performance indicator framework shows which data are complete and comparable in the 2015 Report.
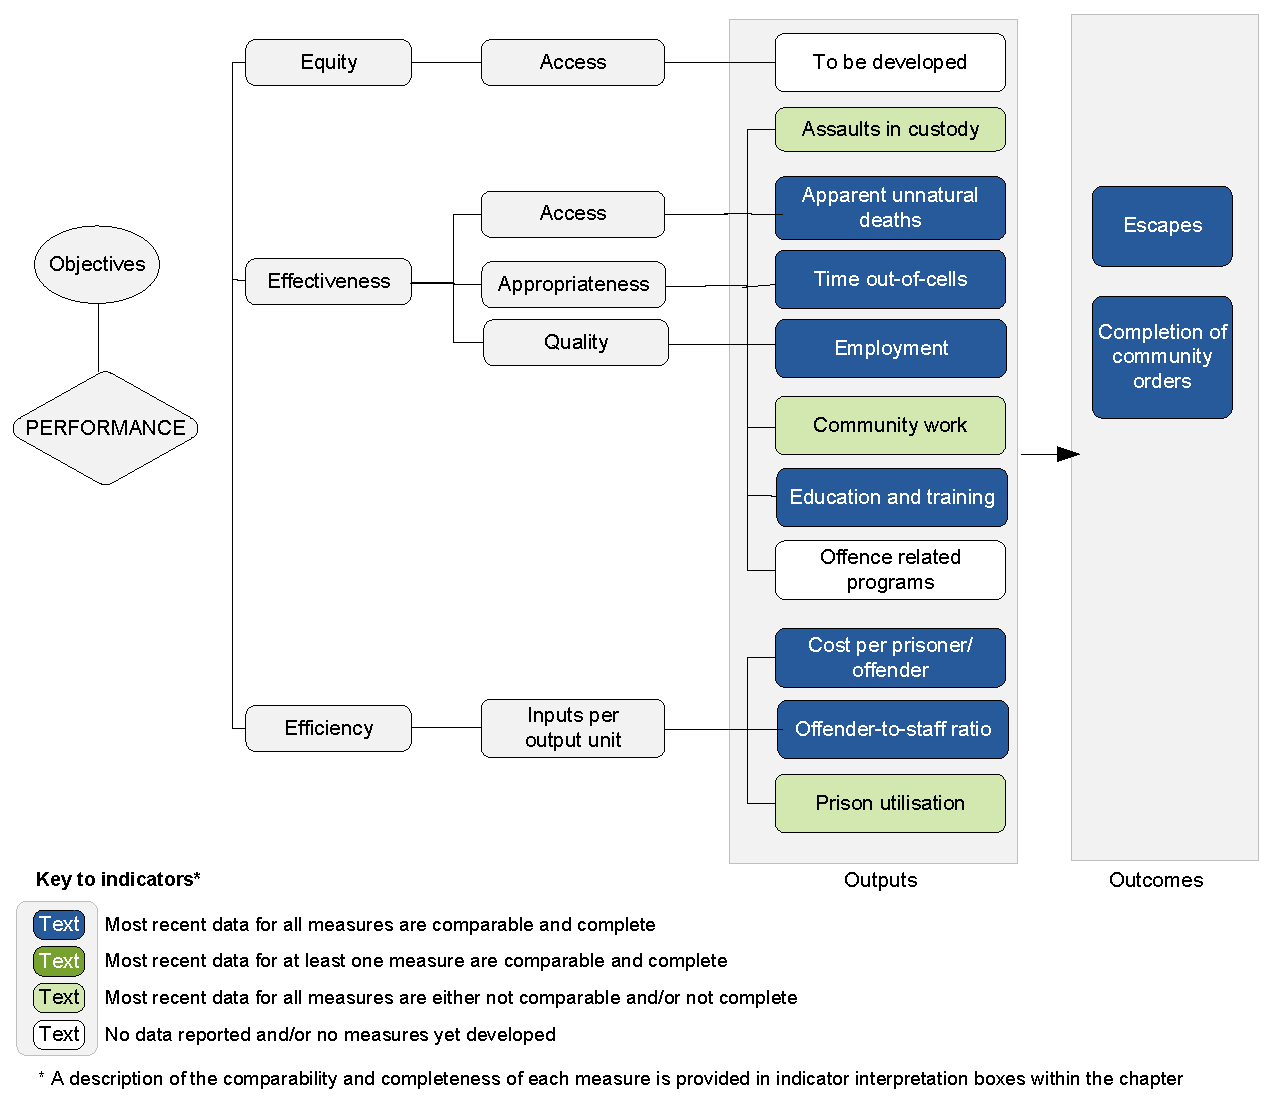
An overview of the Corrective services performance indicator results are presented. Information to assist the interpretation of these data can be found in the indicator interpretation boxes in the Corrective services chapter and attachment tables.
Effectiveness (access, appropriateness, quality) indicators
Assaults in custody
Data for this indicator not complete or not directly comparable (chapter 8).
| NSW | Vic | Qld | WA | SA | Tas | ACT | NT | Aust | |
|---|---|---|---|---|---|---|---|---|---|
| Serious assault | 0.36 | 1.26 | 1.54 | 0.30 | 0.62 | 0.64 | 2.41 | 0.20 | 0.79 |
| Assault | 14.20 | 11.86 | 5.20 | 7.46 | 9.46 | 5.08 | 5.43 | 2.86 | 9.81 |
| NSW | Vic | Qld | WA | SA | Tas | ACT | NT | Aust | |
|---|---|---|---|---|---|---|---|---|---|
| Serious assault | – | 0.05 | 0.06 | 0.18 | – | – | – | – | 0.05 |
| Assault | 0.55 | 1.98 | 0.34 | 1.91 | 0.42 | 0.64 | 0.60 | 0.20 | 0.95 |
Source: Attachment table 8A.14.
Apparent unnatural deaths
Data for this indicator comparable, subject to caveats (chapter 8).
| NSW | Vic | Qld | WA | SA | Tas | ACT | NT | Aust | |
|---|---|---|---|---|---|---|---|---|---|
| Aboriginal and Torres Strait Islander | – | – | – | – | – | – | – | – | – |
| Non-Indigenous | 0.05 | – | 0.04 | 0.10 | 0.11 | – | 0.38 | 0.49 | 0.06 |
| All prisoners | 0.04 | – | 0.03 | 0.06 | 0.08 | – | 0.30 | 0.07 | 0.04 |
Source: Attachment table 8A.15.
| NSW | Vic | Qld | WA | SA | Tas | ACT | NT | Aust | |
|---|---|---|---|---|---|---|---|---|---|
| Aboriginal and Torres Strait Islander | – | – | – | – | – | – | – | – | – |
| Non-Indigenous | 4 | – | 2 | 3 | 2 | – | 1 | 1 | 13 |
| All prisoners | 4 | – | 2 | 3 | 2 | – | 1 | 1 | 13 |
Source: Attachment table 8A.15.
Time out of cells
Data for this indicator comparable, subject to caveats (chapter 8).
| NSW | Vic | Qld | WA | SA | Tas | ACT | NT | Aust | |
|---|---|---|---|---|---|---|---|---|---|
| Hours | 8.2 | 11.1 | 10.2 | 12.6 | 9.6 | 9.0 | 8.9 | 13.0 | 10.1 |
Employment
Data for this indicator comparable, subject to caveats (chapter 8).
| NSW | Vic | Qld | WA | SA | Tas | ACT | NT | Aust | |
|---|---|---|---|---|---|---|---|---|---|
| % | 79.7 | 88.1 | 69.2 | 74.4 | 72.8 | 67.0 | 69.5 | 75.2 | 77.1 |
Community work
Data for this indicator comparable but not complete, subject to caveats (chapter 8).
| NSW | Vic | Qld | WA | SA | Tas | ACT | NT | Aust | |
|---|---|---|---|---|---|---|---|---|---|
| Ratio | na | 2.9 | 2.1 | 1.9 | 3.9 | na | 1.9 | 1.8 | na |
Source: Attachment table 8A.20.
Education and training
Data for this indicator comparable, subject to caveats (chapter 8).
| NSW | Vic | Qld | WA | SA | Tas | ACT | NT | Aust | |
|---|---|---|---|---|---|---|---|---|---|
| % | 35.1 | 33.4 | 26.4 | 29.1 | 59.4 | 13.1 | 82.7 | 12.8 | 32.7 |
Efficiency indicators
Cost per prisoner/offender
Data for this indicator comparable, subject to caveats (chapter 8).
| NSW | Vic | Qld | WA | SA | Tas | ACT | NT | Aust | |
|---|---|---|---|---|---|---|---|---|---|
| Prisoner | 181.6 | 269.6 | 180.3 | 283.4 | 208.2 | 332.4 | 259.3 | 211.0 | 218.9 |
| Offender | 22.7 | 27.0 | 13.2 | 42.9 | 17.1 | 11.8 | 18.1 | 39.5 | 21.6 |
Offender-to-staff ratio
Data for this indicator comparable, subject to caveats (chapter 8).
| NSW | Vic | Qld | WA | SA | Tas | ACT | NT | Aust | |
|---|---|---|---|---|---|---|---|---|---|
| Ratio | 16.7 | 13.3 | 23.8 | 9.5 | 18.8 | 25.5 | 20.0 | 10.6 | 16.7 |
Prison utilisation
Data for this indicator comparable but not complete, subject to caveats (chapter 8).
| NSW | Vic | Qld | WA | SA | Tas | ACT | NT | Aust | |
|---|---|---|---|---|---|---|---|---|---|
| % | 109.4 | na | 98.0 | 101.1 | na | 77.1 | 122.7 | 124.7 | 104.4 |
Source: Attachment table 8A.23.
Outcome indicators
Escapes
Data for this indicator comparable, subject to caveats (chapter 8).
| NSW | Vic | Qld | WA | SA | Tas | ACT | NT | Aust | |
|---|---|---|---|---|---|---|---|---|---|
| Open (rate) | 0.31 | 0.77 | 0.31 | 0.10 | – | – | – | 0.78 | 0.36 |
| Secure (rate) | 0.02 | – | – | 0.22 | 0.05 | – | – | 0.20 | 0.05 |
| Open (no.) | 12 | 7 | 2 | 1 | – | – | – | 4 | 26 |
| Secure (no.) | 1 | – | – | 9 | 1 | – | – | 2 | 13 |
Source: Table 8.3 and attachment table 8A.17.
Completion of community orders
Data for this indicator comparable, subject to caveats (chapter 8).
| NSW | Vic | Qld | WA | SA | Tas | ACT | NT | Aust | |
|---|---|---|---|---|---|---|---|---|---|
| % | 74.0 | 66.4 | 77.3 | 60.0 | 70.1 | 87.1 | 77.0 | 69.2 | 72.8 |