Report on Government Services 2015
Chapter 7, Volume C
Courts
The focus of the Courts chapter (chapter 7) of the Report on Government Services is the court administration functions of Australian and State and Territory courts.
Data are reported for the Federal Court, the Family Court of Australia and the Federal Circuit Court, the criminal and civil jurisdictions of the supreme courts (including probate registries), district/county courts, magistrates' courts (including children's courts), coroners' courts and the Family Court of WA.
Download the chapter
- Chapter 7 Courts, attachment tables, and data quality information (PDF - 2844 Kb)
- Chapter 7 Attachment tables (XLSX - 958 Kb)
- Key Facts
- Indicator Framework
- Indicator Results
In 2013-14, in the criminal jurisdiction of the supreme, district/county and magistrates' courts, approximately 843 100 cases were lodged, and 854 100 cases were finalised. In the civil jurisdiction of these same courts there were approximately 458 200 cases lodged and 477 200 cases finalised. In the Australian courts, approximately 117 000 cases were lodged, and approximately 114 300 cases finalised.
Total court administration recurrent expenditure less income (excluding fines) by the court authorities covered in this chapter was approximately $1.33 billion in 2013-14, comprising $1.1 billion for the State and Territory courts and $228.2 million for the Australian courts.
Common objectives for court services across Australia are: to be open and accessible; to process matters in an expeditious and timely manner; to provide due process and equal protection before the law; and to be independent yet publicly accountable for performance.
The performance indicator framework provides information on equity, efficiency and effectiveness, and distinguishes the outputs and outcomes of courts. The performance indicator framework shows which data are complete and comparable in the 2015 Report.
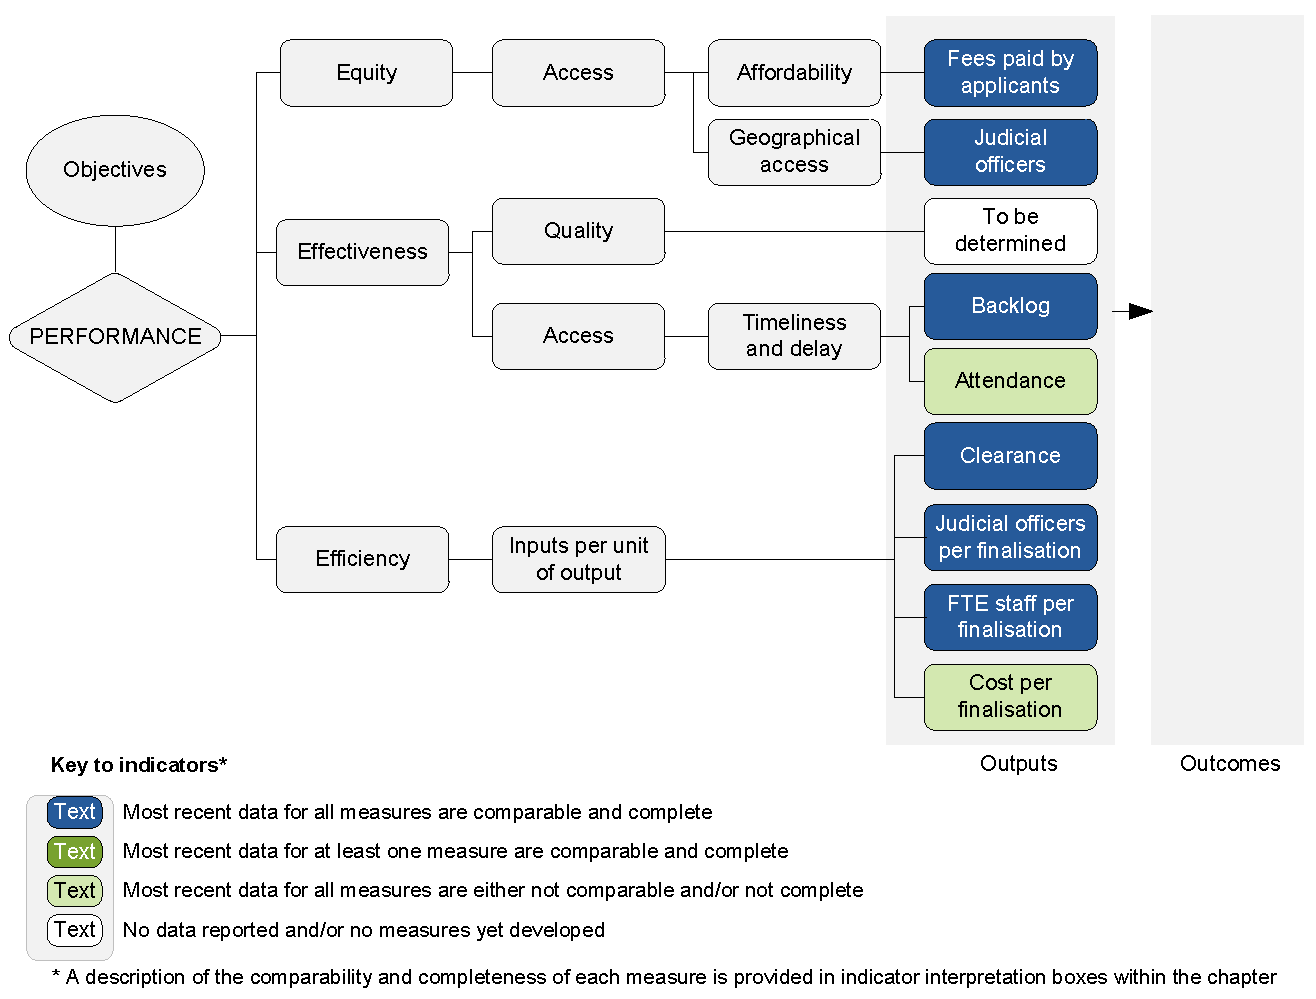
An overview of the Courts performance indicator results are presented. Information to assist the interpretation of these data can be found in the indicator interpretation boxes in the Courts chapter and attachment tables.
Equity (access) indicators
Fees paid by applicants
Data for this indicator comparable, subject to caveats (chapter 7).
| NSW | Vic | Qld | WA | SA | Tas | ACT | NT | Aus Gov | Aust | |
|---|---|---|---|---|---|---|---|---|---|---|
| Supreme / Federal (excl. probate) | 2981 | 1637 | 1911 | 2134 | 3064 | 703 | 2575 | 1762 | 3726 | 2512 |
| District / County | 1660 | 1811 | 950 | 974 | 1012 | .. | .. | .. | .. | 1374 |
| Magistrates | 149 | 218 | 123 | 118 | 117 | 78 | 197 | 59 | .. | 154 |
| Family courts | .. | .. | .. | 377 | .. | .. | .. | .. | 213 | 283 |
| Fed Circuit Court | .. | .. | .. | .. | .. | .. | .. | .. | 549 | 549 |
Legend: .. Not applicable
Source: Attachment table 7A.18.
Judicial officers
Data for this indicator comparable, subject to caveats (chapter 7).
| NSW | Vic | Qld | WA | SA | Tas | ACT | NT | Aus Gov | Aust | |
|---|---|---|---|---|---|---|---|---|---|---|
| Total number | 264.2 | 245.3 | 152.2 | 123.6 | 72.0 | 20.8 | 13.0 | 24.4 | 159.2 | 1074.7 |
| Number per 100 000 people | 3.5 | 4.2 | 3.2 | 4.8 | 4.3 | 4.0 | 3.4 | 10.1 | 0.7 | 4.6 |
Source: Attachment table 7A.27.
Effectiveness (access) indicator
Backlog
Data for this indicator comparable, subject to caveats (chapter 7).
Criminal matters
| NSW | Vic | Qld | WA | SA | Tas | ACT | NT | Aus Gov | Aust | |
|---|---|---|---|---|---|---|---|---|---|---|
| >12 months | 3.3 | 7.4 | 7.2 | 5.2 | 8.6 | 5.9 | 3.7 | 9.1 | .. | .. |
| >24 months | 0.8 | 0.8 | 0.5 | – | 1.0 | – | – | – | .. | .. |
Legend: .. Not applicable; – Nil or rounded to zero
Source: Attachment tables 7A.19 and 7A.21.
| NSW | Vic | Qld | WA | SA | Tas | ACT | NT | Aus Gov | Aust | |
|---|---|---|---|---|---|---|---|---|---|---|
| >12 months | 19.3 | 17.3 | 13.1 | 6.8 | 19.6 | 26.4 | 17.6 | 2.8 | .. | .. |
| >24 months | 2.9 | 3.2 | 4.8 | 1.1 | 4.1 | 6.0 | 6.3 | – | .. | .. |
Legend: .. Not applicable; – Nil or rounded to zero
Source: Attachment tables 7A.19 and 7A.21.
| NSW | Vic | Qld | WA | SA | Tas | ACT | NT | Aus Gov | Aust | |
|---|---|---|---|---|---|---|---|---|---|---|
| >6 months | 11.7 | 25.4 | 29.8 | 26.9 | 25.0 | 26.9 | 24.5 | 29.1 | .. | .. |
| >12 months | 1.7 | 7.8 | 12.2 | 8.3 | 9.0 | 11.8 | 6.7 | 11.0 | .. | .. |
Legend: .. Not applicable
Source: Attachment tables 7A.19 and 7A.21.
| NSW | Vic | Qld | WA | SA | Tas | ACT | NT | Aus Gov | Aust | |
|---|---|---|---|---|---|---|---|---|---|---|
| >6 months | 14.5 | 13.0 | 25.5 | 19.1 | 16.9 | 22.1 | 25.8 | 25.9 | .. | .. |
| >12 months | 1.6 | 4.5 | 9.4 | 6.9 | 4.9 | 10.4 | 12.1 | 10.5 | .. | .. |
Legend: .. Not applicable
Source: Attachment tables 7A.19 and 7A.21.
Civil matters
| NSW | Vic | Qld | WA | SA | Tas | ACT | NT | Aus Gov | Aust | |
|---|---|---|---|---|---|---|---|---|---|---|
| >12 months | 16.5 | 12.4 | 4.6 | 14.8 | 9.5 | 18.0 | 43.0 | 5.4 | 0.6 | .. |
| >24 months | 3.8 | 2.7 | 2.0 | 1.6 | – | 6.0 | 15.1 | – | 0.6 | .. |
Legend: .. Not applicable; – Nil or rounded to zero
Source: Attachment tables 7A.19 and 7A.21.
| NSW | Vic | Qld | WA | SA | Tas | ACT | NT | Aus Gov | Aust | |
|---|---|---|---|---|---|---|---|---|---|---|
| >12 months | 25.6 | 29.6 | 22.8 | 38.2 | 48.9 | 31.6 | 34.0 | 29.9 | 28.8 | .. |
| >24 months | 8.4 | 13.9 | 5.4 | 14.3 | 21.2 | 9.0 | 11.1 | 13.8 | 19.0 | .. |
Legend: .. Not applicable
Source: Attachment tables 7A.19 and 7A.21.
| NSW | Vic | Qld | WA | SA | Tas | ACT | NT | Aus Gov | Aust | |
|---|---|---|---|---|---|---|---|---|---|---|
| >6 months | 24.5 | 35.6 | 42.1 | 41.9 | 45.3 | 42.7 | 40.7 | 35.6 | .. | .. |
| >12 months | 0.5 | 20.6 | 7.3 | 8.0 | 15.7 | 11.1 | 14.5 | 5.8 | .. | .. |
Legend: .. Not applicable
Source: Attachment tables 7A.19 and 7A.21..
| NSW | Vic | Qld | WA | SA | Tas | ACT | NT | Aus Gov | Aust | |
|---|---|---|---|---|---|---|---|---|---|---|
| >12 months | .. | .. | .. | 29.2 | .. | .. | .. | .. | 38.4 | .. |
| >24 months | .. | .. | .. | 8.3 | .. | .. | .. | .. | 13.1 | .. |
Legend: .. Not applicable
Source: Attachment tables 7A.19 and 7A.21.
| NSW | Vic | Qld | WA | SA | Tas | ACT | NT | Aus Gov | Aust | |
|---|---|---|---|---|---|---|---|---|---|---|
| >12 months | .. | .. | .. | 31.9 | .. | .. | .. | .. | 25.5 | .. |
| >24 months | .. | .. | .. | 14.1 | .. | .. | .. | .. | 10.7 | .. |
Legend: .. Not applicable
Source: Attachment tables 7A.19 and 7A.21.
| NSW | Vic | Qld | WA | SA | Tas | ACT | NT | Aus Gov | Aust | |
|---|---|---|---|---|---|---|---|---|---|---|
| >6 months | .. | .. | .. | .. | .. | .. | .. | .. | 34.1 | .. |
| >12 months | .. | .. | .. | .. | .. | .. | .. | .. | 14.0 | .. |
Legend: .. Not applicable
Source: Attachment tables 7A.19 and 7A.21.
| NSW | Vic | Qld | WA | SA | Tas | ACT | NT | Aus Gov | Aust | |
|---|---|---|---|---|---|---|---|---|---|---|
| >12 months | 35.5 | 32.5 | 27.9 | 22.0 | 25.3 | 36.4 | 35.3 | 29.2 | .. | .. |
| >24 months | 24.6 | 15.3 | 11.9 | 10.0 | 11.1 | 13.1 | 18.0 | 19.7 | .. | .. |
Legend: .. Not applicable
Source: Attachment tables 7A.19 and 7A.21.
Attendance
Data for this indicator not complete or not directly comparable (chapter 7).
Criminal
| NSW | Vic | Qld | WA | SA | Tas | ACT | NT | Aus Gov | Aust | |
|---|---|---|---|---|---|---|---|---|---|---|
| Supreme | na | 3.7 | 3.5 | 2.5 | 3.7 | 6.0 | 8.6 | 6.1 | .. | .. |
| District / County | 3.1 | 4.7 | 4.3 | 3.6 | 6.0 | .. | .. | .. | .. | .. |
| Magistrates | 2.6 | 2.0 | 2.4 | 2.4 | 3.7 | 4.0 | 3.3 | 3.1 | .. | .. |
| Children's | 3.9 | 2.1 | 2.8 | 3.8 | 4.2 | 5.8 | 6.8 | 4.3 | .. | .. |
Legend: na Not available; .. Not applicable
Source: Attachment table 7A.22.
Civil
| NSW | Vic | Qld | WA | SA | Tas | ACT | NT | Aus Gov | Aust | |
|---|---|---|---|---|---|---|---|---|---|---|
| Supreme (excl. probate) / Federal | na | 1.7 | 1.5 | 2.4 | 3.9 | 1.9 | 7.2 | 4.4 | 3.0 | .. |
| District / Country | 3.4 | 0.9 | 0.6 | 1.3 | 3.5 | .. | .. | .. | .. | .. |
| Magistrates | 0.8 | 0.9 | 0.9 | 0.8 | 0.9 | 1.0 | 1.6 | 1.1 | .. | .. |
| Children's |
na |
1.7 | 3.7 | 3.6 | 2.5 | 5.9 | 7.3 | 3.1 | .. | .. |
| Family | .. | .. | .. | 2.4 | .. | .. | .. | .. | 2.2 | .. |
| Federal Circuit | .. | .. | .. | .. | .. | .. | .. | .. | 2.0 | .. |
| Coroners' | 3.8 | 1.0 | 3.3 | 1.4 | 1.5 | 1.0 | 8.5 | 1.0 | .. | .. |
Legend: na Not available; .. Not applicable
Source: Attachment table 7A.22.
Efficiency indicators
Clearance
Data for this indicator comparable, subject to caveats (chapter 7).
Criminal
| NSW | Vic | Qld | WA | SA | Tas | ACT | NT | Aus Gov | Aust | |
|---|---|---|---|---|---|---|---|---|---|---|
| Supreme (appeal) | 86.5 | 100.6 | 101.4 | 108.0 | 87.5 | 81.8 | 79.0 | 147.4 | .. | .. |
| Supreme (non-appeal) | 103.4 | 104.4 | 89.8 | 81.2 | 104.6 | 88.8 | 106.6 | 79.7 | .. | .. |
| District / County (appeal) | 99.8 | 103.4 | 87.4 | .. | .. | .. | .. | .. | .. | .. |
| District / County (non-appeal) | 94.9 | 99.5 | 96.8 | 87.8 | 101.3 | .. | .. | .. | .. | .. |
| Magistrates | 100.4 | 108.7 | 95.4 | 98.4 | 105.8 | 94.3 | 97.5 | 95.1 | .. | .. |
| Children's | 101.9 | 106.7 | 101.3 | 100.0 | 105.2 | 97.6 | 105.0 | 90.9 | .. | .. |
Legend: .. Not applicable
Source: Attachment tables 7A.24 and 7A.26.
Civil
| NSW | Vic | Qld | WA | SA | Tas | ACT | NT | Aus Gov | Aust | |
|---|---|---|---|---|---|---|---|---|---|---|
| Supreme / Federal (appeal) | 112.9 | 104.7 | 104.2 | 107.5 | 110.3 | 101.1 | 59.7 | 83.2 | 96.0 | .. |
| Supreme (excl probate) / Federal (non-appeal) | 115.6 | 101.9 | 111.9 | 96.3 | 107.1 | 116.5 | 111.4 | 106.5 | 114.7 | .. |
| District / County (appeal) | 99.5 | 79.4 | 83.8 | 84.7 | 113.2 | .. | .. | .. | .. | .. |
| District / County (non-appeal) | 103.9 | 101.3 | 95.7 | 98.1 | 152.1 | .. | .. | .. | .. | .. |
| Magistrates | 103.3 | 111.3 | 97.9 | 101.1 | 101.4 | 108.9 | 99.7 | 124.0 | .. | .. |
| Children's | 99.0 | 87.0 | 103.1 | 100.7 | 102.5 | 97.5 | 97.5 | 106.1 | .. | .. |
| Family (appeal) | .. | .. | .. | 114.3 | .. | .. | .. | .. | 105.8 | .. |
| Family (non-appeal) | .. | .. | .. | 103.9 | .. | .. | .. | .. | 98.4 | .. |
| Federal Circuit | .. | .. | .. | .. | .. | .. | .. | .. | 96.7 | .. |
| Coroners' | 108.8 | 116.0 | 104.8 | 101.3 | 90.9 | 92.3 | 105.0 | 116.8 | .. | .. |
Legend: .. Not applicable
Source: Attachment tables 7A.24 and 7A.26.
Judicial officers per finalisation
Data for this indicator comparable, subject to caveats (chapter 7).
| NSW | Vic | Qld | WA | SA | Tas | ACT | NT | Aus Gov | Aust | |
|---|---|---|---|---|---|---|---|---|---|---|
| Supreme (excl. probate) / Federal | 0.57 | 0.74 | 0.48 | 0.98 | 0.85 | 0.46 | 0.53 | 1.28 | 1.09 | 0.72 |
| District / County | 0.35 | 0.52 | 0.32 | 0.41 | 0.36 | .. | .. | .. | .. | 0.39 |
| Magistrates | 0.04 | 0.03 | 0.03 | 0.03 | 0.04 | 0.05 | 0.06 | 0.06 | .. | 0.04 |
| Children's | 0.12 | 0.05 | 0.04 | 0.05 | 0.07 | 0.11 | 0.10 | 0.06 | .. | 0.07 |
| Family | .. | .. | .. | 0.09 | .. | .. | .. | .. | 0.17 | 0.13 |
| Federal Circuit | .. | .. | .. | .. | .. | .. | .. | .. | 0.07 | 0.07 |
| Coroners' | 0.08 | 0.13 | 0.14 | 0.16 | 0.10 | 0.07 | 0.07 | 0.44 | .. | 0.12 |
| Total | 0.07 | 0.06 | 0.05 | 0.08 | 0.07 | 0.08 | 0.10 | 0.09 | 0.14 | 0.08 |
Legend: .. Not applicable
Source: Attachment table 7A.28.
Full time equivalent (FTE) staff per finalisation
Data for this indicator comparable, subject to caveats (chapter 7).
| NSW | Vic | Qld | WA | SA | Tas | ACT | NT | Aus Gov | Aust | |
|---|---|---|---|---|---|---|---|---|---|---|
| Criminal courts | 0.6 | 0.3 | 0.3 | 0.6 | 0.6 | 0.5 | 0.8 | 0.4 | .. | 0.4 |
| Civil courts | 0.6 | 0.5 | 0.4 | 0.4 | 0.5 | 0.4 | 1.1 | 0.7 | 5.6 | 0.6 |
| Family courts | .. | .. | .. | 0.9 | .. | .. | .. | .. | 1.3 | 1.1 |
| Federal Circuit | .. | .. | .. | .. | .. | .. | .. | .. | 0.6 | 0.6 |
| Coroners courts | 0.7 | 1.1 | 1.1 | 1.4 | 1.0 | 0.4 | 0.6 | 1.1 | .. | 1.0 |
| Total | 0.6 | 0.4 | 0.4 | 0.5 | 0.6 | 0.5 | 0.9 | 0.5 | 1.0 | 0.5 |
Legend: .. Not applicable
Source: Attachment table 7A.29.
Cost per finalisation
Data for this indicator not complete or not directly comparable (chapter 7).
Criminal
| NSW | Vic | Qld | WA | SA | Tas | ACT | NT | Aus Gov | Aust | |
|---|---|---|---|---|---|---|---|---|---|---|
| Supreme | 41 866 | 48 870 | 12 398 | 21 172 | 26 757 | 18 499 | 19 719 | 24 299 | .. | 23 896 |
| District / County | 6247 | 13 171 | 7747 | 19 905 | 8835 | .. | .. | .. | .. | 9195 |
| Magistrates | 648 | 356 | 408 | 892 | 544 | 631 | 997 | 798 | .. | 520 |
| Children's | 687 | 166 | 612 | 942 | 722 | 856 | 2949 | 838 | .. | 536 |
Legend: .. Not applicable
Source: Attachment tables 7A.31 and 7A.32.
Civil
| NSW | Vic | Qld | WA | SA | Tas | ACT | NT | Aus Gov | Aust | |
|---|---|---|---|---|---|---|---|---|---|---|
| Supreme (excl. probate) / Federal | 4492 | 5179 | 3710 | 8867 | 4446 | 3227 | 4948 | 21 421 | 14 174 | 6643 |
| District / County | 2867 | 2892 | 900 | 2362 | 1531 | .. | .. | .. | .. | 2252 |
| Magistrates | 269 | 156 | 241 | 203 | 255 | 141 | 1258 | 686 | .. | 241 |
| Children's | 720 | 2320 | 1248 | 595 | 703 | 1989 | 3331 | 875 | .. | 1241 |
| Family courts | .. | .. | .. | 1395 | .. | .. | .. | .. | 3188 | .. |
| Federal Circuit | .. | .. | .. | .. | .. | .. | .. | .. | 966 | 966 |
| Coroners | 869 | 1746 | 1812 | 2614 | 1564 | 763 | 1332 | 2915 | .. | 1569 |
Legend: .. Not applicable
Source: Attachment tables 7A.31 and 7A.32.