Target 2
By 2031, increase the proportion of Aboriginal and Torres Strait Islander babies with a healthy birthweight to 91%.
Nationally in 2021, 89.6% of Aboriginal and Torres Strait Islander babies born were of a healthy birthweight (figure CtG2.1).
This is an increase from 88.8% in 2017 (the baseline year). The proportion increased each year between 2017 and 2020, decreased in 2020, but increased again in 2021 (figure CtG2.1).
Nationally, based on progress from the baseline, the target shows good improvement and is on track to be met. This assessment is provided with a low level of confidence. Please refer to the How to interpret the data page for more information.
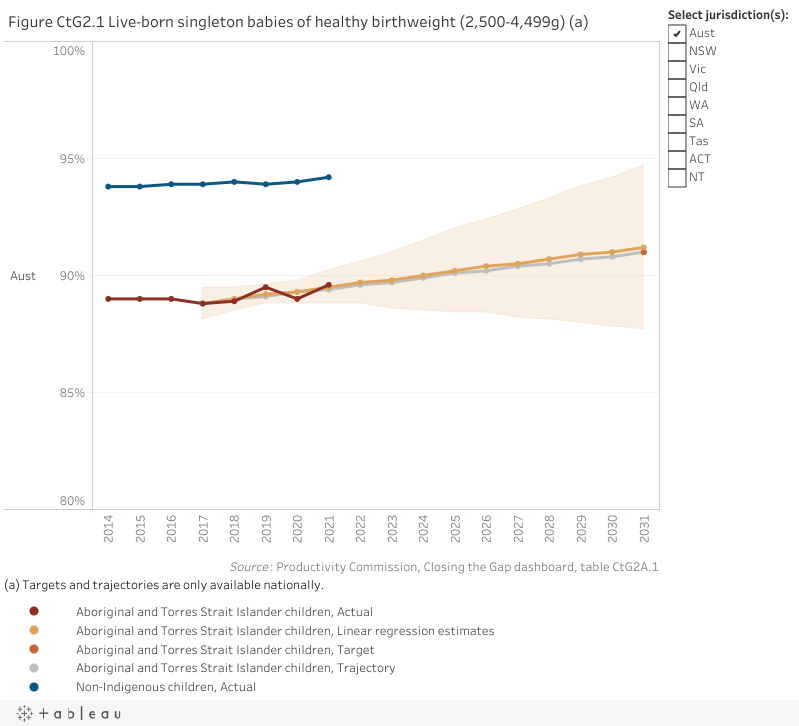
The assessment below reflects progress from the baseline (improvement, worsening or no change). For the national assessment, the target outcome shows good improvement and is on track to be met.
| NSW | Vic | Qld | WA | SA | Tas | ACT | NT | Aust | |
|---|---|---|---|---|---|---|---|---|---|
| Assessment of progress 2017 to 2021 |  |  | | | | | |  |  |
| Confidence level | Low | High | High | High | Low | Low | High | Low | Low |
improvement no change worsening not applicable as required data not available. good improvement and target on track to be met.  improvement but target not on track to be met.
Note: These assessments of progress are provided with a 'High' or 'Low' level of confidence. An assessment reported with a High level of confidence is considered to be more reliable than one reported with a Low level of confidence. Please see the 'How to interpret the data' page for more information.
Disaggregations
Data tables appear under figures
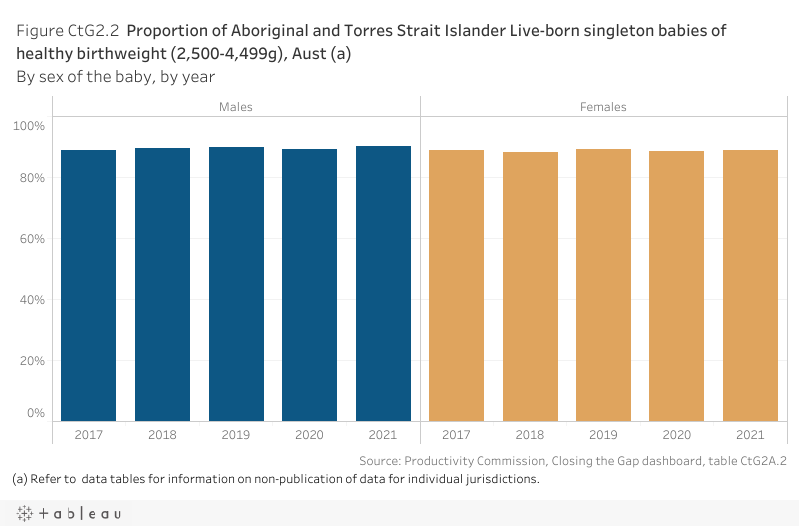
By sex of the baby
Nationally in 2021, 90.1% of Aboriginal and Torres Strait Islander boys born and 89.0% of girls born were of a healthy birthweight (figure CtG2.2).
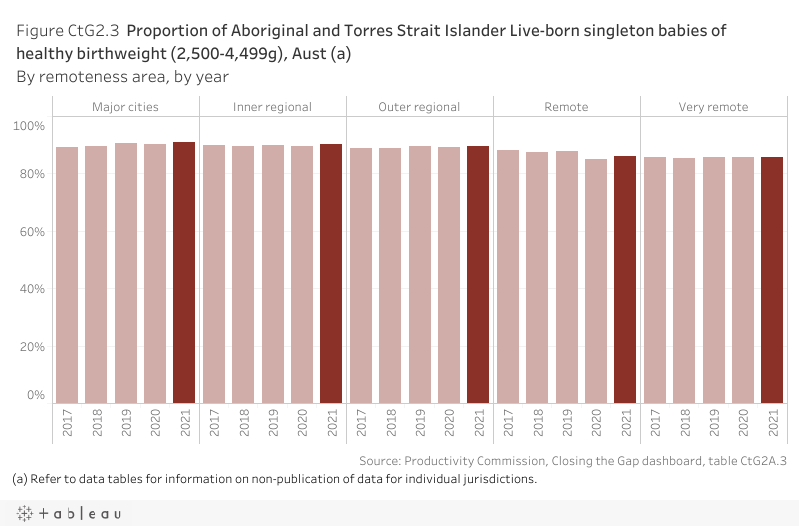
By remoteness area
Nationally in 2021, the proportion of Aboriginal and Torres Strait Islander babies born of a healthy birthweight was similar across major cities (90.9%) and inner regional and outer regional areas (90.1% and 89.5% respectively). The proportions were lower in more remote areas (86.1% in remote areas and 85.6% in very remote areas) (figure CtG2.3).
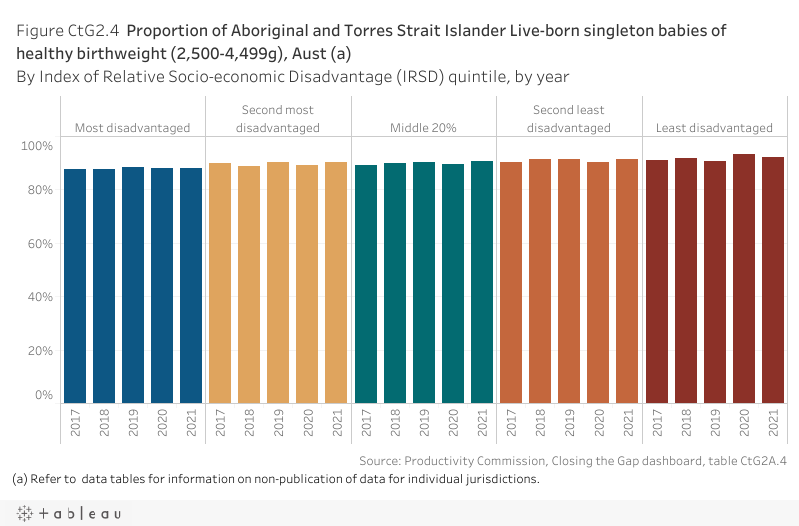
By Index of Relative Socio-economic Disadvantage (IRSD) quintile
Nationally in 2021, the proportion of Aboriginal and Torres Strait Islander babies born of a healthy birthweight was highest for babies from the least disadvantaged areas of Australia (92.1%). The proportion declined for babies from more disadvantaged areas, to 88.2% in the most disadvantaged socio‑economic areas of Australia (figure CtG2.4).
Target data specifications
Outcome: | Aboriginal and Torres Strait Islander children are born healthy and strong. |
|---|---|
Target: | By 2031, increase the proportion of Aboriginal and Torres Strait Islander babies with a healthy birthweight to 91%. |
Indicator: | The proportion of Aboriginal and Torres Strait Islander babies with a healthy birthweight. |
Measure: | The measure is defined as: Numerator – number of live born singleton Aboriginal and Torres Strait Islander babies who weighed between 2,500 and 4,499 grams at birth Denominator – total number of live born singleton Aboriginal and Torres Strait Islander babies and is presented as a percentage. |
Target established: | National Agreement on Closing the Gap July 2020 |
Latest dashboard update: | 6 March 2024 |
Indicator type: | Target |
Interpretation of change: | A high or increasing proportion is desirable. |
Data source(s): | Name: AIHW National Perinatal Data Collection (NPDC) Frequency: Annual (2017 data for state and territory revised (previously np) and a small number of other cells revised throughout in the March 2023 dashboard update) Documentation (links): https://www.aihw.gov.au/about-our-data/our-data-collections/national-perinatal-data-collection |
Data provider: | Provider name: Australian Institute of Health and Welfare (AIHW) Provider area: Perinatal |
Baseline year: | 2017 |
Latest reporting period | 2021 |
Target year: | 2031 |
Disaggregations: | State and territory and Australia, by birthweight range, by Indigenous status of the baby. State and territory and Australia, by birthweight range, by Indigenous status of the baby, by sex of the baby. State and territory and Australia, by birthweight range, by Indigenous status of the baby, by remoteness area. State and territory and Australia, by birthweight range, by Indigenous status of the baby, by Index of Relative Socio‑economic Disadvantage (IRSD) quintile. |
Computation: | Numerator divided by Denominator multiplied by 100. Counting rules Data relate to live births. Births both less than 20 weeks gestation and less than 400 grams birthweight are not included in the NPCD. Healthy birthweight is defined as babies who weighed between 2,500 and 4,499 grams at birth; low birthweight (400 grams to less than 2,500 grams). The data is by geographic area of usual residence of the mother. Indigenous status is of the baby. Includes (denominator):
Excludes (both numerator and denominator):
Disaggregations: Sex relates to biological primary sexual characteristics. Births classified as ‘indeterminate/not stated’ are excluded from the analysis by sex. Remoteness area is classified according to the ABS 2016 Australian Statistical Geography Standard (ASGS) using SA2 as the building block. Births to mothers whose usual residence is categorised as ‘migratory’ are excluded from the analysis by remoteness. Data exclude babies where the information on the usual residence of the mother was not sufficient to identify her geographic area and assign a remoteness area. Socio‑economic status of the locality is classified according to the Socio‑economic Indexes for Areas (SEIFA): Index of Relative Socio‑economic Disadvantage (IRSD), 2016 using SA2 as the building block. Data are reported by IRSD quintile that are determined at the Australian level. Data excludes babies where the information on the usual residence of the mother was not sufficient to identify her geographic area and assign a socio‑economic status of the locality. Supporting calculations Variability bands (provided for proportions). See the How to interpret data page for further information. |
Data quality considerations: | In the NPDC, Indigenous status is a measure of whether a person identifies as being of Aboriginal and/or Torres Strait Islander origin. All jurisdictions have a data item to record Indigenous status of the mother and Indigenous status of the baby on their perinatal form, although there are some differences among the jurisdictions. Birthweight data on Aboriginal and Torres Strait Islander babies born to mothers residing in the Australian Capital Territory should be viewed with caution as they are based on small numbers of births. Please refer to the How to interpret the data page for more information. The AIHW does not provide data for proportions based on denominators of less than 100 for reliability reasons (mostly births with Indigenous status not stated). Proportions based on numerators of less than five are also not provided (np), with the exception of ‘not stated’ categories. Consequential suppression (np) has been applied to prevent back‑calculation of small numbers. However, relevant data are included in the calculation for Australian totals. |
Future reporting: | Additional disaggregations required for future reporting:
|
Supporting indicators
Driver
- Proportion of mothers who smoke during pregnancy by age groups
Any time, or after 20 weeks
- Proportion of mothers who consume alcohol during pregnancy by age groups
- Proportion of pregnant mothers with a pre-existing health condition
Gestational diabetes, obesity, hypertension, other
- Use of antenatal care by pregnant women
- proportion with five or more antenatal visits
- proportion with at least one antenatal care visit in the first trimester
- Proportion of pre-term births
Contextual information
- Progress towards parity
Material for download
- Children are born healthy and strong data tables (XLSX - 129 Kb)
- Children are born healthy and strong dataset (CSV - 280 Kb)
To assist with interpretation of the data provided (Excel data tables and CSV dataset) please refer to the target data specification above.