Recession, recovery and reform
Speech
Chair Michael Brennan delivered a speech to the Property Council in Canberra on 26 May 2021.
Download the speech
Read the speech
I want to talk to you today about the 3Rs: recession, recovery and reform.
The pandemic and the recession remind us that pessimism sells. This time last year it was regarded as slightly naïve to express faith in a V-shaped recovery.
A lot of pundits offered up a lot of other letters of the alphabet: U-shaped, W-shaped, L-shaped, even I-shaped.
Our official macro-economic family in the Treasury and Reserve Bank were closer to the truth – and they were helped by real time data from a range of sources, not least of which was the single touch payroll data collected by the ATO and used by the ABS to illustrate labour market impacts in close to real time.
This tech-enabled innovation was not available to policy makers in the early 1990s or even to the same extent during the GFC.
This might sound off-message for a microeconomist, but it really matters how well an economy handles and then rebounds from a recession.
This first slide tracks GDP per capita for Australia and the G7 economies.

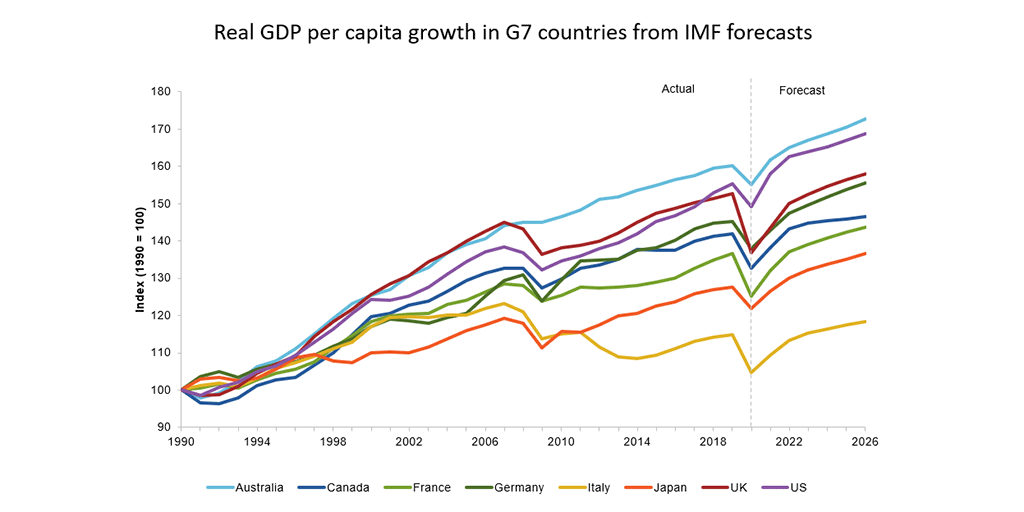
What it tells you is that Australia has outpaced all of the G7 in real per capita growth since 1990 because:
- this is per capita, it strips out the impact of population growth
- it is real GDP growth; it strips out the impact of movements in Australia’s terms of trade.
It illustrates that the gap between Australia and our large, developed economy peers has multiple drivers:
- Faster productivity growth in the 1990s, which set us on a steeper upwards trajectory.
- Avoiding recession during the GFC, when others dipped and never fully recovered.
- According to IMF forecasts, (so far) a milder recession and stronger rebound from the current recession.
By contrast, you can see that the European economies never fully recovered from the double dip recession of the GFC and Euro crisis.
The US lost a lot of ground in the GFC but are making much of this up, with a strong anticipated rebound from COVID. Noting that the US is still the richest country in this dataset in absolute terms.
The UK economy grew rapidly in the 1990s but has lost considerable ground during the pandemic.
France and Germany are projected to recover more slowly from the pandemic. On IMF projections, Italy will have a lower GDP per capita in 2026 than it had in 2006. A remarkable result.
So twice in the last 12 years, Australia has weathered a global economic crisis better than almost all of its developed economy peers.
And we have ‘banked’ some of that gain in the form of higher cumulative real GDP growth. We went into the last two global crises with strong fiscal buffers, well capitalised banks, comparatively flexible labour markets and an openness to trade, all of which helped support the response and recovery.
It seems fashionable in the moment to herald new economic paradigms, but in reality, the broad economic framework which Australia has developed and had in place for the last 30 years, has been vindicated by events.
It laid the groundwork for the macro-economic response to the crisis itself, which of course had to be tailored to precise circumstances.
Every crisis, and every recession is different.

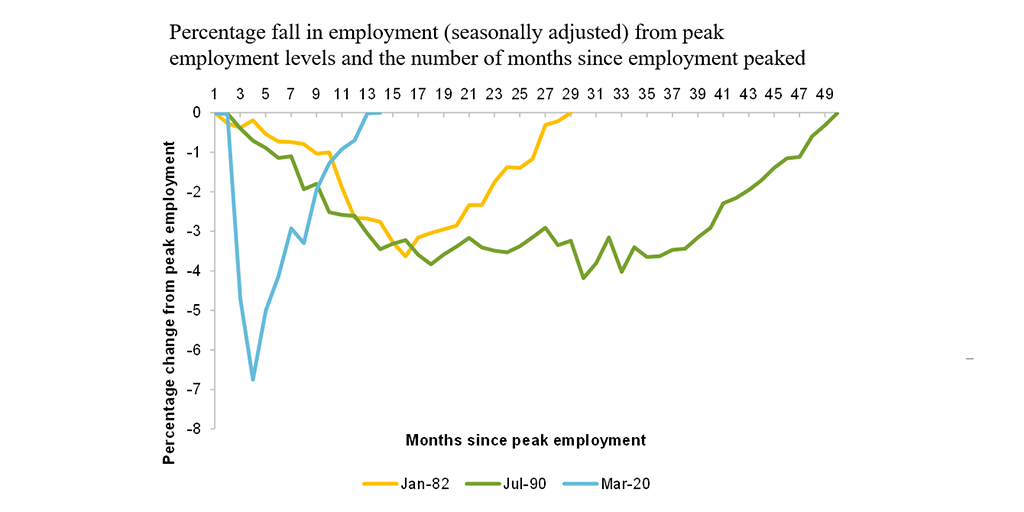
This chart shows the path of employment in the last 3 recessions in Australia: the early 80s, the early 90s and today.
It shows how many months it took for employment to return to its pre-recession levels: 29 months in the early 1980s; more than 4 years in the early 1990s and 12 months this time – despite a much bigger reduction peak to trough.
The rebound in employment reflects the remarkable recovery in the labour force participation rate (back to pre-pandemic levels) and a fall in unemployment to just above pre-pandemic levels.
The other shock-absorber in the labour market – as with the GFC – was hours worked per employee which fell by more than the fall in employment and had almost recovered to pre-pandemic levels by December 2020.
This was in stark contrast to the experience of the early 1990s where most of the labour market weakness manifested in job losses. In 2020, more of the load was borne by a reduction in hours worked, due to a combination of labour market flexibility and JobKeeper.
The implications of the pandemic and the recession for productivity remain to be seen.
Over the long run, productivity growth is the key to rising living standards. In the short term, particularly in the midst of a recession, with unemployment and idle resources, productivity is not necessarily a good guide to wellbeing.
What matters is productivity growth over the next 5 to 10 years as we emerge from this episode.
In 2019-20, oddly enough, labour productivity actually rose by 0.5 per cent. This is partly a quirk, reflecting that in many industries output fell by less than employment did – hence output per hour worked actually rose.
It also reflects the differential impact of the recession. It hit hardest in labour intensive service industries which have relatively low levels of productivity, while employment rose in some high productivity industries, like mining.
This will partly unwind as employment returns to the hardest hit service industries. In fact, on the face of it, there is less labour reallocation between industries, the longer the recovery progresses.

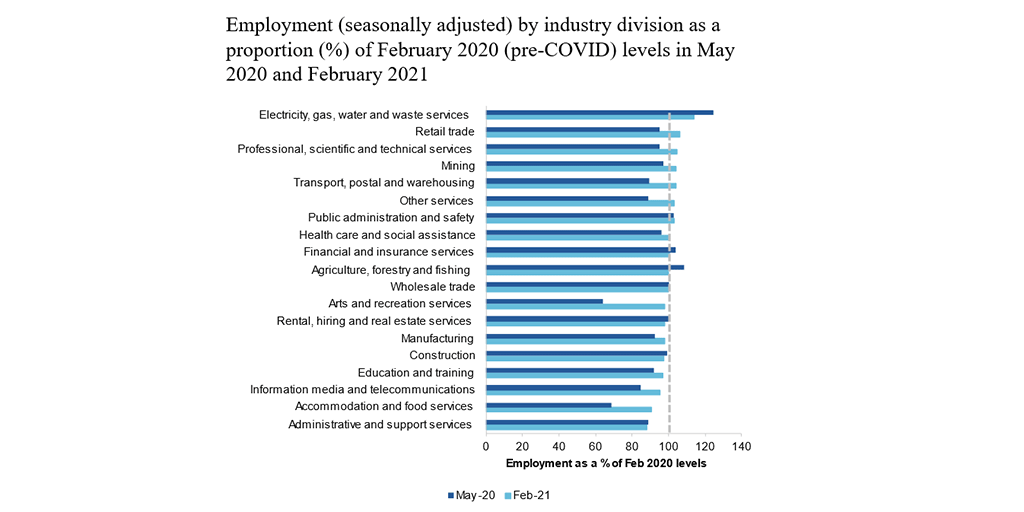
In May 2020, (the dark blue bars) the composition of employment across the economy had shifted a lot, with several industries well below their pre-COVID levels.
By February 2021, (the light blue bars) this effect had moderated, with most industries converging back towards their pre-pandemic employment levels.
At the level of smaller sub-industries, or individual firms, the story would be a bit different.
This reflects the impact of Jobkeeper and other fiscal supports like the cash flow boost, along with policies like interest deferral, rent deferral and relief and temporary changes to insolvent trading rules.
Insolvencies in 2020 were down on 2019 levels by around one third.
I have said in the past that the recession and recovery would entail some reallocation of labour and other resources across the economy. That remains true, though the process could be yet to fully play out, as temporary supports are withdrawn.
The overall focus of policy in 2020 was to hold things together, reflecting the nature of this recession.
Every recession is painful, but some have the consolation of a cleansing effect – where low productivity firms exit, and high productivity firms stay in business. Which can set the economy up for faster productivity growth in the recovery, as occurred in the 1990s (for a range of reasons).
The 2020 recession was of a different character. Unlike a conventional demand-side recession, it risked wiping out firms indiscriminately in the absence of government support.
It arguably meant that those fiscal measures couldn’t just take the form of demand-side stimulus but had to directly support the short term viability of firms and maintain the employment relationship.
Hence, we will no doubt see some reallocation of resources across the economy. Whether we see a productivity rebound due to significant exit of low productivity firms is less clear.
The good news about Australia’s performance relative to other economies comes with a qualification – namely our poor recent productivity growth by historical standards. Real growth in per capita GDP and incomes over the last decade has been the slowest in 60 years. In terms of income growth, the last decade has resembled the 1970s.
Of course in some ways, that is misleading – we are materially richer than we were in the 1970s and the Australian economy is more efficient and closer to the global frontier than it was then – prior to the reforms of the last 40 years. But it does serve as a caution against the view that our aim should be simply to rebuild the economy of 2019.
As I noted earlier, our broad policy framework is strong and should be maintained, not least because it facilitates economic adaptation and change. But it should not be the aim of public policy to restore every pre-existing business model that was disrupted by the pandemic. Not all of them were sustainable or desirable.
The true goal of economic policy is to create a more dynamic economy that can drive higher productivity and income growth into the future. It can do this by promoting a more efficient allocation of resources across the economy.
Much of the Productivity Commission’s recent work deals with driving greater competition and efficiency in key markets like superannuation, financial services, communications, agriculture and airports.
Inefficiencies in individual sectors can add up to an economy wide brake on living standards. But policy also plays a role in enabling innovation and the adoption of new technology.
Over the long term, productivity growth is largely driven by technological progress. That technological progress is about more than inventing new things; and more even than replacing old machines or inputs with a more up to date version.
Much of the value of technical progress comes in the changes to production techniques and business models which new inventions make possible – effectively the flow on effects, which themselves trigger new innovations.
The example of electricity is instructive. Thomas Edison invented the lightbulb in 1870 and had set up electricity generation plants in the early 1880s. But 20 years later, the vast majority of American factories still used steam power.
The take up of electric power took several decades. And the productivity gain did not come from the simple replacement of steam engines with an electric motor.
Instead, the productivity gain came from the reconfiguration of factories to take full advantage of what electrical power made possible – the ability to have lots of small machines with their own source of power, available when and where it was required.
The rise of electricity then spawned other inventions – new machines and household appliances for example – that only became possible because of this more flexible form of energy.
And the same can be said of digital technologies of today, including data analytics and AI.
As economists Erik Brynjolfsen, Daniel Rock and Chad Syverson noted that electricity, like AI, can be regarded as ‘general purpose technologies’. They make the point:
General purpose technologies (GPTs) are ‘engines for growth’. Specifically, they are pervasive, improve over time, and lead to complementary innovation (Bresnahan and Trajtenberg 1995).
However, along with installing more easily measured items like new types of physical equipment and structures, we emphasize that realizing their potential also requires large intangible investments and a fundamental rethinking of the organization of production itself.
Firms must create new business processes, develop managerial experience, train workers, patch software, and build other intangibles.
Hence the role of policy is to remove the potential barriers that stand in the way of that broader technological adoption – the new business processes and complementary innovations. Those barriers include the regulations or funding models or licensing schemes that entrench existing approaches.
There is much debate in the economics profession about whether the pace of technological progress is slowing down. Maybe the world is running out of ideas, or – more plausibly – new breakthroughs are getting harder and more costly to generate.
But the speed with which messenger RNA vaccines have been developed over the past year, or the dramatic falls in the price of renewable energy remind us that human inventiveness is a constant.
The question is whether we, as a society through our policy settings, embrace technological progress and its potential to transform existing business models and production processes.
Two forced innovations from the pandemic provide examples – telehealth and online education.
In its simplest form, telehealth is the replacement of a one-on-one physical consultation with a one-on-one remote consultation. It saves on transport and the time wasted in the so-called ‘waiting room’ (we estimate this downtime as costing around $1 billion a year). Similarly, for many school students in 2020, online education was essentially a classroom lesson that was filmed.
But in essence, this is the equivalent of replacing a single steam engine with a single electric motor. The real innovation comes as we explore all the ways digital communications can fundamentally change the nature of the service.
In health that would mean data linkages between GPs and hospitals, AI to pro-actively identify patients at risk of chronic disease, real time communications and information sharing between patients and clinicians. And these are just the foreseeable innovations.
One of the potential barriers to digital adoption is the funding model for primary care, which pays doctors primarily for one-on-one consultations, effectively locking in the existing mode of service delivery.
Recently the Productivity Commission released research on innovations in care for chronic health conditions. It examined real life case studies of enterprising people who are swimming against the tide of existing incentives and entrenched cultural practices in order to deliver more proactive, integrated and patient-centred care to those with chronic conditions.
In our mental health report, we discussed the important gap for low intensity services that can be filled by moderated online services, which economise on clinicians as part of a broader digital offering.
Two other forced experiments from the pandemic are the increase in working from home and the continued uptake of online shopping.
Both reflect the adoption of digital technology and both have the potential to be transformative and disruptive of existing business models to some extent.
Like electricity in the early 1900s, working from home relies on a technology that has been available for some time, but it took the pandemic to force an awareness of how it can be applied.
For 20 years prior to the pandemic, the share of the workforce working from home was remarkable steady at around 5 per cent. Last year during the pandemic it shot up to around 40 per cent. In the near term, the level of working from home will almost certainly be somewhere in between.
Working from home is not practical for many people – we estimate based purely on occupational requirements that around 40 per cent of jobs can in principle be done remotely. But whether it is economic to do those roles remotely depends on the individual worker and the individual firm.
There are trade-offs between the time savings of the commute (plus the flexibility of being able to combine work with other tasks) on the one hand and the loss of social connection and creativity that comes from physical co-location on the other. But the forced learning from the COVID pandemic has taught many that working from home can work, at least part of the time.
To invoke the electricity metaphor once again, the real productivity gain will come not from replicating at home the precise tasks previously performed in the office, but by changing both.
The true ongoing innovation may be less about where we work and more about how we work. The office will adapt – probably to be more focused on collaboration and team-based work. CBDs will innovate, to remain attractive locations for work and leisure.
It would be foolhardy to proclaim the death of the city. It is even possible that increased working from home could increase the concentration of office jobs in CBDs.
But it is equally futile to try and frustrate the natural tendency towards some increase in remote working. It is a natural, technologically enabled innovation that can work to the mutual benefit of firms and workers if worked through cooperatively.
The role of regulation – in areas like workplace health and safety and workplace relations – is to facilitate that cooperation rather than trying to lock in a legacy approach.
The story of online retail is similar.

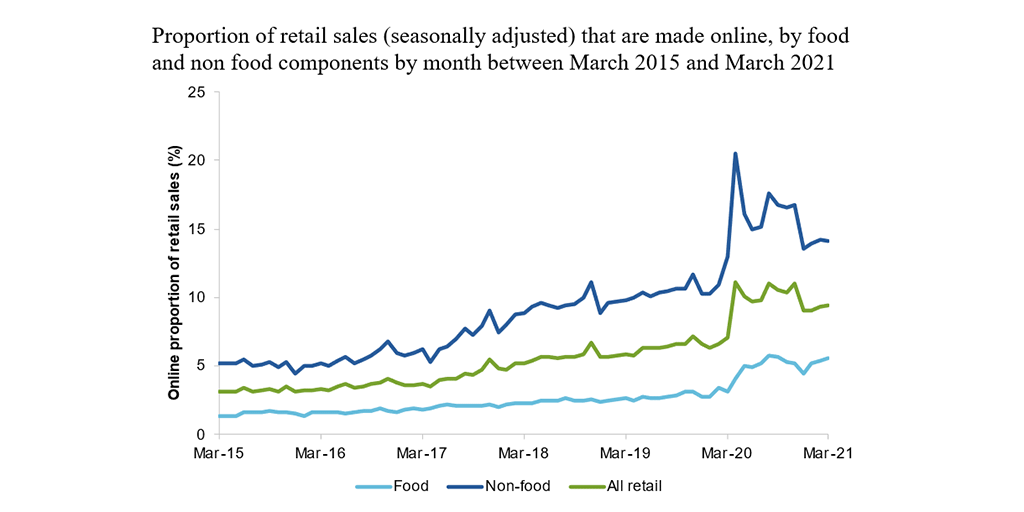
As the chart shows, the online share of retail spending spiked during 2020 and has moderated since but is unlikely to return fully to its pre-pandemic levels. The online share of non-food retailing has doubled in less than 4 years. As to whether that trend is maintained, we can only speculate.
What we can say is that the increased uptake of digital technology during 2020 has created some uncertainty about the location of economic activity into the future.
The office will evolve, as will different forms of retail. The shift of industrial land from manufacturing to logistics may continue. Perhaps office and residential uses will blur.
But in the face of all that, we still have state planning systems that are highly prescriptive as to what different forms of economic activity can occur where
In particular, we observe a proliferation of commercial zone types and often a lack of uniformity about zone definitions across local government areas. The allowable uses in those zone types can be quite limited, with few ‘as of right’ uses (or even none).
Planning is a complex area. Passions can run high and opinions can differ – even within the Property Council. But some measured steps could help boost the flexibility of our economy in adapting to change.
In particular, we have proposed a number of areas for reform, including:
- ensuring that local plans (such as planning schemes or LEPs) can deliver on state-wide development and population objectives
- having fewer zone types with a broader range of allowable and as of right uses
- standardising permissible land uses within zone types across all LGAs
- having more defined and efficient processes for rezoning applications
- expanding the use of streamlined assessment tracks, by re-thinking what constitutes a low-risk application
- cutting DA assessment times through more concurrent decision making, streamlining the use of state referral agencies and using electronic lodgement and tracking of applications.
Even incremental progress on these fronts would position us to better respond to change and uncertainty. And would be consistent with the broad policy framework I mentioned earlier.
The broader question for regulatory policy is whether it stifles new innovation or embraces it, or – as in the case of Uber and ride sharing – starts with one and eventually, reluctantly, shifts to the other.
All this suggests that the path to higher productivity growth should not be seen as the quest for a policy El Dorado – a single big thing, or a destination flowing with riches. Rather, it is a whole lot of little things that potentially add up.
The challenge is that, because the path of innovation is unknown, we can’t identify ahead of time the precise regulatory barriers that will frustrate future growth. Nor can we quantify the benefit of their removal. It requires some faith in human ingenuity and the great unknown that is progress.
I reflected earlier that pessimism sells; but in the long run it is perhaps optimism that pays the bigger dividend.
Hugh Stretton Oration
Chair Danielle Wood delivered the 2024 Hugh Stretton Oration at the University of Adelaide.
Download the oration
Read the oration
I would also like to begin by recognising the Kaurna people as the traditional owners of the land on which we meet today. I acknowledge their deep connection to this place and pay my respects to their elders, past and present and to any Aboriginal or Torres Strait Islander people with us this evening.
Thank you everyone for being here. It is very special for me to be back at the University of Adelaide, the place where I experienced the heady years of my undergraduate Economics degree. Lots of long afternoons in the Reading Room of the Barr Smith library, the occasional equally long one at the Uni Bar (RIP), but an incredible spirit of learning, thinking and debate that was so foundational for me.
A huge thank you to the Provost, Professor John Williams AM, Deputy Vice-Chancellor and Vice-President (Academic) Professor Jennie Shaw and Professor Adam Graycar for having me back. I am honoured to have the Governor Her Excellency the Honourable Frances Adamson in attendance, as well as the University Chancellor, the Honourable Catherine Branson AC KC.
There are also a couple of other very special guests in the audience, my parents Rae and Simon Wood, who are hearing me speak for the first time in a professional setting this evening. And I am grateful that after listening to my almost constant talking from the age of two, they are still willing to come back for more.
Hugh Stretton’s legacy
It is also a huge privilege to have the opportunity to honour the professional contribution of Professor Hugh Stretton AC. Professor Stretton’s incredible intellect and impressive CV has been well detailed by the Vice Chancellor.
Three things stood out to me in reading about his professional life.
The first was his intellectual energy and imagination. I particularly enjoyed the reference provided by one of his former supervisors on his application to lead the School of History:
The first impression is of extremely high intelligence. He uses his gifts quietly, however, and is given as much to listening as to talking... He is quite clearly an exact and energetic scholar, though … I am not at all confident that he will publish either quickly or much. I have no doubt that he would build a School of History soundly and with imagination. 1
Now today, any mention of a relaxed approach to publication might be an automatic disqualifier, but the referee was right about Stretton’s suitability to successfully lead the department.
By the end of his tenure as chair in 1966 the School of History had gained a reputation as one of the best of its kind in Australia. 2 And much of this was down to Stretton’s reputation as a formidable thinker and public intellectual. 3 Ultimately in academia, and in life, the spirit of curiosity counts for much.
The second was Professor Stretton’s gift for turning new ideas into policy practice.
His most famous work, a book on urban planning called Ideas for Australian Cities, was so influential that when applicants were interviewed for positions in the Whitlam government’s Department of Urban Development, the first question was: ‘What do you think of Stretton?’. 4
While becoming the opener for a public service interview is a bar not many of us will reach, that spirit of marrying rigorous evidence with real world policy implications is one that I know that many of us strive for in our work.
And the third and perhaps most notable thing was Stretton’s unwavering belief in fairness and opportunity for all. He believed public thinkers have a responsibility to look for chances to make a difference, to reduce disadvantage and make Australia a place where anyone can prosper.
As he once said: “We should be doing all we can, by old and new means that fit our changing historical conditions, to leave Australia fairer than we found it”. 5
Tonight I hope to give you some ideas about how we take up Stretton’s challenge.
I’m going to take you through what we know about inequality in Australia today.
Using new analysis released this week by the Productivity Commission, I’ll show you the distribution of wealth and income in Australia and how it’s changed over time.
I also want to give you a sneak peek of some research we haven’t yet published on intergenerational mobility. This goes to the important question: how much does who your parents are, go on to influence your life outcomes?
To finish, I’m going to give you a ‘fair go toolbox’ – a set of policy allen keys that can fit the inequality problem at hand.
A few disclaimers...
But first let me start with a few disclaimers, and as I’m an economist rather than a lawyer I’m going to put these right upfront rather than buried in size 6 font in a footnote.
1. Economic inequality is a surprisingly slippery construct
‘The rich are different to you and me’, writer F Scott Fitzgerald once claimed. ‘Yes’, said Hemmingway, ‘they have more money’.
At one level inequality is that simple: some people have more money than others.
But as I will come to, economic inequality measures can vary a lot depending on what we are measuring – do we care about income, consumption or wealth?
And there can be a range of worthwhile questions to ask:
- How are those doing it toughest faring?
- How much do the most well off – say the top 10% or 1% – have compared to others?
- Or how are resources distributed across the population as a whole?
Each can give us different insights.
And that’s before we even get to the question of how opportunities and outcomes change over a person’s lifetime, or vary by gender, age or for First Nations Australians.
So, to manage this complexity, tonight I’m going with the maximalists – or perhaps the Strettonist – approach. I will take you through a range of indicators and cuts of the data to give you a broad account of the state of play. But I also want to talk about what this actually looks like in people’s lives.
As Stretton said:
“I’m not sure that much valuable reform has sprung from high theory about the dynamics of distribution. More has come from ...competent accounting, summarising and insistent publication of the patterns of inequality… and the effects of those distributions on the quality of people’s experience in life.” 6
2. Be a sceptic
It is somewhat uncomfortable to say this as the leader of the organisation that prides itself on evidence-based, often data-driven, analysis. But in almost all data analysis we deal with imperfect data and are forced to make choices about how to address that.
In inequality research those choices can make a big difference to the story.
Very recently this challenge has jumped off the pages of academic journals and on to the front page of the Washington Post with the so called ‘inequality wars’.
On one side of the war you have famous inequality researchers, Thomas Piketty and Emmanuel Saez.
They have spent the better part of two decades analysing inequality, including by using American tax data to document a significant and growing share of US incomes flowing to the top 1%.
It’s rare to get rock star economists, but these guys are it.

(As an aside if you purchased but did not finish Piketty’s hefty Capital in the 21st Century back at the height of Pikettymania in 2011 you are not alone, on some measures it is the second most unfinished book on Kindle, after Hilary Clinton’s autobiography...). 7
On the other side of the war sit Gerald Auten and David Splinter – their names might not ring any bells.
These two relatively unknown tax code nerds come from the US Treasury Department and Congress Joint Committee on Taxation.
Using the same tax data as Piketty and Saez, they come up with the opposite conclusion: after tax, the share of US income going to the 1 % has barely moved since the 1960s.

Cue much triumph from some commentators and members of the press.
But beyond the simplistic discussions of Piketty and Saez being proved ‘wrong’ was the more nuanced truth – both sets of researchers had made a series of judgments around issues like how to estimate ‘missing money’ not included in tax returns, and how to attribute spending on health, education or defence across the population.
The appropriateness of each of these judgements is now the subject of further debate, but what is clear is that what might seem like technical judgments can sometimes have a big effect on conclusions.
In all the analysis I present tonight we’ve tried to be as robust and open as we can about any judgments made. But I encourage you to keep your sceptics hat on.
3. There will be graphs
I’m an economist, there will be lot of graphs this evening. But I’ll do my best to ‘use my words’ and hopefully we can avoid data overload.
Income inequality in Australia
Ok, let’s start with talking about the broad distribution of income in Australia.
I know it’s not always au fait to talk about what you earn in public, so I’ll ask you to do this exercise in your heads. I want you to think about whether you consider yourself to be a low-income earner, a middle-income earner, or a high-income earner.
Let’s see how you went.
Here’s the distribution of Australian taxable income. That is, the income before tax but after you’ve made any allowable deductions.
If your taxable income is over about $51,000, you earn more than 50% of Australians who lodge a tax return. If you earn more than $95,000, that puts you in the top 20%. If you earn $336,000 or above – you are the 1%.

A surprising number of people get this wrong. In fact, the vast majority of us consider ourselves to be ‘middle income earners’. 8 This is probably because the people we tend to live near and associate with are more likely to be in a similar tax bracket to us.
This is presumably why every year or so high earners from the media and political class kick off passionate debates about whether $200,000 is really a high income 9 – while, I suspect, the 97 % of Australians earning less than that amount just roll their eyes.
If we move to looking at using disposable income – that is income after tax and transfers – for an average Australian household, we can see that incomes have risen over time.
This is generally what we have come to expect, that outside of short dips during major economic shocks, income growth will continue its long march upwards over time.

And how has this growth been distributed?
The answer is relatively equally across the population in recent decades.
Indeed, in the 30 years between 1989 and 2019, income grew pretty consistently across the income distribution. Those in the top 10% experienced slightly higher growth than other groups, but nothing like the strong growth in income inequality seen in the US that dominates much of our inequality discourse.

In contrast, the COVID period and its aftermath has seen greater dispersion with incomes at the top growing rapidly and those at the bottom going backwards.
The reasons are complicated, but reflect the roller coaster ride of lockdowns and recession, increases and withdrawals of government supports, and the healthy bounce back and high inflation that followed.

As you can see, the three years of the COVID period actually reflect three quite different inequality dynamics.
At the start of the COVID 19 pandemic, government-imposed lockdowns caused drastic declines in economic activity and widespread job losses. 10 In response, the Australian Government provided substantial support, which cushioned the economic harm across the community.
The effective doubling of the JobSeeker payment, and the flat $1500 per fortnight JobKeeper payment for workers in eligible businesses 11 produced high income growth for those at the bottom and middle of the income distribution.
As the economy re-opened, supports were withdrawn, those gains were reversed.
And despite the strong economy and labour market, high inflation meant real wages went backwards for most workers over the past two years.
In contrast, high income households benefited from rip-roaring growth in business income as well as decent investment income, as the economy recovered.
Overall, and barring any further major shocks, we can probably expect the next few years will bring a return to a more ‘normal’ income growth and certainly to the more consistent patterns seen across the distribution observed in the pre-COVID era.
It is also interesting to reflect on how we compare to other nations.
Egalitarianism is tied up with Australian identity. We are the land of the ‘fair go’, a place where your taxi driver, your boss, and even the Prime Minister can all be safely referred to as your ‘mate’.
But does the reality match the mythology?
Not entirely.
Australia’s income inequality is ‘middle of the pack’ by rich-country standards. Comparing based on the Gini coefficient – a measure of overall inequality – Australia is close the OECD average.

Overall, we not as unequal as our friends in the US and the UK, but nor are we as egalitarian as the Nordic countries.
One important reason for these large cross-country differences is differences in tax and transfer policies.
For example, the US starts relatively unequal, but by no means the most. But because they redistribute income less, they end up the most unequal of Western nations. 12 In contrast, Finland has close to US-levels of inequality before taxes and transfers. After, it is one of the most equal nations in the OECD. 13
These are important differences that highlight a point I want to come back to: policy choices matter to inequality.
But now we have a snapshot of how Australians across the distribution have fared over time and relative to elsewhere, I want to turn to another important part of the inequality story: outcomes and opportunities for the most disadvantaged.
Poverty in a rich country
It’s almost 40 years since Bob Hawke declared that no child would live in poverty by 1990. 14
But, according to ACOSS, one in eight people lived below the poverty line in 2019-20, including one in six children. 15
This measure of poverty looks at relative income poverty – it’s set at 50 % of the typical Australian household disposable income, less housing costs.
Some argue it is better to look at absolute measures (for example, the amount of money required to be sure a household can achieve a basic standard of living) or indicators of material deprivation.

For example, amongst low-income households in 2019-20, 16% were unable to raise $500 for something important, 8% were unable to heat their homes, and 7% went without meals. 16
And it’s that sense of precariousness that pushes the impacts of poverty from the material to the mental. And those impacts can have a long tail.
As journalist Rick Morton writes about his own childhood growing up in a poor household: 17
I saw Mum’s daily, sometimes hourly, battles to stay solvent. I saw how hard she worked and what it did to her body and her mind. The stress of even thinking of it now is difficult to explain. It is built not only into my own mind but also in my flesh. The things I will do to avoid the feeling today. The things I try to do for Mum to make it so she never has to feel it again.
The biggest risk factors for poverty are: being on JobSeeker or Parenting Payment. 18
Policy and poverty remain inextricably linked.
Wealth inequality in Australia
Of course economic differences are not just found in incomes. Wealth or how much money you have ‘behind you’ is an important determinant of outcomes too. Wealth is a buffer – it can be converted into future consumption opportunities and provides a sense of financial security.
That is why we understand the pensioner who owns their home and has $250,000 in the bank is in a materially different economic position to the single part-time worker who records a similar $30,000 income but has few assets.
Wealth has grown significantly in Australia in recent decades.

I remember in primary school the shorthand for someone really, really, rich was a ‘millionaire.’ The average Australian household is now more than halfway to that benchmark. Indeed, a person that owns a typical house outright in Clarence Gardens is a ‘millionaire’. 19
Wealth overall is much less evenly distributed than income.
If we take a household at the 90th %ile for wealth, they have almost 70 times as much wealth as the Australians at the 10th %ile. For income the figure is only four times as much.

Wealth also has much greater extremes.
In his 2013 book on inequality, Battlers and Billionaires, Parliamentarian and economist Andrew Leigh provided a memorable analogy, which I have updated today:
Imagine a ladder on which each rung represents a million dollars of wealth. If we were to put all Australian households on this ladder 50% of us are about halfway to the first rung, the top 10 % are about 1.5 rungs up, the top 1% are reaching for the fifth rung – just high enough to clean the gutters. 20 Gina Rinehart is more than 11kms off the ground. 21
But even with this very long ladder, Australia’s wealth inequality is lower than many other OECD countries. 22
But an important question is how has the distribution changed in recent decades?
The answer is: it’s complicated.
Pre-pandemic, wealth grew faster for the top half of the distribution.

But the pandemic once again, produced some surprising results.
This pattern flipped and wealth grew more quickly overall and significantly faster for lower and lower middle wealth groups during the COVID period.
The two main reasons for this are:
- The strong growth in housing prices, particularly in the regions and the smaller capital cities. This had the biggest impact for homeowners in the lower middle and middle parts of the wealth distribution.
- Higher income from increased government support during the pandemic and fewer opportunities to spend, helped boost bank balances and debt repayment among low-wealth households. 23
And while this is good news for many households at least in the short-term, the longer-term run-up house prices has produced a different set of inequality concerns.
A decaying dream? House prices and inequality across generations
Here I want to stop and reflect on the different ways in which the very strong growth in house prices has impacted economic outcomes for different groups in Australia.

Until the 1990s, house prices broadly tracked growth in incomes. But between 1992 and 2018 they grew at almost three times the pace on average. 24
The effect has been an increase in the upfront barrier to home ownership and increasingly also the ongoing costs for those that are able to clear that hurdle.
The result, unsurprisingly, has been falling home ownership.
In the early 1980s, when my parents were buying their first home, around 70% of those in their early 30s owned a home. Today that figure is just 50%. And the drops have been particularly acute amongst low-income young people. 25

The declining opportunities for homeownership are a particular source of dissatisfaction and unrest amongst many non-homeowning younger Australians. Amongst the so-called Generation Z non-homeowners, 93% want to own their own home. But only 63% think it is likely that they ever will. 26
The rise in house prices has also contributed to rising generational disparities in wealth accumulation.
Older households have always had more assets on average than younger ones. But the run up in house prices has created windfall gains for existing homeowners. This has been a major contributor to the rapid growth in wealth among older households.
A household headed by someone aged 65-74 had on average $1.3 million in assets in 2016, up from $900,000 for the same age group in 2004. Rising asset prices over the past seven years mean this figure is almost certainly substantially higher now.
In contrast, the wealth of households under 35 has barely moved in 15 years. And poorer young Australians have less today than poorer young Australians did 15 years ago. 27

Overall the developments in the housing market over recent decades have left many, particularly many older Australians, very well off. But the cost has been considerable housing stress amongst the vulnerable, and a generation of younger Australians who will reach middle age with substantially lower rates of home ownership than their parents.
Land of the fair go? Social mobility in Australia
Now I want to move from the photo to the movie: from talking about disparity in economic outcomes at a point in time to talking about how these outcomes can evolve over someone’s life.
A question that has rightly been of interest to those concerned about inequality, is how does inequality in outcomes influence equality of opportunity. ;Or to be more specific – how much are economic opportunities determined by who are our parents are?
Generational mobility has historically been a hard thing to study. To understand its dynamics we need linked data on parental economic outcomes and those of their children over a long duration.
In the absence of this type of data, at least until recently, people got creative.
In one of my favourite studies, Parliamentarian Andrew Leigh alongside co-authors Gregory Clark and Mike Pottenger, identified rare surnames in the 2014 electoral roll among doctors and university graduates from 1870. They found, nearly 150 years later, that people with those rare surnames are more likely to be in the so called ‘elite’ professions than people with surnames such as Smith.28
Indeed, they found that so called ‘status persistence’ for surnames was as high in Australia as for England or the United States. 29
In somewhat brighter news, more recent studies using linked administrative data point to a more optimistic picture on social mobility in Australia.
Looking at economic outcomes for a million individuals born between 1978 and 1982 Economists Nathan Deutscher and Bhashkar Mazumder find that Australia is one of the more economically mobile advanced economies. 30>
Indeed, they find Australia’s ‘intergenerational elasticity of income’ (a measure of how much your family’s income affects your own) is similar to Canada and close to those of the Nordic countries, and considerably more mobile than places like the United States. 31
In forthcoming work the Productivity Commission uses family-linked tax data that confirms that estimates of intergenerational mobility remain comparatively high.
But in contrast, things may be stickier for those doing it toughest.
In a 2017 study, Professor Deborah Cobb-Clarke and her co-authors showed that young people are 1.8 times more likely to need social assistance if their parents have a history of receiving social assistance themselves. 32

Consistent with this, the Productivity Commission’s forthcoming work shows that people in their late 20s whose parents received social transfer payments were about one and a half times more likely to receive social transfer payments themselves.
The Cobb-Clarke work showed that these transmission effects were particularly pronounced for disability payments, payments for those with caring responsibilities, and parenting payments for single parents. Interestingly, disadvantage stemming from parents’ poor labour market outcomes was much less persistent. 33
Cobb-Clarke and her co-authors posit that parental disadvantage may be more harmful to children’s later life outcomes if it is more strongly driven by circumstances rather than personal choice.
This aligns with the growing appreciation by economists of the impact of lack of hope or despair in shaping life choices and outcomes. 34
This was the sentiment expressed by a Tasmanian woman on welfare supports: 35
It’s not so much what we are missing out on, it’s the next generation and it is a hard cycle to break because they look at it and think, well, what’s the point? We’re always going to be poor, things are hard, nothing’s going to get better. Why should we bother?
Schools under stress: a red flag for future mobility?
One of the foundational supports for economic mobility is a strong education system.
Indeed, educational attainment has been estimated to explain up to 30 % of the transmission of economic advantage between parents and children. 36
Australia has historically had a strong system of school education that has supported opportunities across the population.
But there are some red flags for future prosperity and mobility that we should heed.
Indeed, despite growing funding in recent years, Australia’s school system has not been delivering the results we want for our young people.
Data from the OECD suggest that the performance of Australian school students in Reading and Maths is going backwards, with significant falls in our levels of achievement since 2000.

Estimates based on this data suggest the average Australian Year 10 student in 2018 was eight months behind in reading compared to where Year 10 students were at the turn of the century, and results have largely flatlined since. 37 We’ve seen even sharper declines in mathematics scores, where the decline for Year 10 students by 2018 was almost a year of learning.
But how much does parental background make a difference to how students fare?
The answer is a lot. More than half of the most economically disadvantaged 15-year-old students in Australia are not proficient readers.

Analysis from the Grattan Institute shows that the disparity in outcomes was worse in Australia than in Canda or the UK and on par with the US. 38
These gaps in performance widen through the schooling process.
The Productivity Commission looked at this using NAPLAN data. 39 We compared the average reading outcomes of students whose parents did not finish high school to those whose parents have a bachelor’s degree or higher. We found the learning gap – equivalent to almost two years of reading achievement in Year 3, progressively widens to an almost 5-year learning gap by the time students reach Year 9.
For mathematics, the gap widens from 1.3 to almost 4 years.

If we take education as an indicator of both a country’s future economic prosperity and its social mobility – this data must concern us.
It has been pleasing to see senior leaders, including here in South Australia, engage with this issue and its implications. But turning the ship around will require significant shifts in the way we deliver education in Australia.
A nation divided: why mixing matters for mobility
Another less obvious mobility-enhancer is where we grow up, and more specifically, who we grow up with.
US economist Raj Chetty and co-authors made a splash in 2014, when their study using administrative records on the incomes of more than 40 million children and their parents found very large variations in social mobility across the US. For example, they estimated a child from the poorest 20% of families had nearly a 3 times better chance of making it into the top 20% of income earners as an adult if they lived in Silicon Valley rather than Charlotte North Carolina. 40
In a later paper, Chetty and another co-author reinforced the importance of these neighbourhood effects by studying outcomes for families who moved to different parts of the Unites States.
They found that outcomes for children whose families move to a better neighbourhood improve the more time they spend there.
Indeed, every additional year in a ‘good neighbourhood’ sees that child’s outcomes converge closer to the average for that neighbourhood by about 4 %.41
And if you are thinking that this type of locational lottery could only exist in a place as unequal as the United States – think again.
Economist Nathan Deutscher has replicated this work for Australia. 42
And while the dipartites between regions are less pronounced here, we see the same convergence in outcomes, the longer a child is exposed to a ‘good neighbourhood’.
Deutscher finds that place matters most during the teenage years and suggests it might be ‘peer effects’ that explain locational differences in outcomes.
In other words, who you hang around with in those formative years makes a difference. Which may well be a validating result for any parent that has ever uttered the immortal phrase: “If Tanya jumped off a cliff, would you do it too?”.
This is consistent with more recent work that suggests it is economic connectedness – the capacity of low socioeconomic people to make friends with those from higher socioeconomic groups – that is the principal driver of social mobility. 43
And this is the very thing that gets lost as neighbourhoods and schools become more stratified and we participate less in social mixing opportunities. This means that observed declines in the types of activities that help build the social glue – from volunteering, to local sport, to attending church – over time might further erode social mobility.
What’s a policy maker to do?
Where does all this leave policy makers?
How much policy makers should seek to address inequality is not a straightforward question. It has been dissected by philosophers since Plato. And economists have been at intellectual fisticuffs over it for much of the past century.
Today, even the strongest advocates for greater equality will acknowledge that some inequality is inevitable and that it is important to maintain incentives for innovation and effort.
Many of the richest people in the world – Gates, Dyson, Musk – are innovators whose work has reshaped our lives. It is at least partly the ‘size of the prize’ available to successful innovation that drives the efforts and risks of would-be innovators and entrepreneurs.44
On a more relatable level, let’s think of the University we are at tonight. Would we expect students to flow through these gates to spend years of their lives learning about engineering or medicine or economics, and to work long hours while establishing themselves in their career, without some return for these efforts? In other words, incentives are important for growing the pie, even if they result in a somewhat unequal distribution of it.
On the other hand, even many of capitalism’s biggest cheerleaders raise concerns about the social and economic implications of stark economic dispersion.
Recently the IMF has warned that high inequality and especially poor social mobility can impact on long-term economic growth. 45 Others have shown that physical and mental health problems are worse in more unequal societies, predominantly due to the physiological stress of operating within a steep economic hierarchy. 46 And still others have linked rising inequality, or declining social mobility, 47 with the rise of populism as the ‘left behind’ lodge their protests vote against the so called elite.
All of this is to say that targeting inequality is complex. And while the ‘line’ across which inequality flips to doing more harm than good is far from clear, what is clear is that policy makers have a broad set of tools that can help push in their desired direction.
A policy makers’ toolbox
A few years ago, a group of high-profile economists organised an international conference on combatting inequality with a mission of engaging with the full suite of policy responses. 48
Their conclusion, although not revolutionary, provides helpful clarity: that the right policy response depends on why you care about inequality.
In particular, they draw a distinction between policies concerned with:
- outcomes for most disadvantaged – particularly for addressing entrenched poverty
- boosting opportunities for a ‘hollowed out’ middle class – a much greater concern in the United States than here, where, as we have seen, income growth has been broader based
- opportunity hoarding – or the way wealthy people might leverage their economic and political power to entrench their position.
The right policy tool will also depend crucially on whether policy makers are more concerned with equality of opportunity or outcomes.
Below is an adapted version of the taxonomy they created. It shows the breadth – and importantly the targeting of different levers that a would-be inequality buster might pull.

Now I do not advocate for all of the policies proposed. Indeed, whether any of these policies would be a good idea would require careful analysis of the costs and benefits in the particular context you might use them. There are probably good ideas that have been left out too.
But I did want to talk very briefly about four of the ‘biggies’ that I think really matter in an Australian context.
Growing the pie can mean bigger slices for all
Now in a presentation largely focused on distribution of the pie, I want make the case for making the pie bigger.
A cross-country and cross time evaluation suggests that growth is effective in reducing poverty. 49 Indeed, incomes for the bottom 10% are highly correlated with overall economic growth – a rising tide lifts some very important boats. We could put this beyond doubt for Australia by addressing some of the weaknesses in the current social safety net - a point I’ll return to.
The impact of higher economic growth on overall inequality is less clear. 50 But what is clear is that faster economic growth gives governments more room to support more generous welfare policies as well as other social spending on areas like education and health that particularly benefit those at the bottom and middle of the income distribution.
More generally healthy income growth can also support the political ‘buy in’ for these types of policies. 51
As for what governments can do to grow the pie – that would be a whole other lecture. But if the pie is of interest: ‘here’s one I prepared earlier’. My colleagues have published a comprehensive 1000-page guide for governments looking for ways to boost productivity and growth. 52

Fixing the housing mess
A functioning housing system is critical for improving our social and economic outcomes. Building more houses closer to jobs and amenities is needed to help younger and poorer Australians access the same opportunities as previous generations.
Australia’s population has grown strongly over the past two decades and will likely continue to do so. We can choose to push people out to the ever-expanding fringes of our cities or accommodate them through boosting supply in the inner and middle ring suburbs where most would prefer to live.
Allowing greater density in these areas not only expands supply but also boosts variety in housing choices, supporting more of the cross-socio economic mixing critical to social mobility.
After at least two decades of letting the ‘housing market frog’ slowly boil, there have been some positive steps from both Commonwealth and State governments to support the planning changes needed to boost supply. In particular, the Commonwealth government has offered incentives for states to target the construction of 1.2 million new homes over the next five years. 53
Similarly, moves to boost social housing are also a positive step, particularly where they’re targeted to those with the highest need.
Unfortunately, this new-found policy energy has come at the same time as the building industry faces challenges in ramping up.
But over time, if ambitious growth targets can be met, this could be a powerful shift in reducing inequality both within and between generations.
An education revolution?
School education is fundamental to supercharging opportunities for the next generation.
And while some of the problems our system faces are thorny, some of the solutions are surprisingly straightforward.
Our focus should start with getting the basics right – our schools should be supported and held accountable for delivering basic levels of literacy and numeracy. 54 My former colleagues at Grattan have called for a ‘Reading Guarantee’ – whereby governments would commit to ensuring at least 90 % of Australian students learn to read proficiently at school. 55
Supporting schools and teachers to deliver on these basics would require:
- making sure all teachers adopt evidence-based teaching practices such as phonics decoding for reading 56
- providing all schools and teachers access to a bank of well-sequenced high-quality curriculum materials 57
- reducing low value tasks for teachers to free them up to spend time on what really matters, 58 and
- providing better career paths to help schools attract and retain top teachers, and allowing top teachers to support and develop others in the profession. 59
Boosting social safety net
The Federal Government’s Economic Inclusion Committee just released its second report designed to inform the budget process.
Its lead recommendation remained unchanged from last year: to increase the rate of the JobSeeker and related income support payments.
The Committee finds that Australia’s unemployment benefits have been slipping further and further behind community living standards for two decades. 60
And while the recent 10% increase to Commonwealth Rent Assistance will provide much needed relief – as did the extra 15% in the last Budget – the Committee’s report demonstrates that the value of the payments has fallen significantly relative to average rents for the past 25 years. 61
Today, Australia’s payments to the short-term unemployed, including housing benefits, are the least generous in the OECD. 62

No single measure would do more to alleviate poverty than a material change in these payments.
What’s stopping us?
Partly it’s likely to be well-meaning concerns about the impact on incentives to work.
But consistent with previous work, the Economic Inclusion Advisory Committee finds that the negative effect on incentives is likely to be small, because current levels of the payment are so far below incomes from working. 63
Indeed, for those facing economic exclusion, higher income support payments may improve the capacity to search for and accept employment. 64
Second, is the cost. Moving as far as the Economic Inclusion Advisory Committee recommends on JobSeeker and related payments could cost up to $4.6 billion per year, 65 which is not straightforward for governments balancing a range of competing priorities. But as targeted interventions to address poverty go, there is very little waste.
Finally, there is the question of community support. Boosting Jobseeker payments rarely garners majority support across the population. 66 As I have previously argued, this is less a case of Australians being mean spirited and more about the grip of some persistent and unhelpful myths about welfare recipients. Your regular community service reminder tonight: the median Jobseeker recipient is a 45-year-old woman. 67
Finding our inner Stretton
And with that I want to wrap up where I began, with Stretton’s legacy.
Inequality is one of those topics where it is easy to simply revert to tired tropes, particularly off shelf ones from elsewhere.
Stretton encouraged us to look with curiosity and rigour, but also with an open heart. In doing so, everyone may take away something different from the numbers and analysis I have shared tonight.
To me, there are bright spots in the story. Australia has grown its income and wealth over several decades, and it has shared those gains broadly. Social mobility is relatively high.
On the other hand, many relying on payments are in poverty and the long shadow of that experience can be hard for children to escape. Our schools and suburbs are becoming less of a springboard for mobility. And we have made the Australian dream out of reach for a generation of young people.
Policy matters – there are many levers that governments can pull to make a difference to these outcomes. But it is up to Australians to decide which ones we want them to use.
Footnotes
- Munro, D 2016, ‘The House that Hugh Built, the Adelaide history department during the Stretton era, 1954-1996’, History of Education vol. 46, no. 5, p.634.. Return to text
- Ibid, p.631. Return to text
- Spoehr, J 2015, ‘Hugh Stretton: a great Australian public intellectual’, The Adelaide Review, 7 September. Return to text
- Davison, G 2018, ‘Watching a brilliant thinker stretching his mind’, Inside Story, 11 October. Return to text
- Spoehr, J 2015. Return to text
- Gibilisco, P and Stretton, H 2003, ‘A pragmatic social democrat: an interview with Hugh Stretton’, The Journal of Australian Political Economy, vol. 51, pp. 13. Return to text
- The Guardian 2014, ‘Can the Hawking Index tell us when people give up on books?’, 8 July.Return to text
- Hoy, C, and Mager, F 2021 ‘Why are relatively poor people not more supportive of redistribution? Evidence from a randomized survey experiment across ten countries.’ American Economic Journal: Economic Policy, vol. 13, no. 4, pp. 299–328.Return to text
- Hobman, J 2022, ‘EXCLUSIVE: 'It barely cuts it': Aussie finance guru exposes why $200,000 a year is NOT a big salary anymore - despite most of the country earning MUCH less - but not everyone agrees’, The Daily Mail, 14 July; Martin, P 2021, ‘Other Australians don’t earn what you think. $59,538, is typical.’ The Conversation, 8 June. Return to text
- Coates, B and Ballantyne, A 2020, ‘No one left behind: Why Australia should lock in full employment’, Grattan Institute. The unemployment rate surged from 5.2% in March 2020 to a peak of 7.5% in July 2020. ABS (Australian Bureau of Statistics) 2024, ‘Labour Force, Australia, Detailed, February 2024’. Return to text
- The Australian Government provided JobKeeper payments of $1,500 per fortnight to eligible businesses, which had to be paid to their employees, to minimise job losses and maintain employment and job attachment. AIHW (Australian Institute of Health and Welfare) 2021, ‘Australia’s welfare 2021: data insights’, pp. 84–86. The flat payment of $1,500 per fortnight meant some people – particularly part time workers – received more than their salary, while for others it led to a reduction in their salary. Treasury 2023, ‘The Australian Government Independent Evaluation of the JobKeeper Payment Final Report’, 28 September. Return to text
- Hasell, J 2023, ‘Income inequality before and after taxes: How much do countries redistribute income?’, Our World in Data Return to text.
- Ibid. Return to text
- As Prime Minister, Bob Hawke made the declaration in 1987, with the intention to reach the goal by 1990. Hawke, B 1987, speech delivered at Sydney, NSW, June 23rd, Museum of Modern Democracy: Election Speeches. Return to text
- Davidson, P, Bradbury, B and Wong, M 2023, ‘Poverty in Australia 2023: Who is affected’, Poverty and Inequality Partnership Report no. 20, Australian Council of Social Service and UNSW Sydney. Return to text
- ABS (Australian Bureau of Statistics) 2022, ‘Survey of Income and Housing 2019-20’, Australian Government. Return to text
- Morton, R 2020, On Money, Hachette Australia, p.18. Return to text
- Davidson, P, Bradbury, B and Wong, M 2023. Return to text
- ‘Clarence Gardens Adelaide - Greater Region, SA 5039’, https://www.realestate.com.au/sa/clarence-gardens-5039/, accessed 12 May 2024. Return to text
- Leigh, A 2013, Battlers and Billionaires: The Story of Inequality in Australia, Schwartz Publishing, Melbourne, updated according to Productivity Commission estimates using Melbourne Institute data (Household, Income and Labour Dynamics in Australia (HILDA) Survey, Release 22). Return to text
- Estimate based on data from AFR (Australian Financial Review), ‘Rich List 2023’, https://www.afr.com/rich-list, accessed 12 May 2024. Return to text
- Shorrocks, Lluberas, Davies and Waldenström 2023, ‘Global Wealth Report 2023’, Credit Suisse and UBS Global Wealth Databook. Return to text
- See Productivity Commission 2024, ‘A snapshot of inequality in Australia’, Research paper, Canberra, pp. 25-30 for a discussion. Return to text
- Wood, D 2023a, ‘Creating a Better Future for Generation Next’, Grattan Institute, Giblin Lecture, Hobart, 30 August 2023. Return to text
- Coates, B 2022, ‘Levelling the playing field: it’s time for a national shared equity scheme’, Grattan Institute. Return to text
- Susan McKinnon Foundation 2023, ‘McKinnon Poll: Understanding attitudes towards housing in Australia’, September, p.90. Return to text
- Wood, D 2023a. Return to text
- The authors define a set of elite ‘rare’ surnames in 1900 as those surnames where 29 or fewer people held the name in Australia in 2014 in the voting roll, and where someone holding that name graduated from Melbourne or Sydney universities 1870-1899. Clark, G, Leigh, A, and Pottenger, M 2020, ‘Frontiers of mobility: Was Australia 1870–2017 a more socially mobile society than England?’, Explorations in Economic History, vol. 76. Return to text
- Ibid. Return to text
- Deutscher, N and Mazumder, B 2020, ‘Intergenerational mobility across Australia and the stability of regional estimates’, Labour Economics, vol. 66. Return to text
- Ibid. Return to text
- Cobb-Clark et al., 2022, ‘Intergenerational disadvantage: Learning about equal opportunity from social assistance receipt’, Journal of Labour Economics, vol. 79. Return to text
- Ibid, pp.16-17. Return to text
- Case, A and Deaton, A 2020, Deaths of despair and the future of capitalism, Princeton University Press, Princeton. Return to text
- TASCOSS 2022, ‘Wellbeing First: A budget proposal to ease the cost of living and invest in the long-term wellbeing of Tasmanians’, 2023-24 TASCOSS Budget Priorities Statement, p.12. Return to text
- Breunig, R and Taylor, M 2023, ‘Success in life is tied to parental education. That’s why we need to track intergenerational school performance’, The Conversation, 14 February. Return to text
- Hunter, J et al. 2023, ‘The Reading Guarantee: How to give every child the best chance of success.’ Grattan Institute. Return to text
- Ibid, p.10. Return to text
- Productivity Commission 2022a, ‘Review of the National School Reform Agreement’, Study Report, Canberra. Return to text
- The authors found a child whose family is amongst the 20% most disadvantaged has a probability of ending up in the top 20% of income earners of just 4.4% if they live in Charlotte North Carolina, but 12.9% if they live in San Jose, in the heart of Silicon Valley. Chetty, R et al. 2014, ‘Where is the land of opportunity? The geography of intergenerational mobility in the United States’, The Quarterly Journal of Economics, vol. 129, no. 4, November, pp. 1553-1623. Return to text
- Chetty, R and Hendren, N 2018, ‘The impacts of neighborhoods on intergenerational mobility I: Childhood exposure effects’, The Quarterly Journal of Economics, vol. 133, no. 3, August, pp. 1107-1162https://academic.oup.com/qje/article/133/3/1107/4850660?login=false Return to text
- Deutscher, N 2020, ‘Place, peers, and the teenage years: Long-run neighborhood effects in Australia’, American Economic Journal: Applied Economics, vol. 12, no. 2, pp. 220-49. Return to text
- Chetty, R et al. 2022, ‘Social capital I: Measurement and associations with economic mobility’, Nature vol. 608, pp. 108-121. Return to text
- Deaton, A, ‘What’s wrong with inequality?’, The IFS Deaton Review, panellist introduction, https://ifs.org.uk/inequality/themes/whats-wrong-with-inequality/, accessed 19 May 2024. Return to text
- Cerra et al. 2021, ‘Links between growth, inequality, and poverty: A survey’, IMF Working Papers, Working Paper No. 2021/068. Return to text
- Wilkinson, RG and Pickett, KE 2009, ‘Income inequality and social dysfunction’, Annual Review of Sociology, vol. 35, pp. 493–511. Return to text
- Protzer, ESM 2019, ‘Social Mobility Explains Populism, Not Inequality or Culture’, Center for International Development at Harvard University, Working Papers, no.118. Return to text
- Pearson Institute for International Economics 2019, ‘Combating inequality: Rethinking policies to reduce inequality in advanced economies’, conference papers, October 17 to 18, Washington DC. Return to text
- Cerra et al. 2021. Return to text
- Ibid. Return to text
- Weisstanner, D 2023, ‘Stagnating incomes and preferences for redistribution: The role of absolute and relative experiences’, European Journal of Political Research, vol. 62, pp. 551-570. Return to text
- Productivity Commission 2023, ‘5-year Productivity Inquiry: Advancing prosperity’, vol. 1, Inquiry Report no. 100, Canberra. Return to text
- Productivity Commission 2022a, ‘Review of the National School Reform Agreement’, Study Report, Canberra. Return to text
- Hunter, J et al. 2023, ‘The Reading Guarantee: How to give every child the best chance of success’, Grattan Institute. Return to text
- Ibid. Return to text
- Hunter, J et al. 2022, ‘Ending the lesson lottery: How to improve curriculum planning in schools’, Grattan Institute. Return to text
- Productivity Commission 2022a. Return to text
- Goss, P and Sonnemann, J 2020, ‘Top teachers: Sharing expertise to improve teaching’, Grattan Institute; Gonski, D et al. 2011, ‘Review of funding for schooling: Final report’, Australian Government Department of Education, Employment and Workplace Relations. Return to text
- EIAC (Economic Inclusion Advisory Committee) 2024, ‘2024 Report to Government’, Australian Government Department of Social Services. Return to text
- EIAC 2024, p.62. See also Productivity Commission 2022b, ‘In need of repair: The National Housing and Homelessness Agreement’, Study Report, Canberra. Return to text
- EIAC 2024, p.54. Return to text
- EIAC 2024, pp.49-55. Return to text
- Ibid, p.55. Return to text
- EIAC, p.47. Return to text
- Wood, D 2023b, ‘The three myths that keep Australians in poverty’, The Sydney Morning Herald, 25 April. Return to text
- Ibid. Return to text
Acknowledgment
I would like to thank Productivity Commission staff especially Carmela Chivers, Sara Collard and the inequality team for their assistance with this speech. The speech draws heavily on their most recent work: A snapshot of inequality in Australia. All good ideas and analysis theirs – all mistakes my own.
