PC News - June 2018
Health services across Australia – how are they performing?

In January and February 2018, the Productivity Commission released the annual Report on Government Services (the RoGS). The RoGS reports on the equity, effectiveness and efficiency of government services in Australia.
Services reported in the RoGS account for about $224 billion in recurrent government expenditure (approximately 71 per cent of recurrent government expenditure), or roughly 13 per cent of gross domestic product. Total Australian, State and Territory government recurrent expenditure on health services alone was estimated to be around $96.7 billion, or roughly 43.2 per cent of total government expenditure covered in the RoGS.
To illustrate how the RoGS can be used to monitor the performance of government service delivery, this article provides a snapshot of information contained in the 2018 RoGS to assess the performance of Australian health services. Examples are provided of how indicators with comparable data across jurisdictions can be used to measure the equity, effectiveness and efficiency of health services, and the extent to which desired health service outcomes are achieved.
Overview of health services
Health services are concerned with promoting, restoring and maintaining a healthy society with the objective that Australians are born and remain healthy. Services cover illness prevention, health promotion, the detection and treatment of illness and injury, and the rehabilitation and palliative care of people who experience illness and injury. Health services in Australia are delivered by a variety of government and non-government providers.
The RoGS reports on various aspects of these services in the following chapters:
- Health sector overview (part E)
- Primary and community health services (chapter 10)
- Ambulance services (chapter 11)
- Public hospitals (chapter 12)
- Mental health management (chapter 13).
Are health services provided equitably?
Equity indicators measure how well a service is meeting the needs of particular groups that have special needs or difficulties in accessing government services.
Equity of access to primary and community health care services across Australia has improved but varies between regions
The indicator ‘Availability of primary healthcare services’ assesses equity of access by geography. The measure ‘General practitioners by region’ reports that in 2016-17, there were more GPs per 100,000 people available in major cities and inner regional areas than in outer regional, remote and very remote areas in most jurisdictions.
Nationally, there were 108.8 GPs per 100,000 people in major cities, compared to 91.6 GPs per 100,000 people in outer-regional, remote and very remote locations (figure 1). Although this pattern is consistent with data reported for prior years, the number of GPs per 100,000 people in the overall population has increased over the past five years (in total and across all geographic locations) from 85.4 GPs per 100,000 Australians in 2012-13 to 107.0 in 2016-17.
Figure 1: GPs by region, 2016-17a,b
FSE GPs/100,000 people
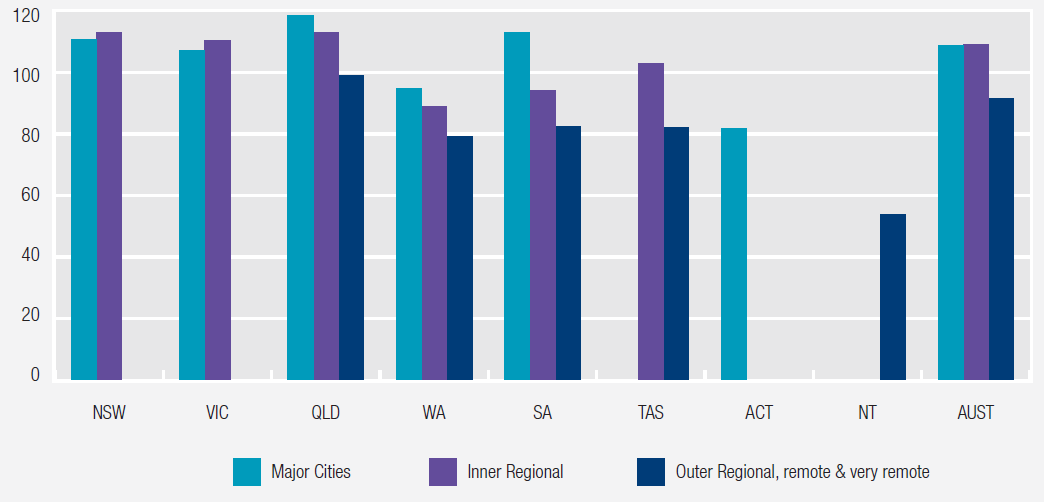
a Geographical classifications are based on the Australian Statistical Geography Standard (ASGS) 2011, which is the Australian Bureau of Statistics’ geographical framework for publishing statistics that are comparable and spatially integrated. The ASGS classifies Australia into large regions that share common characteristics of remoteness. It is based on calculated road distances to the nearest service centres in five categories of population size. Due to the remoteness characteristics and population size requirements of the ASGS, there are no major cities in Tasmania; no outer regional or remote areas in the ACT; no major cities or inner regional areas in the NT. Major cities and inner regional areas are combined for the ACT.
b FSE = Full Service Equivalent.Source: RoGS 2018, table 10A.19.
Equity of access for Aboriginal and Torres Strait Islander Australians has improved
The indicator ‘Early detection and early treatment for Aboriginal and Torres Strait Islander Australians’ assesses the proportion of older people who received a health assessment under Medicare. Health assessments are Medicare Benefit Schedule (MBS) items that allow comprehensive examinations of patient health, including physical, psychological and social functioning.
Nationally in 2016-17, the proportion of older people receiving a health assessment was 37.3 per cent for Aboriginal and Torres Strait Islander people and 32.7 per cent for other Australians (figure 2). Nationally, over the five years to 2016-17, the proportion of older Aboriginal and Torres Strait Islander people who received an annual health assessment increased by 11.5 percentage points to 37.3 per cent, compared to an increase of 3.9 percentage points to 33.0 per cent for all older Australians (2018 RoGS, table 10A.25). These data suggest equity of access to these services for Aboriginal and Torres Strait Islanders has improved over time.
Figure 2: Older people who received a health assessment by Indigenous status, 2016-17
Per cent
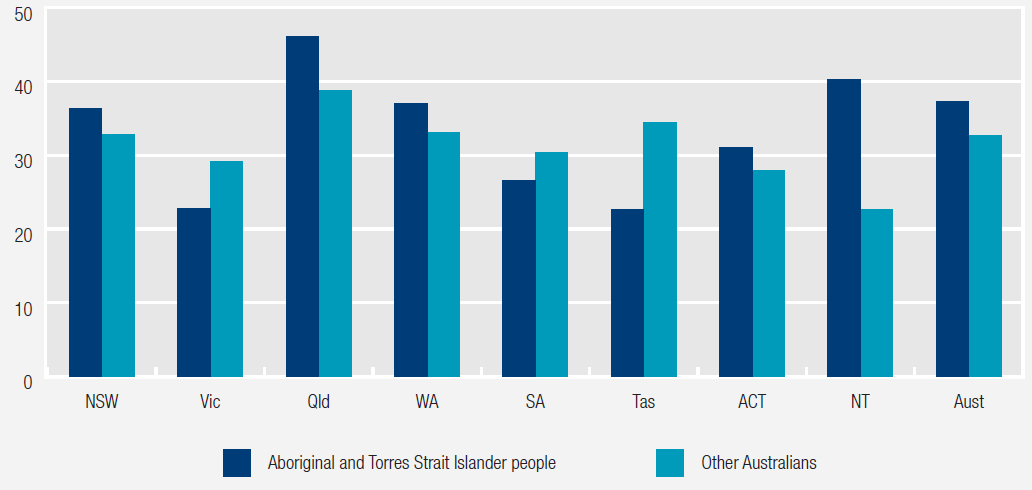
Source: 2018 RoGS, table 10A.25.
Table 1 lists all health service equity indicators reported in the 2018 RoGS.
| Availability of primary healthcare services |
| Early detention and early treatment for Aboriginal and Torres Strait Islander Australians |
| Response times by geographic location |
| Mental health service use by selected community groups |
Are services effective?
Effectiveness indicators measure how well government services meet their objectives: is a service achieving what it is meant to achieve?
Effectiveness in early detection and intervention for mental illness has improved
The indicator ‘Primary mental health care for children and young people’ assesses the proportion of people aged under 25 years who received a mental health care service subsidised through the MBS from a GP, psychologist or an allied health professional. High or increasing proportions of young people who had contact with MBS subsidised primary mental health care services is desirable as it is an objective of Australian governments to facilitate early detection of mental health issues and provide intervention.
The proportion of all children and young people who receive MBS subsidised primary mental health care services has increased gradually over time (2018 RoGS, table 13A.18). The proportion increases as age increases; with the highest proportion for young people aged 18-24 years (12.2 per cent of this population receiving these primary mental health care services nationally in 2016-17) (figure 3) (2018 RoGS, table 13A.19). Data by gender, Aboriginal and Torres Strait Islander status, socio-economic status, and service type are available in the 2018 RoGS in tables 13A.19-20.
Figure 3: Children and young people who received MBS subsidised primary mental health care, by age group, 2016- 17
Per cent
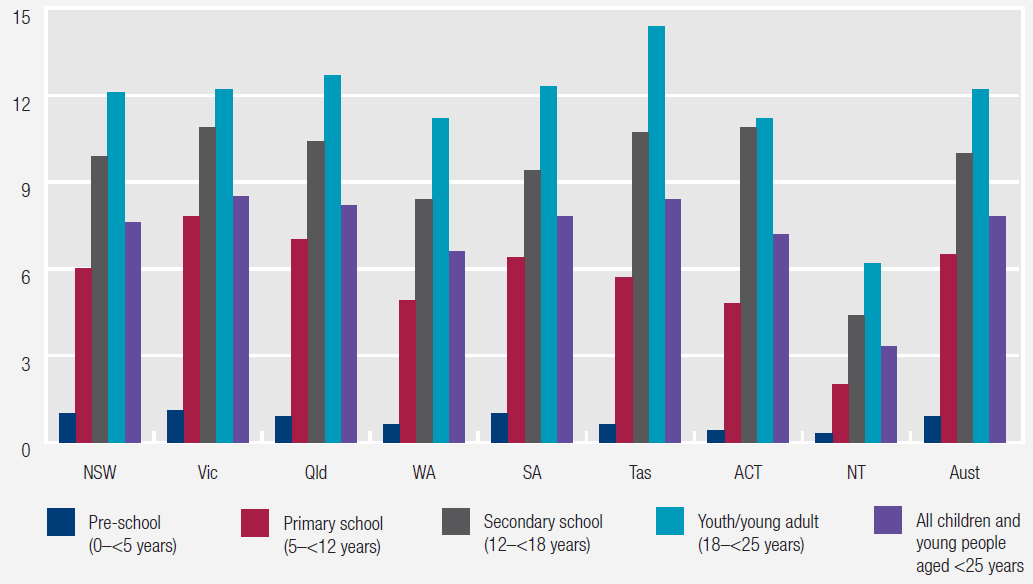
Source: Australian Government Department of Health (unpublished); table 13A.18.
Effectiveness in ensuring the sustainability of the health workforce is mixed
The health system relies on its workforce to provide high quality and timely services to patients now and in the future.
Ambulance workforce
The indicator ‘Operational workforce attrition’ provides information on the sustainability of the ambulance workforce, showing the proportion of salaried staff who exit the workforce in a year. Nationally in 2016-17, the attrition rate was 2.6 per cent, a decrease from 4.3 per cent in 2012-13 (figure 4).
Figure 4: Attrition across the ambulance services operational workforcea
Per cent
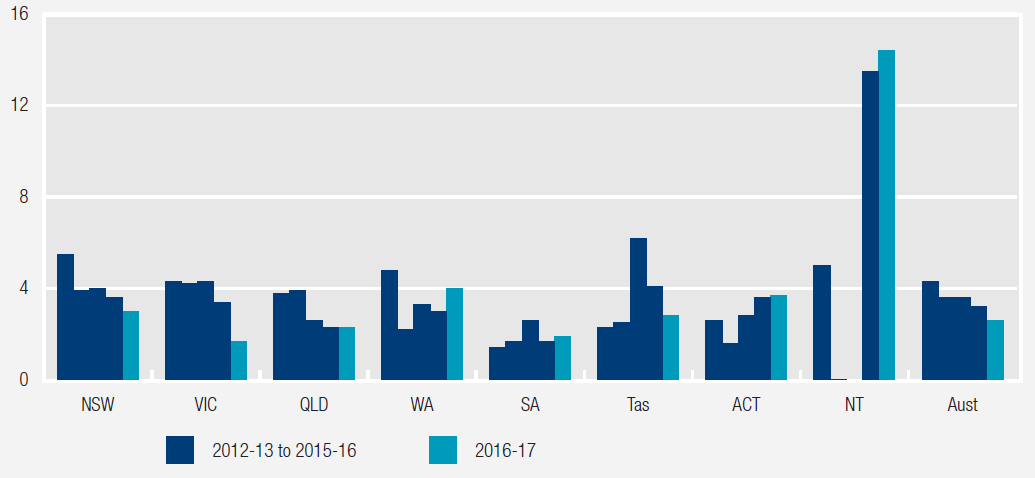
a Attrition data were not available for the NT for 2014-15, and were nil or rounded to zero for 2013-14.
Source: RoGS 2018, table 11A.7.
Public hospital workforce
The sustainability of the public hospital workforce is assessed by measuring the age profiles of the medical practitioner and nursing workforces. The indicator ‘Workforce sustainability’ shows the proportions of medical practitioners and nurses in ten year age brackets, by jurisdiction and by region.
Nationally in 2016, 17.6 per cent of the medical practitioner workforce and 12.0 per cent of the nursing workforce were aged 60 years and over (figure 5), reflecting a gradual increase from 2009 for medical practitioners (table 12A.54) and from 2007 for nurses (table 12A.52) (approximately 20.7 per cent of the total Australian population was aged 60 years and over in 2016; 2018 ROGS, table 2A.2). State and territory data are available in tables 12A.55 (medical practitioner) and 12A.53 (nursing). These data are not a substitute for a full workforce analysis that allows for migration, trends in full-time work and expected demand increases. They can, however, indicate that further attention should be given to workforce sustainability for public hospitals.
Figure 5: Medical practitioner and nursing workforces, by age group, 2016
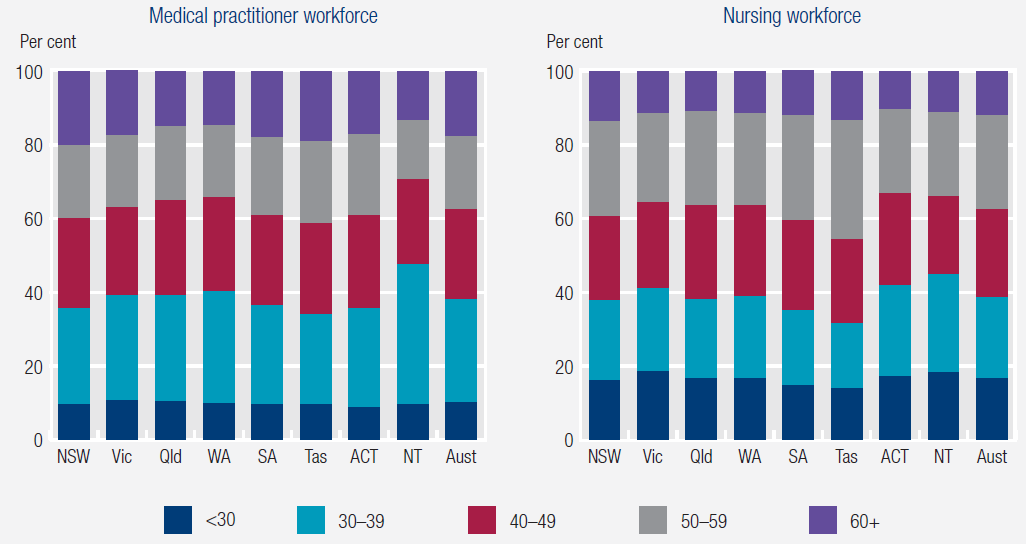
Source: 2018 RoGS; tables 12A.53 and 12A.55.
Table 2 lists all health service effectiveness indicators reported in the 2018 RoGS.
| Affordability of primary healthcare services | Waiting times for admitted patient services |
| Timeliness of primary healthcare services | Adverse events in public hospitals |
| Potentially avoidable presentations to emergency departments | Sentinel events |
| Chronic disease management | Selected unplanned hospital readmission rates |
| Immunisation coverage | Workforce sustainability |
| Cancer screening | Primary mental healthcare for children and young people |
| General practices with accreditation | Consumer and carer involvement in decision making |
| Patient satisfaction | Services reviewed against the National Standards |
| Pain management | Rate of seclusion – acute inpatient units |
| Ambulance workforce | Community follow-up after psychiatric admission/hospitalisation |
| Emergency department waiting times | Readmission to hospital within 28 days of discharge |
Are services efficient?
Efficiency indicators measure how much governments spend to provide services, for example, how much is spent per patient.
Expenditure on general practice per person has increased
The indicator ‘Cost to government of general practice per person’ measures what is spent by governments to provide general practice health care per person. Nationally in 2016-17, total expenditure per person on general practice was $371, an increase in real terms from $316 per person in 2012-13 (figure 6).
Figure 6: Australian Government fee-for-service expenditure per person on GPs (2016-17 dollars)
$/person
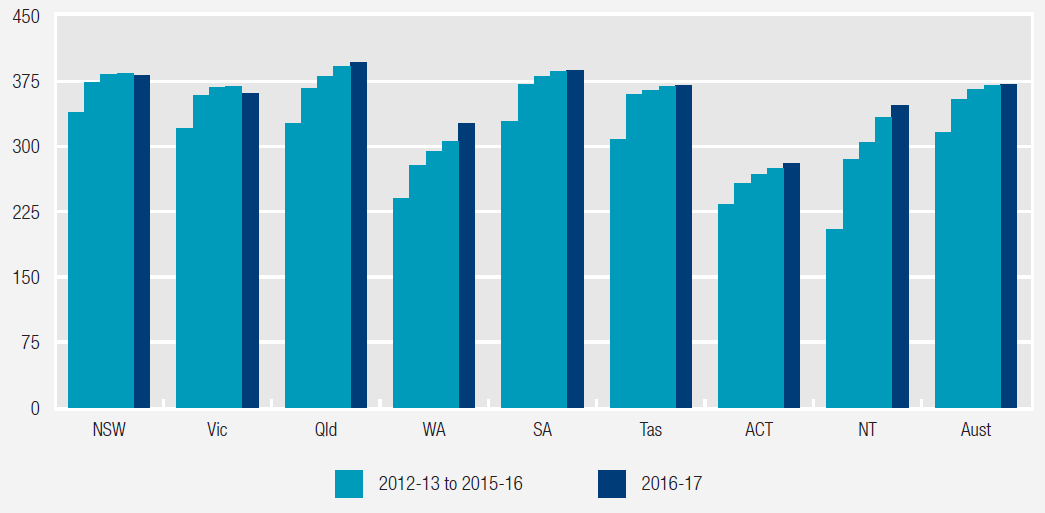
Source: RoGS 2018, table 10A.2.
Public hospital patient costs vary
The indicator ‘Recurrent cost per weighted separation’ measures the average cost of providing care for an admitted patient (overnight stay or same day) adjusted for casemix. Casemix adjustment takes account of variation in the relative complexity of the patient’s clinical condition and of the hospital services provided. Nationally in 2015-16, the recurrent cost per weighted separation was $5199 (figure 7).
Figure 7: Recurrent cost per weighted separation, 2015-16
$/separation
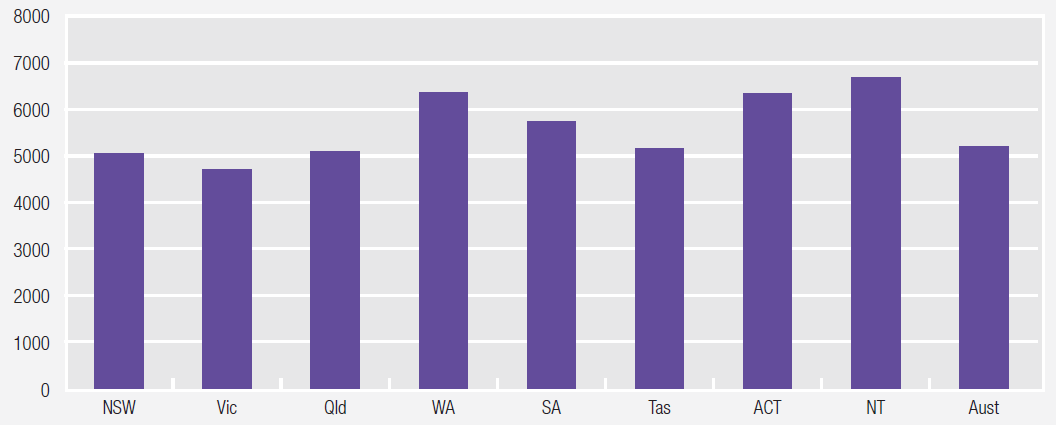
Source: 2018 RoGS; table 12A.56.
Table 3 lists all health services efficiency indicators reported in the 2018 RoGS.
| Cost to government of general practice per person | Recurrent cost per non-admitted patient |
| Ambulance services expenditure per person | Cost of care |
| Cost per admitted patient separation |
What outcomes are achieved?
Outcome indicators provide information on the overall impact of a service on individuals and the community.
Notifications of selected childhood diseases have fluctuated
The indicator ‘Notifications of selected childhood diseases’ assesses the number of notifications of measles, pertussis (whooping cough) and invasive Haemophilus influenzae type b reported to the National Notifiable Diseases Surveillance System by State and Territory health authorities for children aged 0–14 years, per 100,000 children in that age group. A low or reducing notification rate for the selected diseases indicates positive immunisation program outcomes.
Nationally in 2016-17, the rate of notifications for children aged 0–14 years was:
- 0.1 per 100,000 for Haemophilus influenzae type b (table 10A.60 and figure 8)
- 0.7 per 100,000 for measles (table 10A.58 and figure 8)
- 181.1 per 100,000 for pertussis (whooping cough) (table 10A.59 and figure 8).
Historical data for each of the above notifiable childhood diseases are included in the 2018 RoGS in tables 10A.58–60, by state and territory. Figure 8 presents national notification rates per 100 000 children for pertussis (whooping cough), measles and haemophilus influenzae type b for the past five years.
Figure 8: National notifications of pertussis, measles and haemophilus influenzae type b, per 100,000 children aged 0–14 years
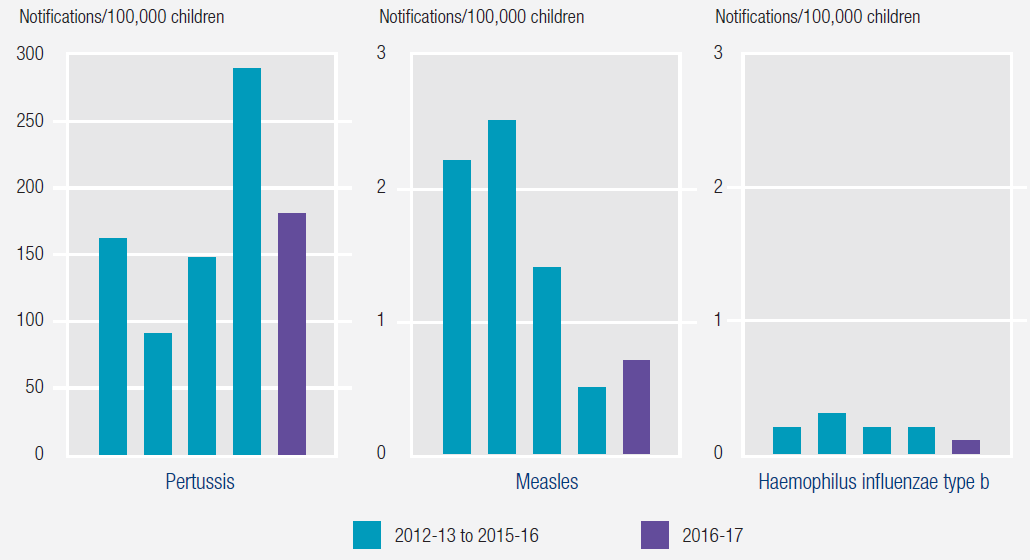
Source: Department of Health (unpublished) NNDSS, ABS (various years) Population by Age and Sex, Australian States and Territories, Cat. no. 3201.0; table 10A.59.
Deaths by suicide have increased
The indicator ‘Mortality due to suicide’ measures the number of deaths across Australia due to suicide. For the period 2012–2016, 13,974 deaths by suicide were recorded in Australia – equivalent to 11.8 deaths per 100 000 people each year (figure 9). The national suicide rate has increased over the past 10 years (for example, in 2007, 10.6 deaths per 100,000 people in the population were attributable to suicide).
Figure 9: Suicide rates, 5 year average, 2012–2016
Deaths/100,000 people
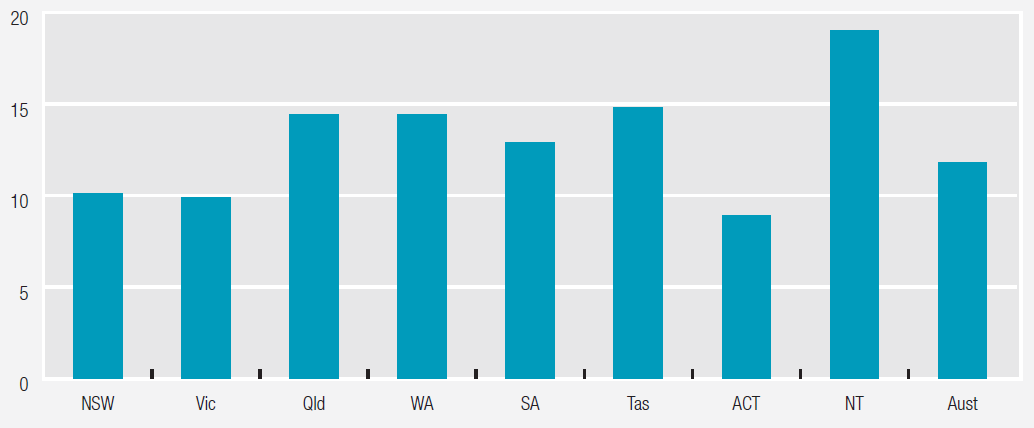
Source: RoGS 2018, table 13A.48.
For the period 2007–2016, national male suicide rates were over three times the rate for females (in 2016, 17.8 per 100,000 males compared with 5.8 per 100,000 females) (ABS 2017). Suicide rates disaggregated by significant urban areas, Indigenous status and for 15–24 year olds are included in the 2018 RoGS in tables 13A.49–51.
Table 4 lists all health service outcome indicators reported in the 2018 RoGS.
| Notifications of selected childhood diseases |
| Selected potentially preventable hospitalisations |
| Cardiac arrest survived event |
| Prevalence of mental illness |
| Mortality due to suicide |
| Physical health outcomes of people with mental illness |
| Social and economic inclusion of people with mental illness |
| Mental health outcomes of consumers of specialised public mental health services |
To find out more…
Further information on the health service examples provided in this article, and many other measures of the equity, effectiveness and efficiency of government services across a broad range of social services, can be found on the RoGS website: www.pc.gov.au/research/ongoing/report-on-government-services/2018.
Report on Government Services 2018
- Steering Committee for the Review of Government Services Provision
- Read the Report released 23 January-1 February 2018