Reconsidering the sacred cow of housing: Policies for an ageing Australia
Chairman's speech
Peter Harris gave an address at the Curtin University Public Policy Forum 2016 on 18 February 2016 in Perth.
Download the speech
Read the speech
I don't know about you but I find breakfast meetings to be the very worst idea civilised society has thrown at itself in the last couple of generations.
And now I'm going to add to the burden of this early start by talking about demography and age pensions and the intersection of them with that sacred cow of Australian political and social existence, the family home.
I can only say that the issue is worth your time as, unlike many other elements of public policy, it's going to affect almost every person in this room at quite a practical level: we're all going to get old, we all have stake in quality of life in retirement and most of us own a home.
So we can be both high-minded and self-interested here this morning.
And indeed that's the context nationally for such a discussion: the inevitable clash between the legitimate self-interest of individuals to make what are very personal decisions about their retirement; and the need for design of public policies affecting those decisions to offer a welfare improvement across society, in an era that will be quite different from the period in which many were introduced.
In the last three years, the Productivity Commission has published self-generated research work1 focusing on the implications for public policy of imminent demographic change for three key policy areas: workforce impacts from ageing, retirement incomes and housing policies.
Together they cover:
- the broad sweep of the large demographic shift we face in the next forty years
- how current policy envisages us maintaining incomes and assets, while absorbing a large addition to our non-working population.
In addition, in 2011 the Commission comprehensively reviewed the aged care sector in a report Caring for Older Australians.
Collectively, these reports provide the basic foundation for my remarks today.
Internationally, there has been intense interest in demographic effects interacting with growth and employment. Japan and Germany are good examples, entering or in this demographic shift already; China has significant social policy needs created by its one child policy and increasing longevity; and most recently the Bank of England has looked at the effect of ageing in the UK on interest rate policy.
Locally, other entities - Commonwealth Treasury, the Grattan Institute, academics and most recently the CSIRO - have also contributed.
All this analysis may make it seem like we have solved the consequent policy conundrums.
But we haven't. Consistent with the current preferred public policy stance of only responding when faced with a crisis, our awareness may be high but our preparedness is low.
Substantially, that's because the question of policy in relation to retirement is highly prone to populist thinking, making leaders very wary.
There should be a way to get past this wariness. Today, I would like to suggest a pathway, drawing on our three reports.
With the breadth of commentary and analysis available to them, leaders in Australia should be pretty well informed by now on the following inevitable set of policy shifts:
- we will have a big rise, over an extended period — much longer than a single generation - in relatively healthy but retired Australians, and they will disproportionately outweigh the addition to the population of younger Australians, at a net cost to participation in the workforce
- the Age Pension will continue to be accessed by most of these retired Australians, notwithstanding any of today's mooted alterations to retirement incomes policy
- the consequent size of the fiscal increase for the Age Pension is quite notable, at roughly 1% of GDP; but bigger increases through that same period will occur in Aged Care (1.8% of GDP) and in Health (2.9% of GDP)
- of these latter two, Aged Care is clearly driven by ageing, while health costs are driven by more than just demographic change
- moreover, quality survey work and longitudinal analysis found in both our housing policy and superannuation research reports confirms a loose perception of policy makers: older Australians are strongly inclined to save rather than spend in retirement, almost regardless of circumstances, and despite substantial increasing housing wealth
- and research also disproves a similar loose perception : there is no evidence for a strategy by retirees to deliberately blow the super, cushioned by access to the age pension
- finally, even in very old age, most Australians remain net savers - as the wealth embedded in their housing asset persistently but invisibly increases, even as their personal health or aged care needs also grow.
At the personal level, there's no reason to be critical of an inherent tendency to save in old age.
But poorly-constructed policies should not exacerbate such tendencies. Nor should they pander to populist commentary.
There is good evidence that they do.
The powerful housing policy nudges that most of us have received throughout adult life — the status given at all levels of government to the acquisition of a primary residence; the clear tax advantage it is offered as an investment; and the substantial exemptions it receives when qualifying for the aged pension or aged care — are collectively skewing the judgments of individual older Australians to never consider the housing asset as a means of improving standards of living in old age.
This isn't perhaps a conscious aim of policy, but it is certainly where we have arrived at today. That is surely undesirable for individuals, and for the country.
The rest of this speech explains that view.
Whenever any aspect of housing policy is critiqued, the voice of populism quickly guides the media debate. Housing is that most sacred of cows.
This response does not serve the interests of older Australians.
It may simply reinforce fears of rampant reform, even though history would suggest no such thing has occurred in decades.
And fear is a serious political weapon.
But worse it prevents any thoughtful exchange on how to create, without putting individuals at risk, a mechanism by which older home-owners can retain their home and yet also draw on it for better living in their later years.
This should become the primary objective of considered commentary: how a retiree can learn to milk the sacred cow, rather than consume it; or worse still lose it.
Until this housing belief structure — created over generations - is altered, reforms in any part of retirement income and welfare swim against an almost impossible tide.
Shifting beliefs is hard work. More on that a little later.
Accompanying that private interest, we should have a clear view of the public interest.
A fiscal argument is often proposed.
While there's nothing undesirable with seeking to improve our fiscal circumstances as a consequence of also improving the welfare of individuals, it should be just that: a consequence, not an objective. The fiscal risk to future taxpayers — who, from this point on will be a diminishing proportion of the population - is well-demonstrated, including in our reports.
But the better course is to define the public interest as objectives that align with the private interest. These preferably would be:
- that with a different mindset and recognition of the asset value available to them, the pressure to pay for new or better aged care or health services on future taxpayers will diminish
- that relatively higher levels of consumption are available to retirees than would otherwise be the case.
On this latter point, relatively little attention has been paid to the potential for change in patterns of consumption in Australia over the medium term as the population ages.
Two facts stand out: older generations consume more publicly-provided services, where productivity is already known to be low and efficiency incentives are not strong; and their demand for privately-provided goods and services diminishes.
Forecasting the actual impact on consumption beyond those general direction type comments is likely to prove complicated. Many other factors will affect consumption in the economy at any single point in time in the future.
Nevertheless, the broad context is clear — there are going to be a lot more of us older, wealthier and (mostly) healthier than our predecessor generations:
- already one-quarter of us are aged over 55; inexorably, over the next thirty years we will more than double the number of persons aged over 65, to around 7 million by the middle of the century
- in 1909, the original age pension recipients generally had spent near enough to 75% of their life after the age of 15 in full-time work; for the baby boomers, that figure has fallen to about 60%; and for the generation today in high school, that figure will fall to around 50%, mostly based on significant health gains, including in retirement
- in 2012, there was roughly 1 person aged over 100 for every 100 babies born; by 2060, assuming nothing more than current improvements to longevity, there will be 25 such centenarians.
Yet the special incentives we apply as housing policy in this country were perhaps most appropriate for a quite different Australia: the Australia of the 1950s and 60s. We sought to encourage home ownership for a society then dominated by young couples — often with only one at work — and a big jump in births; while at the same time supporting a generation that had endured world wars and the Great Depression and so entered retirement with few assets and often poor health.
These policies have been successful in creating a deep attachment to home ownership, and in ensuring the majority of Australians now enter retirement with a very valuable asset.
Today, housing is the largest asset by value for households aged over 24.
About 70% of families own or are in the process of buying a home, a level stable for some decades.
Older Australians unsurprisingly have the highest value holdings of all.
Home equity per household was worth $480,000 for Australians aged 65-74 in 2011-12.
By comparison, after twenty years of saving, the median superannuation balance at age 60 for the comparable year was worth $95,000.
Yet despite its size, the housing asset is the very last to be drawn upon, if at all, almost regardless of circumstance.
It's a very big — and growing — asset to remain untouched during a long retirement.
In the last decade, household wealth on entering retirement has lifted significantly, about 30% on average, driven mostly by the housing asset.
As such, the lock-in of this level of wealth by the fastest-growing population cohort in a form that is intended to remain untouched for twenty years or more will, if unaltered, shift the obligation for maintaining consumption strongly towards younger people in the coming decades. At the same time, their tax obligations too may rise, as dependency ratios move against them.
We can say what the intentions of older Australians are because we have recently tested them.
One of the three reports in this series - Housing Decisions of Older Australians report, published last December - undertook a professionally-designed survey of older Australians. Being consistent critics of poor quality survey work at the PC, we made significant efforts to ensure that the results were reliable.
The most common answer across all the older age groups questioned in relation to potentially drawing down on housing was 'not under any circumstances'.
Offering some hope for future reform, some respondents also indicated it was possible that they may draw down on the housing asset for health or aged care expenditures.
But across the questionnaire, the clearest preference was to leave the house to their heirs as a bequest, with 88% support.
Further validation of individuals' desire to preserve the housing asset can be found in studies drawing on both the University of Melbourne's HILDA data base and on Centrelink data.
A particularly interesting study2 covering Centrelink data from 1999 until 2007 showed that at death residual wealth is equal to 90% of the amount recorded at first observation.
And that the even lowest income groups — where consumption is traditionally dominant - were net savers from a very early point in retirement.
Compounding the 'preserve at all costs' approach to the principal residence is invisibility.
There is very little by way of a trigger or incentive for older Australians to make themselves aware of the value of the asset and its ability to re-shape their lives in retirement.
A decision to down-size might be a trigger, but it is far less common than is often imagined.
The means test for the age pension might also be such a trigger, but by conscious design — i.e. exempting the home from consideration regardless of value - it is not. And the fearful complexity of dealing with government regulation — e.g. simply trying to assess whether this is a viable option in any one person's particular circumstances — also nudges any reasonable person only in one direction.
The one new factor that may force reconsideration is the catalytic effect of what might for effect be characterised as the arrival of 7 million 70 year-olds.
In years to come, this sizable group may ultimately see means tests incorporate the housing asset in some way. Future taxpayers may have no choice.
The idea of addressing big, medium-term shifts of this nature is pretty uncommon today. Kicking the can down the road (as they say in the US) is the common response.
But here we are dealing with policies that people rely upon to make serious long-term life choices. They deserve better than to wait til the inevitable imposes (possibly) quite sudden change.
Since I've just mentioned it, I should briefly outline what our reports have to say about making an adjustment to the means test for the Age Pension.
The detail is in the documents, the bottom line is this: today, complete removal of the exemption of the primary residence from the means test for the Age Pension would see a reduction in the proportion of older Australians receiving the Age Pension of 11 percentage points; and nearly 50% would incur a cut in their benefit.
That's big.
But — even if it had no other policy implications — such a change obviously runs strongly counter to the encouragement towards retention and enhancement of the principal residence that governments and society has so deeply embedded in us.
Perhaps, you might ask, there is a less bold option?
We looked at that too. Different parties will have different interpretations of the result. I'll leave you to determine yours.
We tested the concept of including in an assets test just the value of the home above the median value of homes in Australia ($440, 000) would see the proportion of older Australians who qualified for an age pension reduced by 2.5 percentage points, and reduce benefits for another 8% of recipients.
The generosity of scope allowed for owning a range of other assets - including financial ones - means in effect that adding a solid dollop of cash (i.e. the excess above $440,000) to the total asset test doesn't put many people over the threshold.
Of course, even small changes can have big fiscal numbers attached, so this isn't the end of the story.
In fact, the story is only complete when a change like this is examined in the context of its overall impact on incomes in retirement.
For that, the implications for availability of superannuation and aged care would also need to be examined.
One final point will illuminate this need to look at all retirement assets and income sources together if policy is to have its greatest chance to work for both the public and the private interest. It concerns superannuation balances.
Superannuation balances in future will definitely be higher than the median value ($95,000) I referred to earlier.
Could these be a better substitute for using the housing asset in retirement to improve quality of living?
The answer of course is of course yes, they might.
But the trend to acquire homes later in life and have unpaid mortgages on them at or near retirement is also now well-established, and will act as a counter-balance.
In 2011, 32% of Australians aged 55 to 64 were still paying off mortgages, double the rate of a decade previously. Some housing policy commentators suggest the numbers are even higher today.
And as our second report in this series established, when Australians today access their super in lump sum form, the single largest reason they do that is to pay off the mortgage, with 25% of retirees using it this way.
In the notes published with the invitation to speak today, there was a challenge posed : how to put the sacred cow to work, voluntarily.
In order to expect people to change their attitudes voluntarily, one initial step must be to provide better knowledge for retirees on the options available and the value accumulated.
There are good examples both locally and overseas of how, with better information and the ability to make better judgments, individuals change behaviour when conventional wisdom says change is unlikely.
Perth itself has a good example. Facing significant persistent step-changes in rainfall starting in the seventies and repeated in the nineties, local water authorities launched an initiative to put on the face of a water bill the water use of a household versus the average of equivalent households. This change alone — no price shift, just better information - yielded significant water savings for no additional cost.
Use of these kind of comparisons is now quite common across other utilities such as gas and electricity, here and overseas.
Another example: in the US, re-designing a letter to veterans to inform them that they had earned - rather than simply qualified for - education and career counselling benefits resulted in a 9% increase in take-up of the scheme.
Just the alteration of language can help provide a statistically significant variation in human behaviour.
In the UK, tax collections were lifted by targeted personal information campaigns telling people that their neighbours have already paid their tax.
Personal text messages reminding people to pay fines on time cut numbers of bailiff interventions by 150,000.
And a failing program offering subsidies for home ceiling insulation was turned around by offering to remove rubbish in lofts at cost price, a nudge towards the real reason people had failed to insulate their houses.
Giving people better information at a time when they have good reason to consider it and an incentive to do so is the crucial common element to these successes.
If we adopted a similar approach to alter perceptions of the family home during retirement, we might require that at the time of the first application for aged care benefits (simply accessing programs to obtain in-home support) a free valuation of the family home was offered.
There would be no obligation to use the information, just to gather it.
This could be complemented by an offer of free (accredited) financial advice as one of the optional benefits that comes with accessing in-home care.
Superannuation funds might, for example, be the sort of trusted party that could assist here.
A second nudge, in the parlance.
As with many behavioural economics concepts, the sheer novelty of this kind of approach makes it easy to treat with derision.
But most of these examples that I mentioned a moment ago had critics who doubted their ability to alter behaviour. Sometimes even after they achieved their notable successes.
Unusual problems like this — how to unwind the effects of risk perceptions and public policy designed for a different era — do require unusual thinking.
To close, let me note that the work published across the three papers I've mentioned today could be used to support a much wider, comprehensive review of sustainability of income during the retired years of all Australians.
We suggest a comprehensive review because it is probably the only way to generate the necessary public understanding that change may be needed; and what that might look like.
It might even offset populism.
The demographic changes we are entering into now are going to last into the long term, and will have an array of effects. We may not have the worst outlook in the world for ageing — some countries' populations are likely to contract — but that is hardly an argument not to pursue better policies when they are reasonably evident.
I hope I have also made it obvious that simply tugging on any one of the pieces of string so oddly entwined in this area is not likely to make the knots untangle.
The purpose of a review should be to ensure that no Australian lacks decent quality of life in old age, in a context of significant demographic shift.
A review of this kind can take the long view, and that is deeply desirable when the problem itself is easily put off. The political cycle is three years and the Forward Estimates are four years. Policy makers generally tend to be dismissive of change that might apply outside those time frames.
But setting a review now with intent to make change that applied later than the normal cycle is likely to generate more acceptance, and offer more scope for behavioural change and preparation, than any other approach.
1. An Ageing Australia; Superannuation Policy for Post-Retirement; and Housing Decisions of Older Australians. Return to footnote 1 2. Wu, 2015: see Housing Decisions of Older Australians. Return to footnote 2
Speech
Chair Danielle Wood presented to the National Conference on University Governance.
Download the speech
Read the speech
Thank you everyone for the opportunity to speak tonight. I am honoured to stand on the land of the Wurundjeri people of the Kulin Nation and I pay my respect their elders past and present. I extend that respect to any Aboriginal and Torres Strait Islander people in the audience today.
I’m sure it’s something of a cruel and unusual punishment making you sit through a speech on productivity before you get your dessert. I hope I can convince you that productivity is its own treat, and a substantial one at that. As the Nobel Prize winning economist Robert Lucas said: ‘Once one starts to think about [economic growth], it is hard to think about anything else.’ 1
But beyond (hopefully) convincing you that productivity matters, I want to focus on the unique role of universities as engines of productivity. And I will issue a challenge: for universities to step up their own productivity performance so as to deliver more of the research and quality teaching Australia needs for us to thrive in coming decades.
Productivity – why do we care?
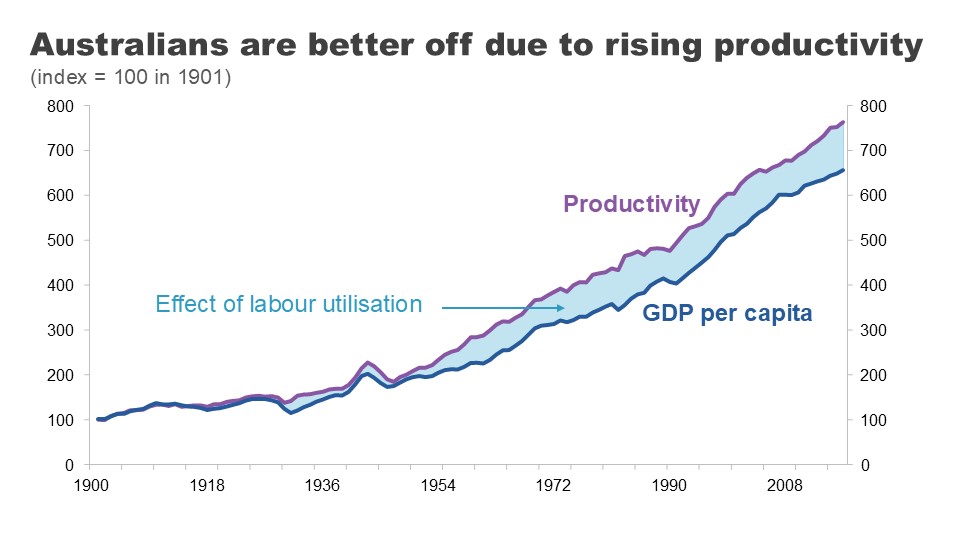
Productivity is about improving our living standards. If we can produce more goods and services using the same or fewer resources than before, that’s productivity growth.
And the effects of that growth over time are enormous.
In 1901 in Australia, it took 18 minutes of the average worker’s time to afford a standard loaf of bread. Today, it is just 4 minutes.’ 2
The productivity of our bread makers means that we can all consume a lot more bread – or for the carb conscious – spend that extra bread money elsewhere.
But it’s not just bread production that’s been revolutionised.
A theatre ticket cost an average worker 321 minutes of work in 1901. Today it’s 62. A bicycle? 473 hours in 1901 down to just 6 hours today.
And to put even today’s very real concerns about rental costs into perspective: the typical Australian worked 9 hours a week to afford a rental in 2019 but 20 hours in 1901.
Wherever you look, productivity progress has improved our capacity to deliver the goods and services that we value.
That productivity growth has seen real per person incomes improve by more than 700% since Federation, while giving us an extra 13 hours a week to ourselves.’ 3
But here let me engage with a common argument dismissing the importance of productivity. According to the doubters, this economic growth might deliver more ‘stuff’ but does not deliver better lives or improved wellbeing.
I would mostly disagree. It is certainly true that economic growth won’t tuck your kids into bed at night, but it has delivered at lot more than just extra bread or bicycles.
Growth is correlated with so many of the things we care about: longer, healthier lives, better education, more and more varied leisure time, and better and more stable political institutions.
Many of these things are supported by growth but they also support growth themselves. As I’ll explain shortly, this is very much the case with education.’ 4
That’s why it’s not surprising that richer countries tend to have higher average life satisfaction’ 5 and that those countries that experience sustained economic growth tend to see their average levels of satisfaction increase over time.’ 6
That said, economists recognise that growth is not a measure of everything we care about. Some things are hard to measure well, like the quality of care services. And important determinants of wellbeing like community involvement and quality of relationships are missed all together.
But no one can or should deny that growth matters.
Houston, we have a (productivity) problem
I don’t need to tell this audience that Australia’s recent productivity performance hasn’t been much cause for celebration.
Productivity went on a roller coaster ride during COVID.
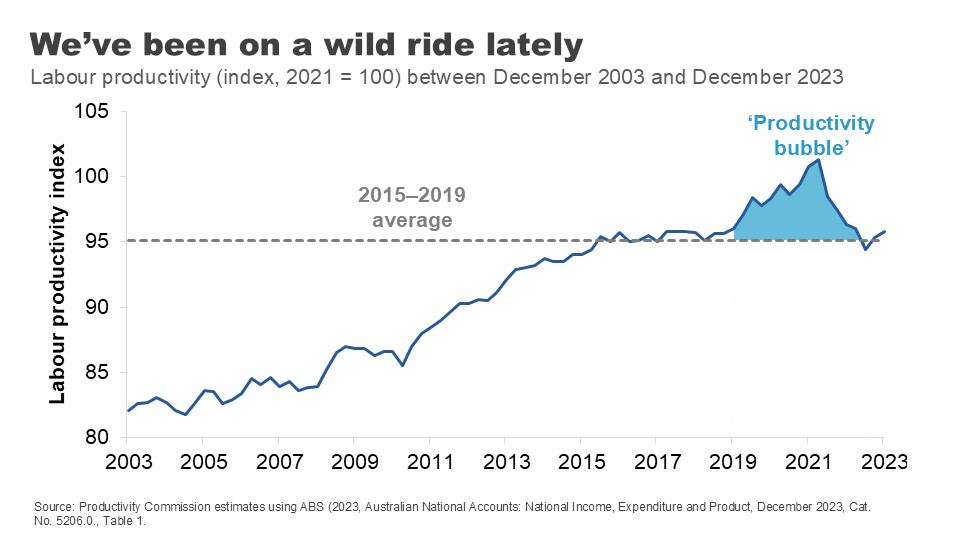
In the first two years of the pandemic, productivity rose strongly. This counterintuitive result was primarily because social distancing restrictions reduced hours worked the most in the lower-productivity services sectors.
But this productivity ‘bubble’ was in no way sustainable. After the end of restrictions in 2022, working hours expanded again in these sectors and pushed productivity in the opposite direction. The bubble burst.
The strong performance of the labour market through much of 2022 and 2023 has also put downward pressure on productivity during this period.
Now let me be totally clear: strong labour markets are great. But the surge in hours worked in the COVID recovery (coming from increased participation, lower unemployment and the re-opening of borders) was both quick and large. The capital stock has not kept up. The historical decline in the amount of capital per worker, has dragged on productivity because each worker has less capital – fewer or less efficient tools and resources – to help them do their jobs.’ 7
In some ways, the economy is like the cobra swallowing the ‘rat’ of the COVID shock. It will digest it, but it will take some time.
But this begs the question: what is the economy recovering to?
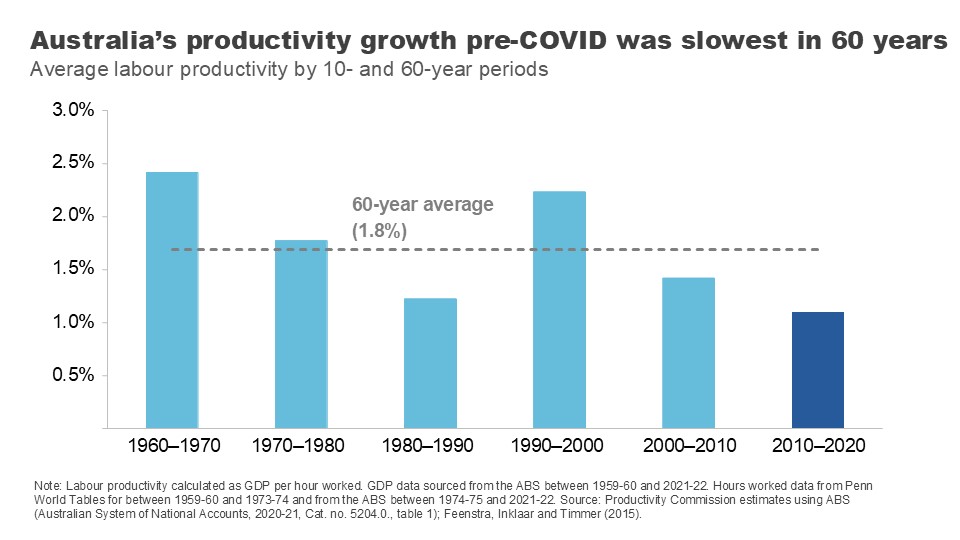
Even before our COVID rollercoaster, all was not well.
In the decade sandwiched between the GFC and COVID, Australia’s annual productivity growth averaged just 1.1% – the lowest of the last 6 decades and well below its 60-year average.
This slowdown in productivity growth is not just an Australian phenomenon.
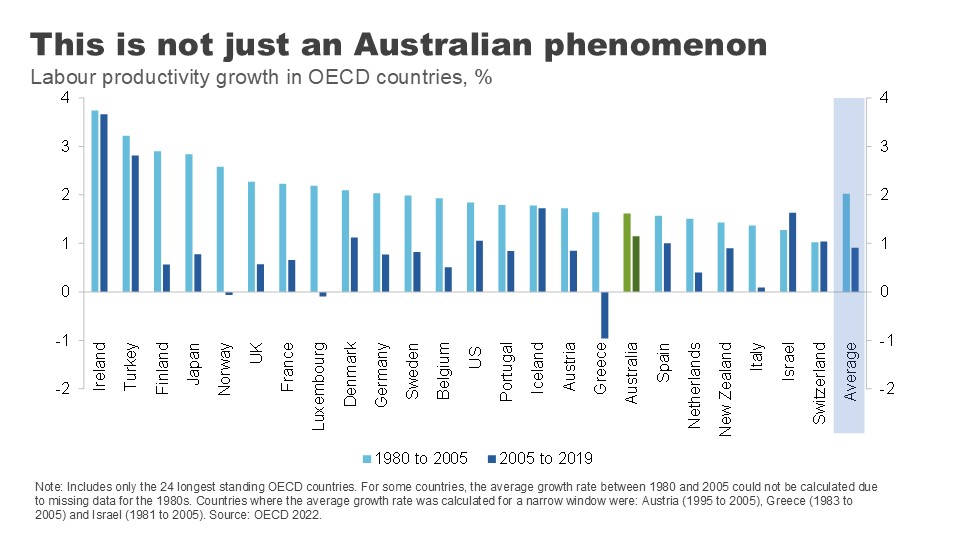
Almost every OECD country experienced a substantial decline in labour productivity in the 15 years prior to COVID, compared to the previous 15. Across the OECD, labour productivity growth halved in this period.
A range of credible explanations have been put forward to explain why: growth in the lower productivity services sector, declining gains from education, a smaller contribution from technological change, reduced economic dynamism, and increased risk aversion by business and capital owners.
But what I want to focus on here are two that are most relevant to our universities: declining gains from education and declining contribution from innovation. And then I want to address how the people in this room can help turn them around.
Universities are a powerful engine for productivity
Universities contribute a huge amount to our intellectual, social and cultural lives. But you’ve an invited an economist tonight so I’m naturally going to talk about the ways in which universities contribute to our long-term productivity performance.
There are, I think, three major channels:
- through building the skills and capacity of our future workforce – the so called ‘human capital’ of our population
- by generating and disseminating the research and ideas that lead to better processes and new and improved goods and services, and
- through building ties, understanding and goodwill with people from other nations, which contributes to ongoing integration – whether through trade, investment or the flow of ideas.
Tonight, I’m going to focus on the first two.
Boosting human capital
Let me start with the fundamental role that universities play in educating the population.
In the past 30 years, education levels across the Australian population have soared.
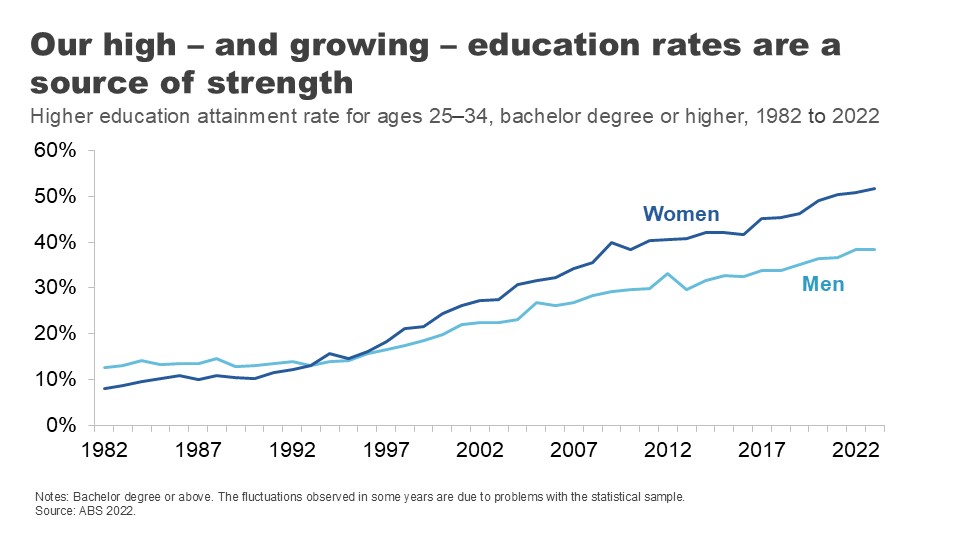
In the early 1980s, about one in ten 25–34-year-olds had a held a university qualification. Today, it’s 45%.’ 8
Part of this increase has been driven by a strong migration program that has encouraged skilled migrants to settle on our shores.’ 9 But it points as well to a large and sustained expansion in the number of Australians going to university.
Annual domestic student course completions have more than doubled since 1989, with nearly 140,000 students finishing a bachelor’s degree in 2021 and 87,000 finishing post-graduate study.’ 10
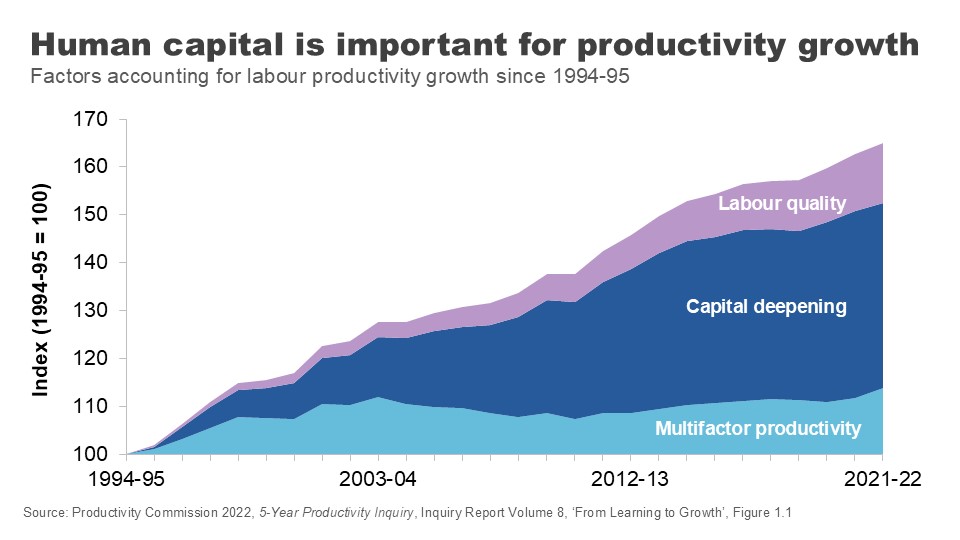
The resultant improvement in ‘labour quality’ has played an important role in productivity growth – particularly as other contributors have stalled.
University degrees are associated with better employment outcomes and higher earnings over people’s lifetimes – even after adjusting for individuals’ characteristics.’ 11
Although the graduate premium is in decline,’ 12 it is still significant across the lifetime.
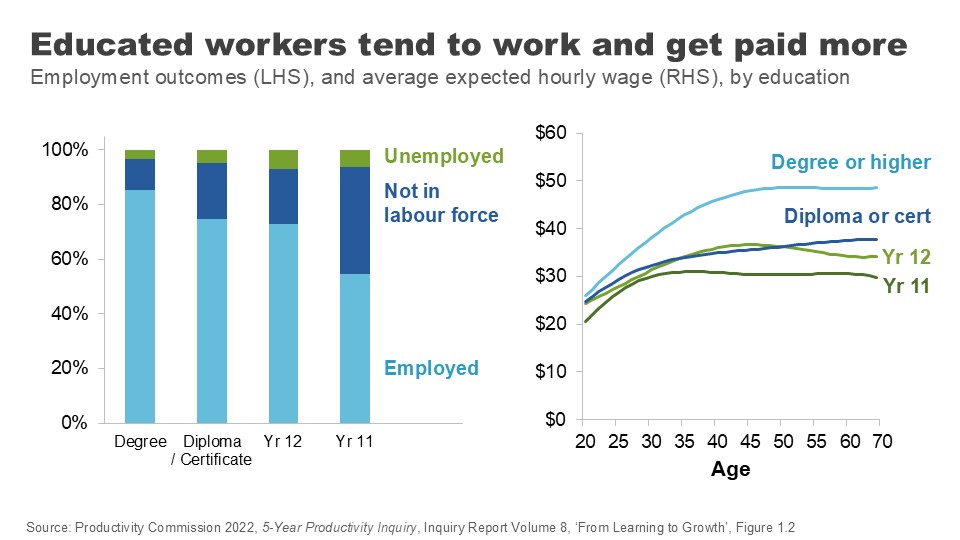
Higher levels of education in our working population improves wages and productivity through a few channels.
Most obviously, it improves the skills and abilities of our future workforce.
People who hold a tertiary qualification have higher cognitive performance than others their own age, even when you control for the fact that clever people tend to go on to study at higher levels. 13
Perhaps just as importantly, people with a higher education are more likely to do on-the-job training when they’re in the workforce – they’ve learned how to learn. 14 And there’s evidence going to university improves your non-cognitive skills, like sociability and your ability to cooperate or work in a team. 15
Education also improves people’s capacity to innovate. Increases in the supply of educated workers and managers leads to greater direct innovation by firms. Those educated workers are also more likely to adopt new innovations from elsewhere. 16
This link between education and an innovation mindset is critical if we are to supercharge the productivity upside from education, a point I will return to.
There are still gains to be eked out from expanding Australians’ access to higher education, despite the huge expansion over recent decades.
As the Productivity Commission noted in our 2023 Productivity inquiry, there is no evidence that we have reached the point where the cost of education for marginal workers outweighs the benefit received by them and by society. 17
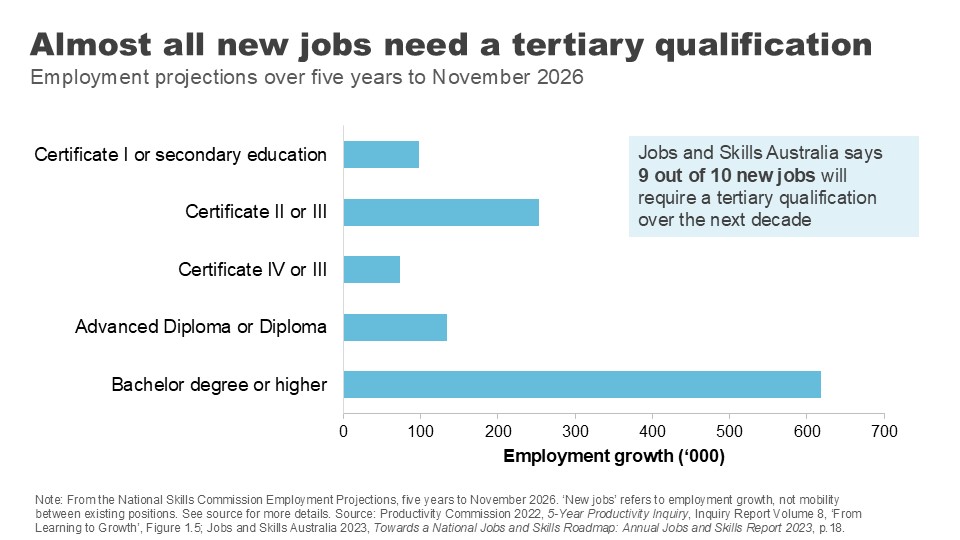
According to Jobs and Skills Australia, more than 9 out of 10 new jobs will require a post-school qualification over the next decade, and around 50% will require a bachelor's degree. 18
The recent Universities Accord argued governments should continue to promote participation in university and vocational education and set ambitious targets for governments to boost attainment rates by 2050.
The benefits of higher education are why the PC has supported a return to a system of uncapped demand driven funding. 19
But even with this potential upside, the huge ramp up in the education levels of the population will not be repeated. This means the contribution of gains from the quantity of education in the productivity numbers is likely to be more subdued in coming decades than in the previous ones.
This brings the quality of education into even sharper focus.
Education quality: levelling up
Improving education quality means improving outcomes for students for a given level of investment.
Which begs the question: how are we currently faring?
As already mentioned, university graduates have good labour market outcomes over the medium term compared with those who acquire skills via VET or school alone, even after adjusting for student characteristics.
Australian universities also perform well overall on student-assessed measures of quality. Indeed, the average university brings home a 76% – just scraping through with a distinction – on overall experience for undergraduate students. 20 On assessed teaching quality, it’s 80% – a solid mark. 21
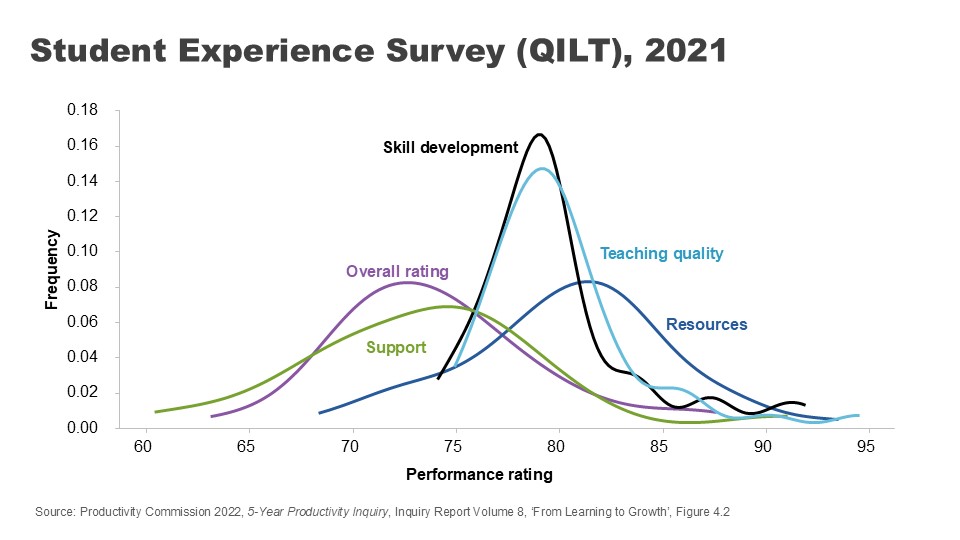
Further, on measures of employer satisfaction, overall satisfaction with graduates sits just below 84% and has remained strong over time. 22
But there are reasons to be vigilant.
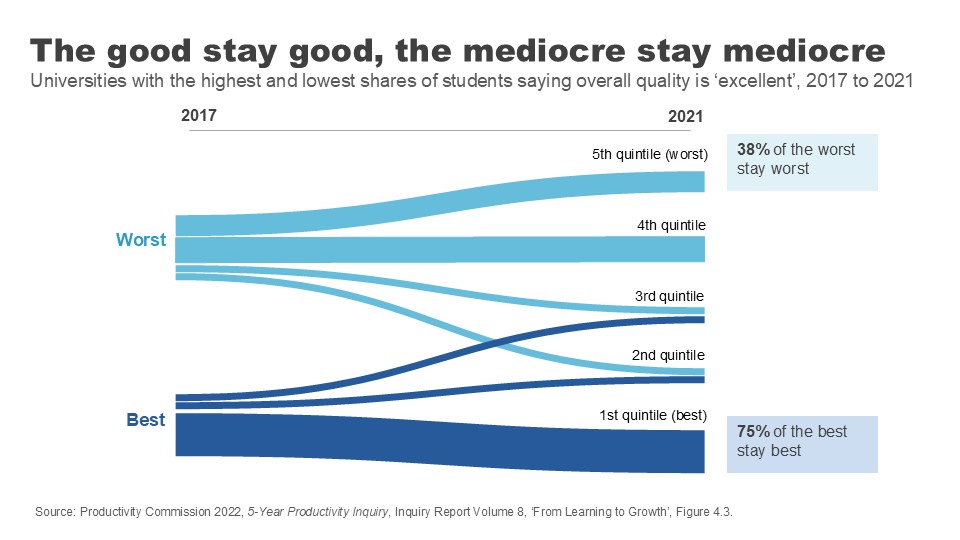
Despite the relatively strong average student-assessed quality scores, there is a fair degree of variation across institutions.
There is also stickiness in the outcomes data, suggesting a lack of course correction. Measured over a 4-year period, the universities that start with the highest share of students nominating their quality as ‘excellent’ tend to stay excellent, while those with the lowest shares also tend to stay at the bottom.
Employer satisfaction scores, while high overall, are stronger for foundational and technical skills than broader job skills like collaboration and adaptation. 23
And employers report much lower levels of satisfaction with the collaboration skills of graduates who study entirely remotely. 24 This matters because these ‘social skills’ are increasingly demanded by employers as a complement to technical skills. 25
More generally we need to consider the impact of online course delivery for student learning. The shift to online adds convenience and flexibility for students, but it comes with risk to quality.
Measures of learning engagement dropped when the pandemic hit our shores, and have not recovered since. 26
We may have jumped many of the initial hurdles to hybrid learning during those chaotic months of shutdowns, but not everyone has yet nailed the challenge of how to do online delivery well. A sea of blank Zoom screens is not ideal for either students or teachers.
More broadly, the Productivity Commission has noted the lack of direct incentive for teachers and universities to improve teacher quality.
We’re used to looking at star ratings when we book a hotel or a restaurant, but prospective students often don’t have good data when choosing between courses. 27
This lack of visibility combines with other factors – a general sense that teaching hold less prestige than research, government funding settings that fail to reward quality, and a lack of external oversight – to weaken the incentives for delivering the best teaching. 28
Of course, there are non-pecuniary incentives for individuals and institutions to teach well. And indeed, intrinsic motivations for excellence continue to steward high quality and innovative teaching practices at our universities.
But that is not enough to ensure that every teacher is delivering at a high standard.
The PC has put forward a range of recommendations for change. An important one is making lecture and course materials publicly available. Letting the public see behind your high walls would sharpen the incentives for quality teaching, allow students to make better decisions around what courses might match their interests and assist in lifetime learning – giving those not looking for an accreditation access to an endless supply of learning opportunities. 29
We need to ensure that teaching excellence is at the heart of our universities if we are going sustain the big improvements in quality needed for future productivity gains.
Promoting innovation
I want to turn now to another critical way in which universities impact our prosperity – in their role as vectors for innovation.
It is technological change that drives most productivity improvements over time. 30 And it is ideas that make technological change possible.
Economics Professor Daniel Susskind has argued that asking ‘how do we generate more growth?’ is essentially the same as asking ‘how do we generate more ideas?’.
And what are universities if not factories for ideas? 31
It is worth remembering that when we talk about ideas we are not just talking about the novel, frontier research that some of your researchers might be engaged in. ‘New to the world innovation’ is only around 1-2% of Australia’s innovation story. Diffusion – the application of existing knowledge to different businesses and contexts – is a crucial part of the innovation puzzle. 32
‘Innovation for the 98%’ must also be a focus of research efforts and graduate skills sets.
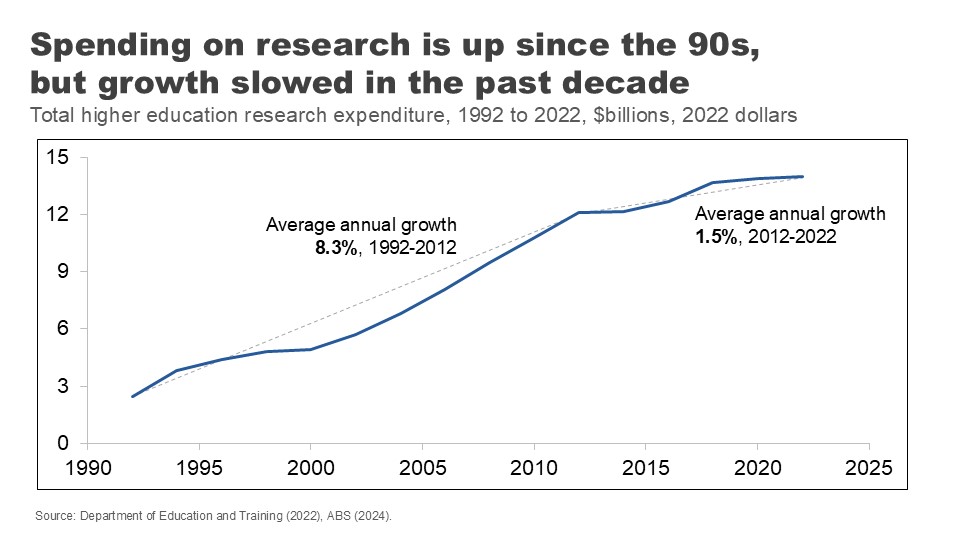
Universities spend more than they used to on research activity. Total university research expenditure has increased five-fold since the early 1990s – although growth has slowed somewhat in recent years.
This ramp up in spending over the past three decades is repeated across much of the developed world. But it has not generated the ideas boom we might have hoped.
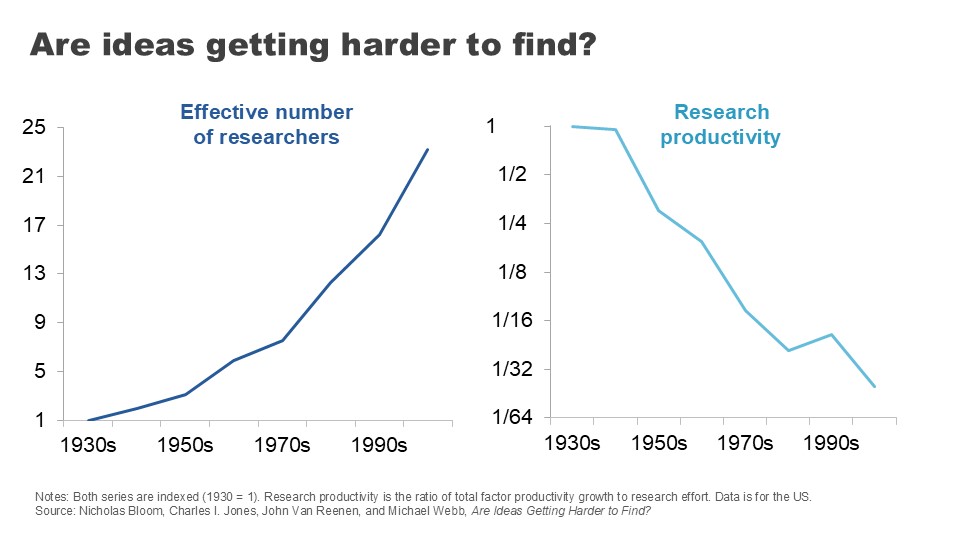
For example, if we turn to the US, we can see the number of people employed in research roles has grown 23-fold since the 1930s – a huge expansion in research effort. 33
But measured by the economic outputs of this research – the expansion in total factor productivity across the economy – the productivity of that research has declined 41-fold – or a growth rate of minus 5.1% per year on average. 34
This tale of more and more effort and for less and less return has played out across a range of innovation areas.
Take Moore’s Law: the tendency for the number of transistors fitted onto an integrated circuit to double every two years. It is, on the face of it, a remarkable testament to our capacity for innovation. But the number of researchers required to bring about this result has grown to be 18 times higher than it was in 1971. 35
Agricultural crop yields are improving at a relatively constant or slightly declining rate, but the number of agricultural researchers required to achieve this has doubled. 36
In drug discovery, the number of new drugs approved per billion on R&D halves every nine years or so, in a phenomenon that has been dubbed ‘Eroom’s Law’: Moore’s law spelled backwards. 37
At the heart of the slowdown in research productivity is that researchers inevitably solve the easier problems first – making gains harder once the lowest hanging fruit has been picked. Indeed, being ‘Better than the Beatles’ is a challenge that confounds across so many research areas. 38
But even noting this difficulty, there is still scope to improve the productivity of the research process in ways that could help generate and diffuse new ideas.
Australia is unusual in that university-led research makes up a relatively large percentage of our R&D expenditure. 39
As a share of GDP, our universities chip in more for research and development than universities in the US and Korea, and we’re well above the OECD average. 40
The good news is that our university research is top notch on academic metrics.
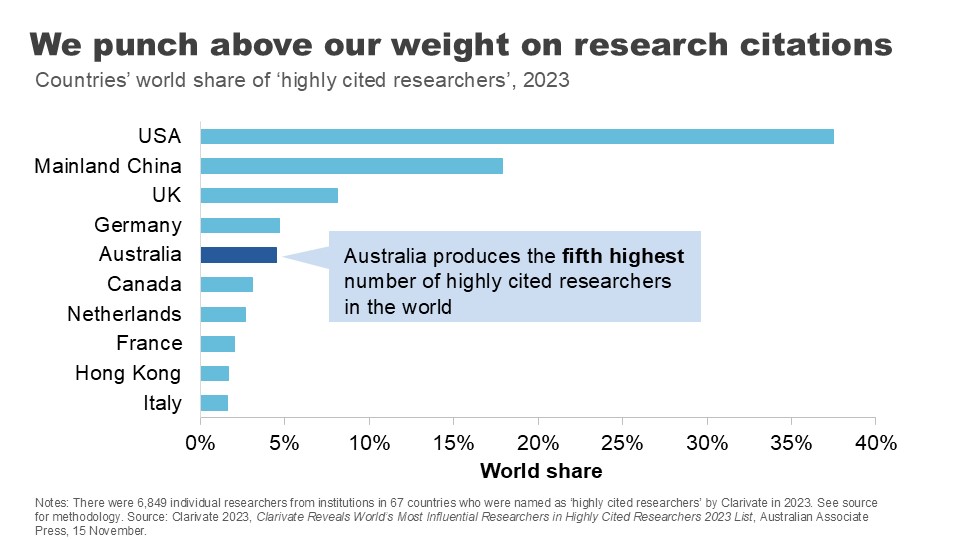
Despite our small population, we have the fifth highest number of highly citied researchers in the world. 41 And 84% of our research is rated at or above world standard. 42
Australian researchers also are more likely than those in the US or the EU to collaborate with international scholars, allowing us to ‘hoover up’ good ideas from overseas and apply them at home. 43
But there’s more we need to do.
There is a widely held view that Australian business collaboration with universities is poor. The perception is backed up in the numbers: data from the ABS suggests less than 10% of innovating firms got their ideas from universities between 2019 and 2021. 44
As much as policy makers say they want universities and business to ‘talk more’, clearly the incentives aren’t there to bring everyone to the table.
The Accord recognised the importance of nationally-relevant research in its recommendation for a new ‘Solving Australian Challenges Fund’ which would reward universities that apply their research capabilities to meeting Australia’s ‘big national challenges’. 45
Even where research turns up potentially useful ideas for Australian businesses or policy makers, we could do more to put them into practice.
Governments have long grappled with reducing barriers to research commercialisation – such as IP licencing and academic-spin offs or joint ventures – only partially successfully.
But the PC’s found we should be doing more to encourage knowledge transfers by encouraging labour mobility between industry and academia, and even by promoting joint conferences and networking events.
We can also help businesses tap into the experience and knowledge of academic researchers by reducing barriers to academic consulting, which is too often held up by administrative roadblocks. 46
There is also more to do on the productivity of the ideas generation process itself.
Long and expensive processes for grants can reduce ‘bang for buck’ and slow the research process.
US research on the peer-reviewed grant-making process concluded that the ‘tax’ of application processes may be up to 45% of researcher time. Further, these processes can skew or bias research efforts in a number of ways: towards more incremental research with a higher likelihood of surviving review than riskier or novel research; against interdisciplinary research; and towards researchers with a history of successful applications. 47
Certainly it does not take long for a conversation with Australian academics to degenerate into a similar set of complaints.
The recent Accord process suggested universities be paid for the indirect costs of applying for nationally competitive research grants, 48 and the Australian Research Council recently took the positive step of introducing an Expression of Interest round to its Discovery grant applications. 49
Future work may be necessary to explore alternative models like ‘science lotteries’ to continue tackling these challenges. 50
Where to from here?
I realise tonight I am speaking to a sector working through significant upheaval.
The COVID shock – the rollercoaster ride of closing and then reopening international borders with flow on effects for international student numbers – was obviously hugely challenging. Universities are on the frontline of a major technological change with the shift to online teaching and the growing adoption of generative AI in both learning and research.
Those challenges have been amplified by big and disruptive policy changes over a short period: first with the Jobs Ready Graduates package, then a suite of regulatory reforms to student migration settings, 51 and now the proposal for international student caps.
The Universities Accord process, a generally more constructive policy exercise, is also starting to flow through to policy. But it has raised fundamental questions about the university business model and the extent to which we can continue to rely on international student revenue to ‘cross subsidise’ research activity.
I am here tonight to say the payoff from getting the policy settings and the internal culture right are high. Universities hold in their hands two crucially important ingredients for national productivity: the skills of our labour force and the generation and diffusion of ideas.
Gains in both of these areas are becoming harder to come by. That might naturally push you to look for more resources. But I’m here to encourage you to also look for improvements via productivity at home.
Promoting teaching excellence, widely sharing learning, supporting research with Australian impacts and empowering students with an innovation mindset are just some of the ways in which Australia’s universities can shape a more productive future for Australia.
Footnotes
- Lucas RE Jr 1988, On the mechanics of economic development, Journal of Monetary Economics, Vol. 22, Issue 1, p.5. Return to text
- Productivity Commission 2023, 5-year Productivity Inquiry: Keys to growth, Vol. 2, Inquiry Report no. 100, Canberra, p. 6. Return to text
- Ibid., p.17. Return to text
- Susskind D 2024, Growth: A Reckoning, Penguin Books, United Kingdom. Return to text
- Sacks, D, Stevenson, B & Wolfers, J 2010, Subjective Well-being, Income, Economic Development and Growth, NBER Working Paper, No. 16441, October. See also Ortiz-Ospina, E. & Roser, M. 2013, Happiness and Life Satisfaction, Our World in Data, https://ourworldindata.org/happiness-and-life-satisfaction, (updated February 2024; accessed October 2024). Return to text
- Ortiz-Ospina, E & Roser, M 2013, Happiness and Life Satisfaction, Our World in Data, https://ourworldindata.org/happiness-and-life-satisfaction, (updated February 2024; accessed October 2024). Return to text
- Productivity Commission 2024, Quarterly Productivity Bulletin – June 2024, 27 June, Canberra. Return to text
- ABS 2023, Education and Work Australia, Table 35. Return to text
- See Norton, A 2023, Mapping Australian Higher Education 2023, ANU Centre for Social Research and Methods, for a discussion. Return to text
- Ibid., p.52. Return to text
- See Productivity Commission 2023, 5-year Productivity Inquiry: From Learning to Growth , Vol. 8, Inquiry Report No. 100, Canberra, pp.4-6, for a discussion of literature and controlling for cofounders. Return to text
- Brennan, M 2022, Productivity, Migration and Skills , ‘Rebuilding Australia’s Future’, Universities Australia Conference, delivered 7 July. Return to text
- Productivity Commission 2023, 5-year Productivity Inquiry: From Learning to Growth , Vol. 8, Inquiry Report No. 100, Canberra, pp.4-6. Return to text
- Ibid. Return to text
- Ibid. Return to text
- Ibid. Return to text
- Ibid, p. 3. Return to text
- Jobs and Skills Australia 2023, Towards a National Jobs and Skills Roadmap: Annual Jobs and Skills Report 2023 , Australian Government, October, p.18. Return to text
- Productivity Commission 2023, 5-year Productivity Inquiry: From Learning to Growth , Vol. 8, Inquiry Report No. 100, Canberra, Recommendation 8.4, p. 64. Return to text
- Quality Indicators for Learning and Teaching (QILT) 2023, 2022 Student Experience Survey , Department of Education, Table 1. Return to text
- Quality Indicators for Learning and Teaching (QILT) 2023, 2022 Student Experience Survey , Department of Education, Figure 1. Return to text
- Quality Indicators for Learning and Teaching (QILT) 2024, 2023 Employer Satisfaction Survey , Department of Education, Figure 1. Return to text
- Ibid., Table 3. Return to text
- Ibid. Return to text
- Brennan, M. 2022, Productivity, Migration and Skills , ‘Rebuilding Australia’s Future’, Universities Australia Conference, delivered 7 July. Return to text
- Quality Indicators for Learning and Teaching (QILT) 2023, 2022 Student Experience Survey , Department of Education, Figure 1. Return to text
- The PC recommended QILT data be refined and made more salient for prospective students. Productivity Commission 2023, 5-year Productivity Inquiry: From Learning to Growth , Vol. 8, Inquiry Report no. 100, Canberra, Recommendation 8.9, p. 111. Return to text
- Ibid., pp. 97-101. Return to text
- Ibid., Recommendation 8.9, p. 111. Return to text
- Williamson et al. 2015, Technology and Australia’s Future: New Technologies and their Role in Australia’s Security, Cultural, Democratic, Social and Economic Systems , Australian Council of Learned Academies. Return to text
- Susskind D 2024, Growth: A Reckoning , Penguin Books, United Kingdom, p.177. Return to text
- Productivity Commission 2023, 5-Year Productivity Inquiry: Innovation for the 98% , Vol. 5, Inquiry Report no. 100, Canberra. Return to text
- Bloom et al. 2020, Are Ideas Getting Harder to Find? , American Economic Review, Vol. 110, No. 4, pp. 1104-1144. Return to text
- Ibid. Return to text
- Ibid. Return to text
- Ibid. Return to text
- Scannell et al. 2012, Diagnosing the Decline in Pharmaceutical R&D Efficiency , Nature Reviews Drug Discovery, Vol. 11, No. 3, pp. 191-200. Return to text
- Ibid. Return to text
- O’Kane, M. et al. 2024, Universities Accord: Final Report, Australian Government, Figures 30 and 31. Return to text
- Ibid. Return to text
- Ibid, p.192. Return to text
- Ibid. Return to text
- Ibid. Return to text
- Productivity Commission 2023, 5-year Productivity Inquiry: From Learning to Growth , Vol. 8, Inquiry Report no. 100, p.49. Return to text
- O’Kane, M. et al. 2024, Universities Accord: Final Report, Australian Government, p. 299 Return to text
- Productivity Commission 2023, 5-Year Productivity Inquiry: Innovation for the 98% , Vol. 5, Inquiry Report no. 100, Canberra, Recommendation 5.4, pp. 50-52. Return to text
- See Sharma, I. et al. 2022, Piloting and Evaluating NSF Science Lottery Grants: A Roadmap to Improving Research Funding Efficiencies and Proposal Diversity , Institute for Progress, 2 February, for a summary. Return to text
- O’Kane, M et al. 2024, Universities Accord: Final Report, Australian Government, p. 216-217. Return to text
- Australian Research Council 2023, Discovery Projects Scheme: Two-stage Application Process , 30 October, https://www.arc.gov.au/news-publications/media/feature-articles/discovery-projects-scheme-two-stage-application-process (accessed October 2024). Return to text
- Sharma, I et al. 2022, Piloting and Evaluating NSF Science Lottery Grants: A Roadmap to Improving Research Funding Efficiencies and Proposal Diversity , Institute for Progress, 2 February. Return to text
- Norton, A. 2024, Australia made 9 changes to student migration rules over the past year. We don’t need international student caps as well , The Conversation, August 5. Return to text
Related
