Human services: The next wave of productivity reform
Speech
Commissioner Stephen King delivered the Queensland Productivity Commission (QPC) Productivity Lecture in Brisbane on 8 November 2019.
Download the speech
Read the speech
Introduction
More than 25 years ago, the report on National Competition Policy, otherwise known as the Hilmer report, kicked off a wave of productivity reform. It was centred on government-owned monopolies in key infrastructure industries, including telecommunications, transportation and energy. The report recognised that:
[i]n the case of many public monopolies … protection from market forces through government regulation or other government policies has often allowed enterprises to develop structures unlikely to be found under normal market conditions.1
This is a polite way of saying that these sclerotic government monopolies had high costs, low innovation and were a drag on Australia’s productivity. Reforms flowing from the Hilmer report transformed these key infrastructure industries and helped underpin almost three decades of economic growth in Australia.
In my opinion, we are at the beginning of a similar wave of productivity reform in human services. Like the public monopolies considered by the Hilmer report, human services operate in markets that are anything but normal. They are dominated by government expenditure, regulation and, for some services, government provision. For many human services, consumers are disempowered, competition—if it exists—is managed, and incentives are distorted. In some areas, markets have been designed for the benefit of providers rather than consumers, and innovation is discouraged. Funding is often based on inputs or block grants rather than outcomes and where markets involve multiple levels of government, services either overlap or are missing.
In this talk, I will briefly outline why productivity reform to human services is important, why it is needed, some lessons for system wide reform and the potential benefits that can be gained from reform.
What are human services?
The problem with talking about human services as the next wave of productivity reform, is that it is far from clear what we are talking about. The definition of ‘human services’ is, at best, vague.
In Australia, the term refers to a group of services.2 But which ones?
Unfortunately, the answer is unclear. The 2015 Competition Policy Review chaired by Professor Ian Harper doesn’t help much.
The human services sector covers a diverse range of services, including health, education, disability care, aged care, job services, public housing and correctional services.3
But is this the right list of human services?
Similarly, when the Commonwealth Government asked the Productivity Commission to look at reforms to human services, it didn’t actually define the term.
The human services sector plays a vital role in the wellbeing of the Australian population. It covers a diverse range of services, including health, education and community services, for example job services, social housing, prisons, aged care and disability services.4
And I am sad to say that the Productivity Commission did not rectify this omission in our report. Rather we simply noted that “[t]he terms of reference for this inquiry do not define ‘human services’, or provide a definitive list of which human services are within scope”.5
So, I will be pragmatic. I am interested in productivity gain and government influence. And I am from the Productivity Commission. And each year the Commission puts out a Report on Government Services that covers six broad areas: Childcare, education and training; Justice; Emergency management; Health; Community services; and Housing and homeless. If we are going to define human services by a list of services to the community that centre around government, then that list is a pretty good starting point. So, at least for this talk, human services will be defined by these six areas.
Why do these services matter from a productivity perspective?
There are at least four reasons why we care about this list of services.
First, these services are a substantial part of Australia’s economic activity. Even if we exclude housing, these services make up around 20% of our national output, with education at around 6% and Health at around 10% of GDP.6 So improving productivity in human services can impact a large part of the economy.
Second, these services matter for the wellbeing of many people. This is rather obvious for services like housing, health and education. Even without government expenditure in these areas, private markets for these services would still exist, and they continue to exist, and in some cases thrive, despite government intervention and expenditure. For example, in education, about one-quarter of all expenditure is non-government.7 In health, the equivalent number is about one-third.8 And in housing, private expenditure and ownership dominates. There are about 20 private dwellings for every social housing dwelling.9
Another way to see the importance of these services is to note how they are accessed over an individual’s lifetime. As the Commission noted in its final report on Human Services:
[E]veryone will access human services in their lifetime, including children, the elderly, people facing hardship or harm, and people who require treatment for acute or chronic health conditions.10
So, improving productivity in human services will benefit all Australians.
Third, these services provide critical underpinnings for our society. As the Commission’s 2018 report into inequality in Australia showed, in-kind transfers—which are basically human services—significantly reduce the level of inequality in Australia. Technically, they reduce the Gini coefficient of inequality from about 0.25 for private consumption to around 0.2 for final consumption. By way of comparison, they have a larger impact on reducing inequality (as measured by the fall in the Gini coefficient) than our progressive income tax system.
So, improving productivity in human services helps to reduce inequality in Australia.
Finally, despite the significant levels of private expenditure, each of these services involves substantial amounts of government expenditure and in each case the government is intimately involved with the production and the consumption of the services. The nature of a service market fundamentally changes when over half of the expenditure on a service is derived from government. But that is the case for each of these human services.11 Who gets this funding, and how they are allowed to use it, matters.
In summary, if we want to find productivity gains for Australia, looking at a set of services that make up around one-fifth of our output, are consumed by a wide variety of people, are particularly important for those who are struggling, and have a high level of government involvement, are a pretty good place to start. Human services fit these criteria.
The problems
Human services markets face a range of distortions that limit productivity and effectiveness. These differ between services. However, they fall under four broad categories—failure to define what the service is meant to achieve; failure of service design to achieve the desired objectives; failure to implement the designed service effectively in the real world; and failure to measure the service outcomes. Put simply: objectives, design, implementation and measurement.
Unclear objectives
The objective for human services can be unclear. While a ‘high level’ objective may be easy to state—such as ‘user choice of medical service’, ‘educating our children’ or ‘community safety’—these high-level objectives can mask complex and conflicting elements.
For example, in its draft report on Imprisonment and Recidivism , the Queensland Productivity Commission noted the complexity of ‘community safety’.12 They noted that it involves a time frame—presumably over the longer term. It involves a requirement for the justice system to meet “community expectations about justice and fairness”. It has to be cost effective, with the benefits outweighing the costs. And it must operate within resource constraints using the tools of deterrence, detention and rehabilitation.
‘Community safety’ is really a set of multiple objectives.
Having multiple objectives for human services is not a problem by itself, so long as the objectives are clear and it is understood how conflicts between objectives will be resolved. 13 However, when objectives are unclear or unstated, then someone will need to make decisions about which objectives are pursued. Often this will be the service provider. To the degree that these decisions are not aligned with either government objectives or user preferences, service effectiveness is compromised.
For example, as the Commission found for end-of-life care services, the ambiguity in objectives means that clinicians are often placed in a situation to make judgements about the location and nature of care, and that these decisions, while medically appropriate, are often not in line with the preferences of the service users. The result is unwanted treatment and death in hospital rather than home.14
Poor design
A human service can only achieve the desired outcomes if the delivery system is well designed. But market design is hard. Getting the right incentives for governments, service providers and users can be difficult even if the objectives are clear.
Let’s start with government.
The Commission’s recent draft report into the mental health system notes how design problems can arise between governments:
The division in mental health care responsibilities between the Australian Government and State and Territory Governments has led to service gaps. … These gaps result from two key factors. First the relevant roles and responsibilities are unclear. Second, State and Territory Governments face incentives to direct resources towards acute care instead of providing more care in the community.15
Mental health is not the only example of these problems and having either service gaps and/or overlapping services can reduce service effectiveness, increase costs and lower user outcomes.
Service providers also need to face the correct incentives. For example, under the jobactive program, unemployed Australians are supposed to be assisted by a service provider to find employment. But the service providers face conflicting objectives—both to assist their clients to find work but also to monitor client compliance with the mutual obligation requirements of the program. As a result, some clients find their providers acting as barriers to finding employment.16
Unfortunately, poor incentives for service providers are common in human services.
Finally, service users need to be motivated to use the ‘right service at the right time’. But this is often not the case. For example, in healthcare, people are sometimes driven by price to access healthcare through a hospital rather than a community-based service—despite the community service having a far lower cost to the taxpayer.
The failure in human services to design user-centred programs results in poor outcomes and high costs.
Failure of implementation
A well-designed human service still requires practical implementation. But to quote the Scottish poet Robert Burns, “The best laid schemes o' mice an' men Gang aft a-gley”.
This holds for human services. Unless carefully implemented, well-designed human services programs can fail to meet their objectives.
For example, the National Disability Insurance Scheme (NDIS) is a well-designed program that empowers some of the most disadvantaged people to access the services they need, when and where they need them.
But the roll out of the NDIS has been problematic due to overly optimistic timing for users to receive their plans and for service providers to expand to meet demand. The Productivity Commission concluded that the “focus on participant intake has compromised the quality of plans and participant outcomes” and that “the rollout timetable for participant intake will not be met”.17 The Commission also noted that there are significant workforce shortages in some areas. The National Disability Insurance Agency has responded by using price controls to try and balance the availability of services and value for service users. The results, predictably, satisfy no one.
Failure to measure
Finally, there is the failure to measure.
Measurement, by itself, has no value. It is simply data. The issue is what to do with this data.
Outcome measurement is a key input to two key aspects of human services—evaluating the services to work out what works and informing consumers so they can best match their requirements with the services that are supplied.
On the former, in the Commission’s recent draft mental health report, we note that the success of our proposed reforms will:
depend on the creation of a strong, evidence-based feedback loop so that program effectiveness can be evaluated with the results being used to help determine which activities are funded in the future.18
On the latter, in our report on human services, we note that publishing outcome information on hospitals and specialists, as already occurs in some countries, can improve productivity by helping consumers locate the best services and, most importantly, by encouraging service providers to benchmark themselves and work to improve their performance.19
Unfortunately, at present, measurement, publication and evaluation of outcome data is rare.
Fixing the problems to raise productivity
So, we have four problems—objectives, design, implementation and measurement.
It would be nice if I could now offer a simple formula to address these problems and raise productivity in one-fifth of our economy. But there is no simple formula. Human services differ on many dimensions and solutions must be service specific. However, we can identify some broad approaches to reform.
A good starting point to address the problems and reform human services is the separation of functions.
The Harper report, in its Recommendation 2, suggested a three-way split of functions in human services, “separating the interests of policy (including funding), regulation and service delivery.”
I would add a fourth separate function—evaluation.
This four-way split lines up with the core problems that beset human services. Policy means defining objectives and sources of funding. What are governments trying to achieve and who is responsible for funding what? Regulation is about service design. How are the correct incentives put in place for all participants and how are the rules enforced? The regulatory body interacts with the service providers in implementing the relevant service delivery models. And the loop is closed through independent evaluation based on outcomes to determine what works and what doesn’t.
Having a clear separation of the four functions—policy, regulation, service delivery and evaluation—creates clear lines of accountability. It also reduces the potential for undesirable interactions between these roles.
To see this, let’s return to the earlier wave of infrastructure reforms in Australia.
The Hilmer inquiry, when looking at government infrastructure monopolies, noted the inherent conflict between having commercial and regulatory functions in the same organisation.20 Indeed, those of you who have grown up post-Hilmer would find absurd the idea that a telecommunications company could also be the telecoms regulator, or an electricity supplier could be the energy regulator. But in the 1980s, that was the norm. The gamekeeper was the poacher.
In human services today, similar conflicts exist, for example where block-funded service providers decide what services will be delivered, where and when. Or government policy makers determine not just what services should be provided but specify who will deliver them. Or where service providers get to evaluate the services they deliver. Or where a government department both designs and delivers a service, regulating itself.
How can separation work?
In the Commission’s draft report into Mental Health, we recommend clear separations between the four functions.
Policy is the role of government. In Australia, this means both the Commonwealth and the State and Territory governments, and we recommend that the Council of Australian Governments (COAG) develop a National Mental Health and Suicide Agreement to make funding and responsibilities clear. There also needs to be a National Mental Health Strategy to establish nationally consistent policy.
Implementation and regulation would remain divided across the health system. For primary care, the existing Medicare system provides incentives that, while imperfect, appear to involve less bureaucracy and more effective service delivery than the alternatives. For high intensity and complex clinical care, and non-health supports, our preferred position is that new Regional Commissioning Authorities are established to determine what is needed at a local level, then to commission evidence-based services to meet these local needs. Together, this provides an implementation approach for stepped-care services across Australia.
For service delivery, service providers would be diverse. They would include private practitioners such as for GPs and psychologists; for-profit companies such as some hospitals and clinics; not-for-profit organisations, such as providers in social housing and disability services; and government bodies, including schools and correctional facilities.
And finally, the Commission recommends that the National Mental Health Commission is expanded to not just monitor the mental health system, but also to evaluate services to determine what works—and what doesn’t—and report these results back to government.
A second broad approach to human services reform is timing.
Different reforms need to proceed at their own pace. There are many changes which can be implemented relatively quickly to improve the outcomes for human services. For example, in the Productivity Commission’s Human Services Report, we note that some human services, such as public dental services, exist in much larger private markets. Shortages in these services can be addressed relatively quickly by policy makers moving away from models that falsely assume that government funded services must be separated from these private markets. Similarly, in primary care, simple changes to GP referrals for specialist care can empower consumer choice (Recommendations 10.1, 10.2 and 10.3).
However, for other reforms, time is needed to test alternative models and allow for adjustments. For example, consumer outcomes can be improved by increasing public medical data and releasing risk‑adjusted information on the clinical outcomes achieved by individual specialists. But this reform needs to be implemented carefully over time to avoid incentives for practitioners to alter their mix of consumers in order to artificially raise their measured performance. Nonetheless, models exist in both the US and the UK for such reporting and in both countries public reporting has been found to save lives.21
Unfortunately, without appropriate leadership from government, neither the short-term nor the long-term gains will be realised.
A third broad approach to human services reform focuses on the policy objective. As an economist, the objective is relatively straight forward. The overriding objective should be the outcomes for the consumers who receive the services. And, in general, the consumers themselves are best placed to judge whether desirable outcomes are being achieved.
While focusing on user outcomes might appear obvious to an economist, it is foreign in many areas of human services.
For example, in health, success is often judged by clinical outcomes rather than the quality of the consumer’s life. While this is slowly changing and patient reported outcome and experience measures—PROMs and PREMs—are becoming more accepted, there is still a culture that the clinician knows best.
And when talking with service providers in a range of areas, including aged care, indigenous services, and disability services, I have been surprised how some providers consider that the service system needs to be designed for their benefit, rather than addressing what the consumers want. When challenged, the providers either appeal to costs—that it is too expensive to gear services to consumers’ preferences—or paternalism—that the providers know what is best for the consumers.
Moving from a ‘provider knows best’ to a consumer-centred approach is critical to improving productivity in human services. A system that produces lots of what isn’t valued is unproductive.
The Harper Review took one approach by recommending that “[u]ser choice should be placed at the heart of service delivery” (recommendation 2). User choice drives innovation and productivity in competitive markets. It leads producers to supply what consumers want. But as that Review noted, user choice and competition are not always possible in human services markets. For example, in health markets, consumers often rely on the judgement of professionals. In corrections, I am not quite sure what ‘user choice’ means. And in rural and regional areas, user choice is often limited by markets that are too thin to support multiple suppliers.
However, there are two other tools to improve consumer focus. The first is to ask consumers what they want, by including consumer input in service design, and codesigning the objectives of the relevant services. The second is measuring and evaluating outcomes. The only way to ensure human service outcomes are consumer focussed is to check.
What are the potential gains?
What are the potential gains from reforming human services?
They make up a large part of our economy, and the current approaches to delivering these services appear, at least to an economist, to fall well short of a desirable, far less an optimal, system. But how big are the gains from reform?
We need to place some caveats on this question.
First, there are differences between gains that are measured in national accounts and those accruing to society. This is stark in human services, where the measured inputs and outputs may be modest, while the unmeasured transformation to the lives of individuals and families can be far greater.
Second, even for measured data, the gains may be indirect. A poor education system may cost the same as a great system. The productivity gains of education reform may not be obvious in the directly measured numbers. Rather they are reflected in the improved productivity of the workforce into the future.
With these caveats in mind, what are the benefits of human services reform?
There is little independent evidence on the economic gains from broad-based human services reforms. This is not surprising. Most analysis is based on specific interventions for particular services.
Where a broader reform is examined, care must be taken when bringing it into the Australian context. For example, in 2009, when Chair of President Obama’s Council of Economic Advisers, Christina Romer estimated that slowing the growth of health care costs in the US by 1.5% would increase US real output by about 2.5% by 2020 and by 8% by 2030.22 These are huge numbers but have to viewed with caution. They may say more about the state of healthcare and politics in the US than provide any lessons for Australia.
The Productivity Commission suggested some modest reforms in health and estimated the potential gains in our five-year productivity review.
The net present value of the future stream of economic impacts over twenty years is estimated at about $140 billion (in 2016 prices).23
Much of the benefit would be personal gains to those who access healthcare. But even direct economic gains would be significant with potential gains of “over $4 billion a year” to GDP and potential reductions in long term government health expenditure of over 6%.24
However, with broader reforms, the gains are likely to be higher. For example, the Productivity Commission’s draft Mental health report, estimated that mental illness costs Australia around $180b per year, with around $50b of this being a direct economic cost of reduced productivity. Even reducing this economic cost in one part of the health system by 10% leads to a $5 billion per year gain to the economy While we have not measured the net gain of our full reform program at this draft report stage, the inefficiencies are stark and the benefits of economy wide reform in mental health will be in the tens of billions of dollars over the longer term.
When the Industry Commission examined the potential gains from the National Competition Policy reforms, flowing from the Hilmer report, it estimated that “in the long run, once all adjustments have taken place, there would be an annual gain in real GDP of 5.5 per cent …”.25 Broad reforms to improve Human Services could lead to similar economic gains, and potentially much greater gains to the lives of many Australians.
Conclusion
Human services make up around 20% of Australia’s economy. And they are ripe for reform. It will take effort—including coordination and cooperation across different levels of government. It will require careful planning including making sure that systems are robustly designed and implemented carefully. It will require increased consumer involvement—either through expanding user choice or through co-design. And it will require clear outcome objectives with data being collected and assessed to make sure that these objectives are being met. In other words, human services need reform across four dimensions: objectives, design, implementation and measurement.
These reforms will not be easy. There are vested interests who will fight reform. But this was the case with the reforms to infrastructure following the Hilmer report. And just like in that earlier wave of productivity reform, there will be mistakes. But that is not a problem where the reforms are robust, and mistakes are recognised and rectified. And, as with the earlier wave of reforms, human services reforms are worth it. Not only will they raise our measured productivity, they will significantly improve the lives of most Australians.
Footnotes
1 Hilmer, F., M. Rayner and G. Taperell (1993) National Competition Policy, Commonwealth of Australia, p.216 Return to text
2 In contrast in the US, according to www.humanservciesedu.org the term human services is used to refer to a set of occupations “designed to help people navigate through crisis or chronic situations”. Return to text
3 Commonwealth of Australia (2015) Competition Policy Review, Final Report, p.218. Return to text
4 Terms of reference: Productivity Commission Inquiry into introducing competition and informed user choice into human services (29 April 2016). Return to text
5 Productivity Commission (2016) Introducing competition and informed user choice into human services: Identifying sectors for reform, Study Report, Commonwealth of Australia, p.34. Return to text
6 These figures ignore activities, such as unpaid care provided by voluntary carers including friends and family. This care can be substantial. For example, in its submission to the Productivity Commission’s 2016 Study Report, Carers Australia (submission 259) stated that “[i]nformal carers are major contributors to the human services sector—an estimated 2.7 million family and friend carers provide almost 2 billion hours of care each year.” Return to text
7 Rice, J.M., D. Edwards and J. McMillan (2019) Education expenditure in Australia, Australian Council for Education Research, published July 24. Return to text
8 Australian Institute of Health and Welfare (2019) Health expenditure Australia 2017–18, Health and welfare expenditure series No. 65, Cat No. HWE 77, Canberra. Return to text
9 The number of social housing dwellings is around 436,213 from the Australian Institute of Health and Welfare (2019) Housing assistance in Australia 2019, Cat No. HOU 315. The number of private dwellings is extrapolated to approximately 9m from the ABS numbers from the 2011 census which gives about 7.76m private dwellings in 2011. Return to text
10 Productivity Commission (2017) Introducing competition and informed user choice into human services: reforms to human services, Inquiry report, No. 85, October, p.3. Return to text
11 For housing, I am restricting attention to public housing (including social housing) and homeless services. Return to text
12 Queensland Productivity Commission (2019) Inquiry into imprisonment and recidivism, Draft Report, February, p.9-10. Return to text
13 See for example, Productivity Commission (2016) Introducing competition and informed user choice into human services: Identifying sectors for reform, Study Report. Commonwealth of Australia, p.38. Return to text
14 Productivity Commission (2017) Introducing competition and informed user choice into human services: reforms to human services Inquiry report, No. 85, October, chapter 3. Return to text
15 Productivity Commission, (2019) Mental health, Draft Report, November at p.928. Return to text
16 See: The Senate Education, Employment and references Committee (2019) Jobactive: failing those it is intended to serve, Canberra, February at chapter 7. Return to text
17 Productivity Commission (2017) National disability insurance scheme (NDIS) Costs, p.12. Return to text
18 Productivity Commission, (2019) Mental health, Draft Report, November, p.42. Return to text
19 Productivity Commission (2017) Introducing competition and informed user choice into human services: reforms to human services, Inquiry report, No. 85, October, chapter 11. Return to text
20 Hilmer, F., M. Rayner and G. Taperell (1993) National Competition Policy, Commonwealth of Australia, p.217. Return to text
21 Productivity Commission (2017) Introducing competition and informed user choice into human services: reforms to human services, Inquiry report, No. 85, October, chapter 11. Return to text
22 Romer, C. (2009) The economic case for healthcare reform, Commonwealth Club, June 8. Return to text
23 Productivity Commission (2017), Impacts of health recommendations, Shifting the dial: 5 year Productivity Review, Supporting Paper No. 6, Canberra, p.6. Return to text
24 Productivity Commission 2017, Impacts of health recommendations, Shifting the dial: 5 year Productivity Review, Supporting Paper No. 6, Canberra, p.7. Return to text
25 Industry Commission (1995) The growth and revenue implications of Hilmer and related reforms, A report by the Industry Commission to the Council of Australian Governments, Final Report, Canberra, March at p.53. Return to text
Speech
Chair Danielle Wood presented to the National Conference on University Governance.
Download the speech
Read the speech
Thank you everyone for the opportunity to speak tonight. I am honoured to stand on the land of the Wurundjeri people of the Kulin Nation and I pay my respect their elders past and present. I extend that respect to any Aboriginal and Torres Strait Islander people in the audience today.
I’m sure it’s something of a cruel and unusual punishment making you sit through a speech on productivity before you get your dessert. I hope I can convince you that productivity is its own treat, and a substantial one at that. As the Nobel Prize winning economist Robert Lucas said: ‘Once one starts to think about [economic growth], it is hard to think about anything else.’ 1
But beyond (hopefully) convincing you that productivity matters, I want to focus on the unique role of universities as engines of productivity. And I will issue a challenge: for universities to step up their own productivity performance so as to deliver more of the research and quality teaching Australia needs for us to thrive in coming decades.
Productivity – why do we care?
Productivity is about improving our living standards. If we can produce more goods and services using the same or fewer resources than before, that’s productivity growth.
And the effects of that growth over time are enormous.
In 1901 in Australia, it took 18 minutes of the average worker’s time to afford a standard loaf of bread. Today, it is just 4 minutes.’ 2
The productivity of our bread makers means that we can all consume a lot more bread – or for the carb conscious – spend that extra bread money elsewhere.
But it’s not just bread production that’s been revolutionised.
A theatre ticket cost an average worker 321 minutes of work in 1901. Today it’s 62. A bicycle? 473 hours in 1901 down to just 6 hours today.
And to put even today’s very real concerns about rental costs into perspective: the typical Australian worked 9 hours a week to afford a rental in 2019 but 20 hours in 1901.
Wherever you look, productivity progress has improved our capacity to deliver the goods and services that we value.
That productivity growth has seen real per person incomes improve by more than 700% since Federation, while giving us an extra 13 hours a week to ourselves.’ 3
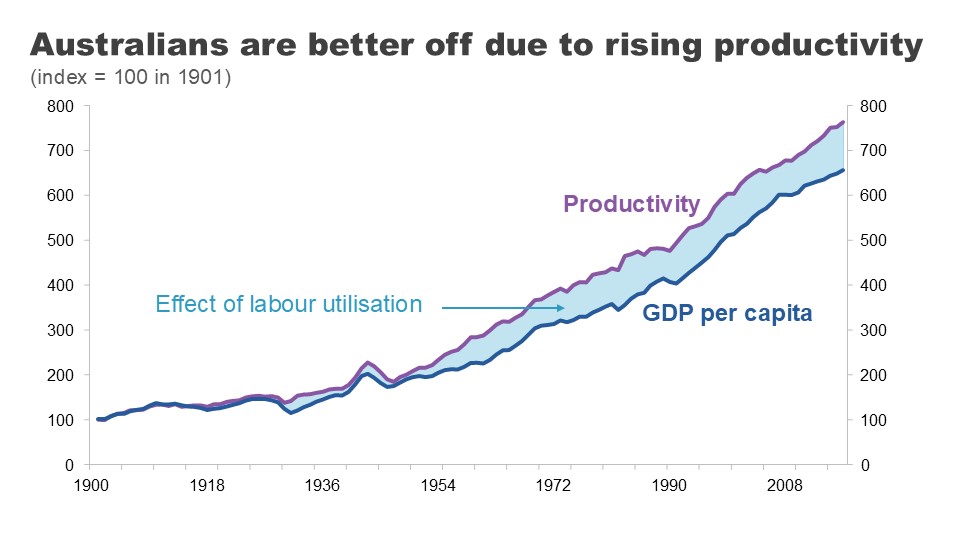
But here let me engage with a common argument dismissing the importance of productivity. According to the doubters, this economic growth might deliver more ‘stuff’ but does not deliver better lives or improved wellbeing.
I would mostly disagree. It is certainly true that economic growth won’t tuck your kids into bed at night, but it has delivered at lot more than just extra bread or bicycles.
Growth is correlated with so many of the things we care about: longer, healthier lives, better education, more and more varied leisure time, and better and more stable political institutions.
Many of these things are supported by growth but they also support growth themselves. As I’ll explain shortly, this is very much the case with education.’ 4
That’s why it’s not surprising that richer countries tend to have higher average life satisfaction’ 5 and that those countries that experience sustained economic growth tend to see their average levels of satisfaction increase over time.’ 6
That said, economists recognise that growth is not a measure of everything we care about. Some things are hard to measure well, like the quality of care services. And important determinants of wellbeing like community involvement and quality of relationships are missed all together.
But no one can or should deny that growth matters.
Houston, we have a (productivity) problem
I don’t need to tell this audience that Australia’s recent productivity performance hasn’t been much cause for celebration.
Productivity went on a roller coaster ride during COVID.
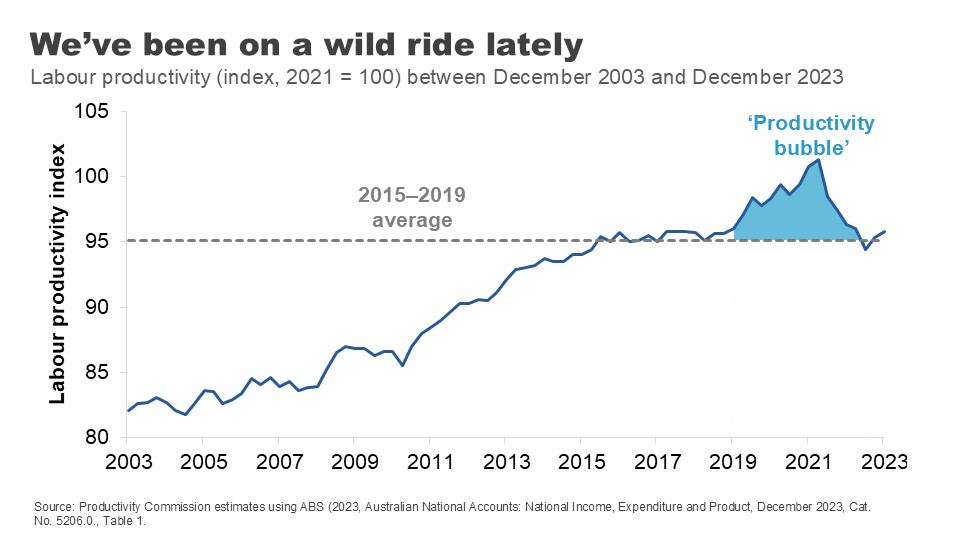
In the first two years of the pandemic, productivity rose strongly. This counterintuitive result was primarily because social distancing restrictions reduced hours worked the most in the lower-productivity services sectors.
But this productivity ‘bubble’ was in no way sustainable. After the end of restrictions in 2022, working hours expanded again in these sectors and pushed productivity in the opposite direction. The bubble burst.
The strong performance of the labour market through much of 2022 and 2023 has also put downward pressure on productivity during this period.
Now let me be totally clear: strong labour markets are great. But the surge in hours worked in the COVID recovery (coming from increased participation, lower unemployment and the re-opening of borders) was both quick and large. The capital stock has not kept up. The historical decline in the amount of capital per worker, has dragged on productivity because each worker has less capital – fewer or less efficient tools and resources – to help them do their jobs.’ 7
In some ways, the economy is like the cobra swallowing the ‘rat’ of the COVID shock. It will digest it, but it will take some time.
But this begs the question: what is the economy recovering to?
Even before our COVID rollercoaster, all was not well.
In the decade sandwiched between the GFC and COVID, Australia’s annual productivity growth averaged just 1.1% – the lowest of the last 6 decades and well below its 60-year average.
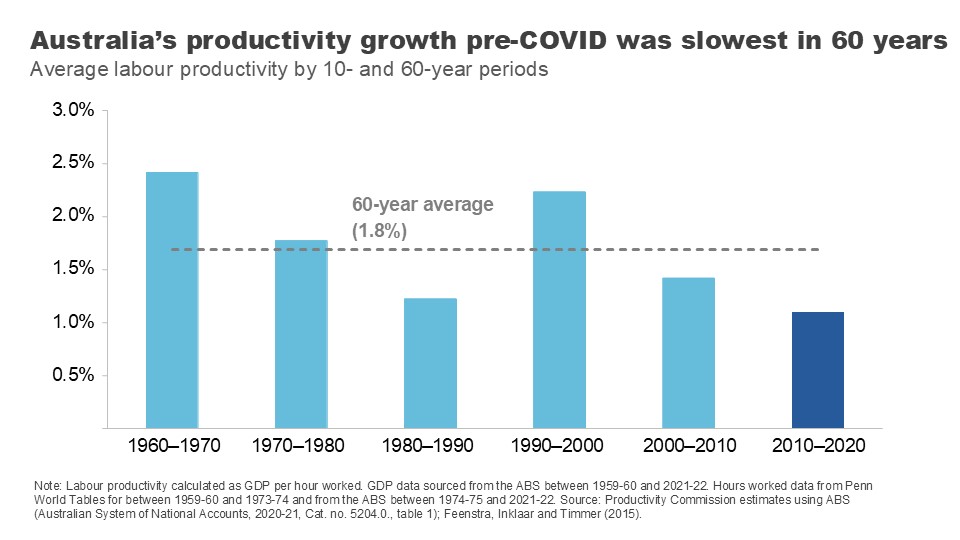
This slowdown in productivity growth is not just an Australian phenomenon.
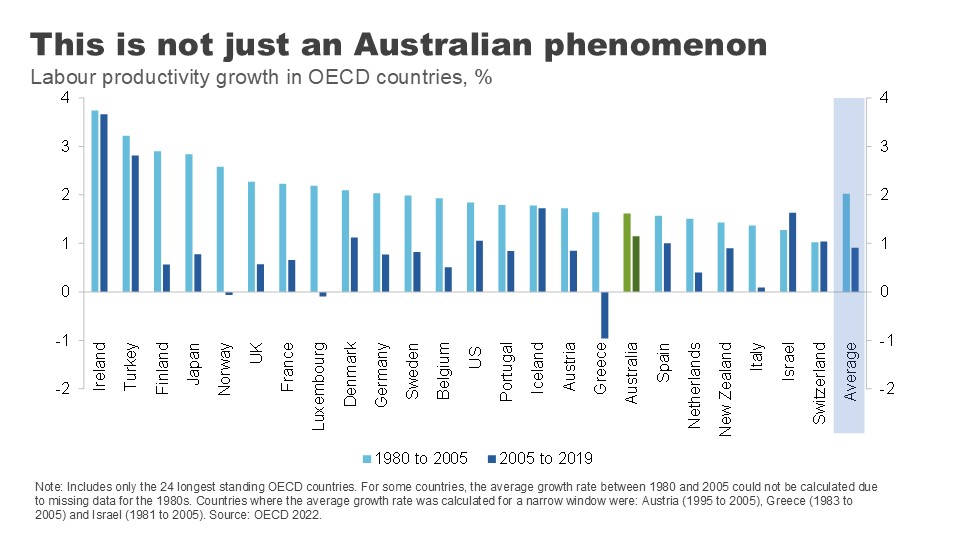
Almost every OECD country experienced a substantial decline in labour productivity in the 15 years prior to COVID, compared to the previous 15. Across the OECD, labour productivity growth halved in this period.
A range of credible explanations have been put forward to explain why: growth in the lower productivity services sector, declining gains from education, a smaller contribution from technological change, reduced economic dynamism, and increased risk aversion by business and capital owners.
But what I want to focus on here are two that are most relevant to our universities: declining gains from education and declining contribution from innovation. And then I want to address how the people in this room can help turn them around.
Universities are a powerful engine for productivity
Universities contribute a huge amount to our intellectual, social and cultural lives. But you’ve an invited an economist tonight so I’m naturally going to talk about the ways in which universities contribute to our long-term productivity performance.
There are, I think, three major channels:
- through building the skills and capacity of our future workforce – the so called ‘human capital’ of our population
- by generating and disseminating the research and ideas that lead to better processes and new and improved goods and services, and
- through building ties, understanding and goodwill with people from other nations, which contributes to ongoing integration – whether through trade, investment or the flow of ideas.
Tonight, I’m going to focus on the first two.
Boosting human capital
Let me start with the fundamental role that universities play in educating the population.
In the past 30 years, education levels across the Australian population have soared.
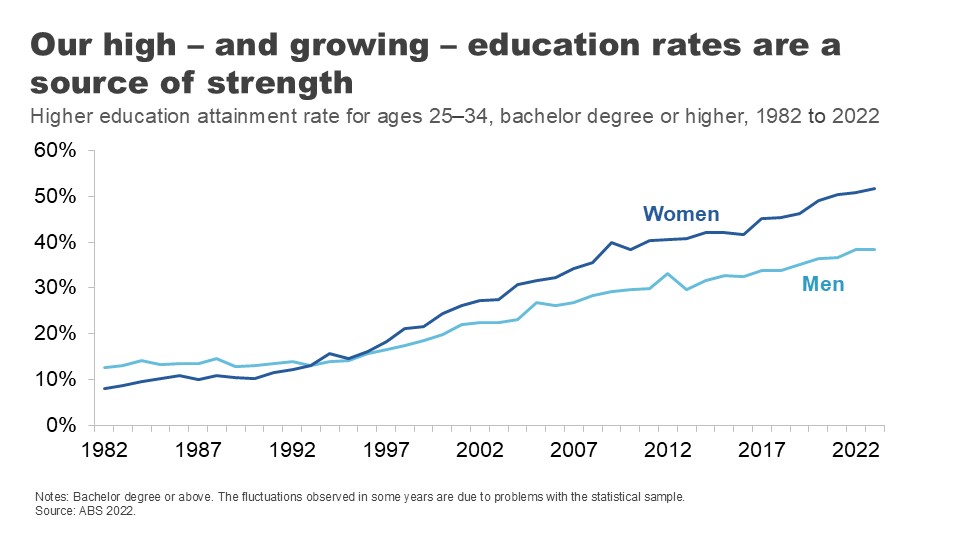
In the early 1980s, about one in ten 25–34-year-olds had a held a university qualification. Today, it’s 45%.’ 8
Part of this increase has been driven by a strong migration program that has encouraged skilled migrants to settle on our shores.’ 9 But it points as well to a large and sustained expansion in the number of Australians going to university.
Annual domestic student course completions have more than doubled since 1989, with nearly 140,000 students finishing a bachelor’s degree in 2021 and 87,000 finishing post-graduate study.’ 10
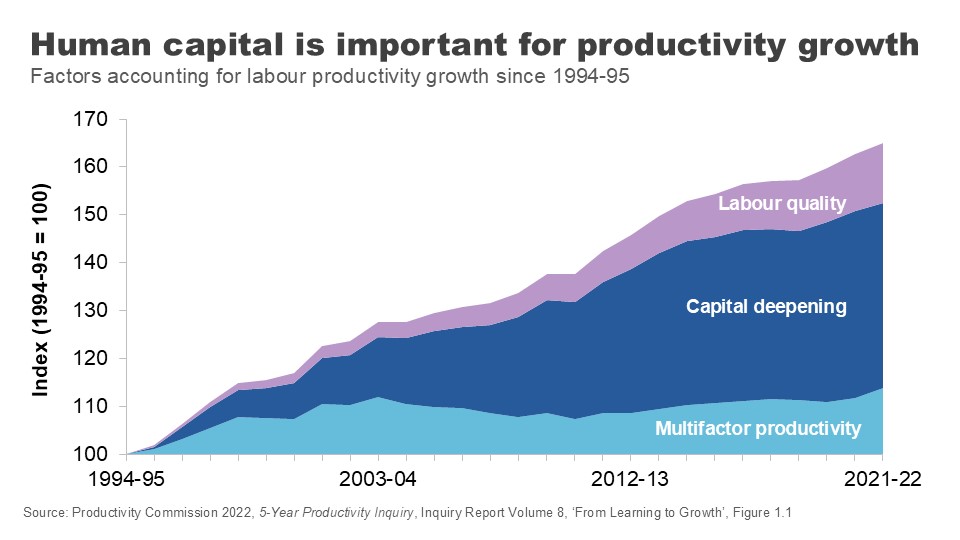
The resultant improvement in ‘labour quality’ has played an important role in productivity growth – particularly as other contributors have stalled.
University degrees are associated with better employment outcomes and higher earnings over people’s lifetimes – even after adjusting for individuals’ characteristics.’ 11
Although the graduate premium is in decline,’ 12 it is still significant across the lifetime.
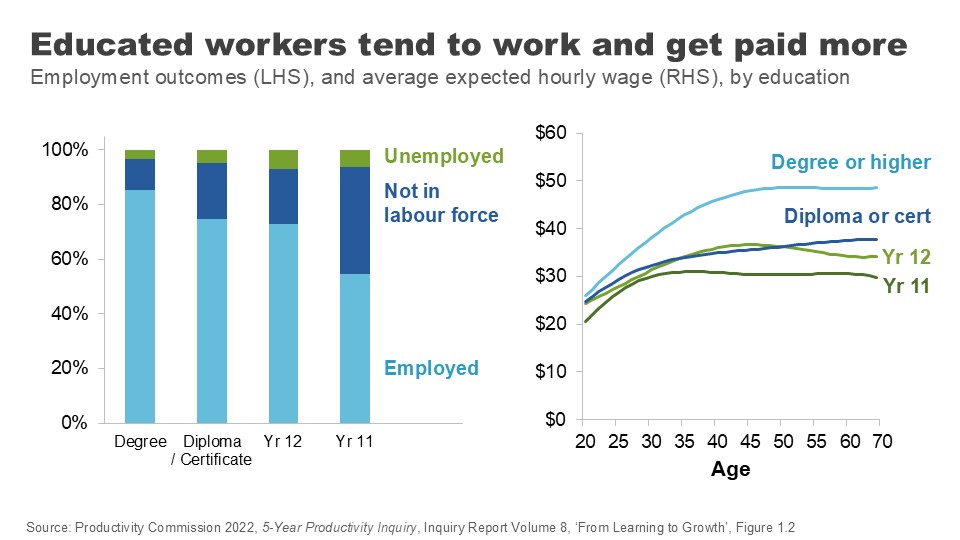
Higher levels of education in our working population improves wages and productivity through a few channels.
Most obviously, it improves the skills and abilities of our future workforce.
People who hold a tertiary qualification have higher cognitive performance than others their own age, even when you control for the fact that clever people tend to go on to study at higher levels. 13
Perhaps just as importantly, people with a higher education are more likely to do on-the-job training when they’re in the workforce – they’ve learned how to learn. 14 And there’s evidence going to university improves your non-cognitive skills, like sociability and your ability to cooperate or work in a team. 15
Education also improves people’s capacity to innovate. Increases in the supply of educated workers and managers leads to greater direct innovation by firms. Those educated workers are also more likely to adopt new innovations from elsewhere. 16
This link between education and an innovation mindset is critical if we are to supercharge the productivity upside from education, a point I will return to.
There are still gains to be eked out from expanding Australians’ access to higher education, despite the huge expansion over recent decades.
As the Productivity Commission noted in our 2023 Productivity inquiry, there is no evidence that we have reached the point where the cost of education for marginal workers outweighs the benefit received by them and by society. 17
According to Jobs and Skills Australia, more than 9 out of 10 new jobs will require a post-school qualification over the next decade, and around 50% will require a bachelor's degree. 18
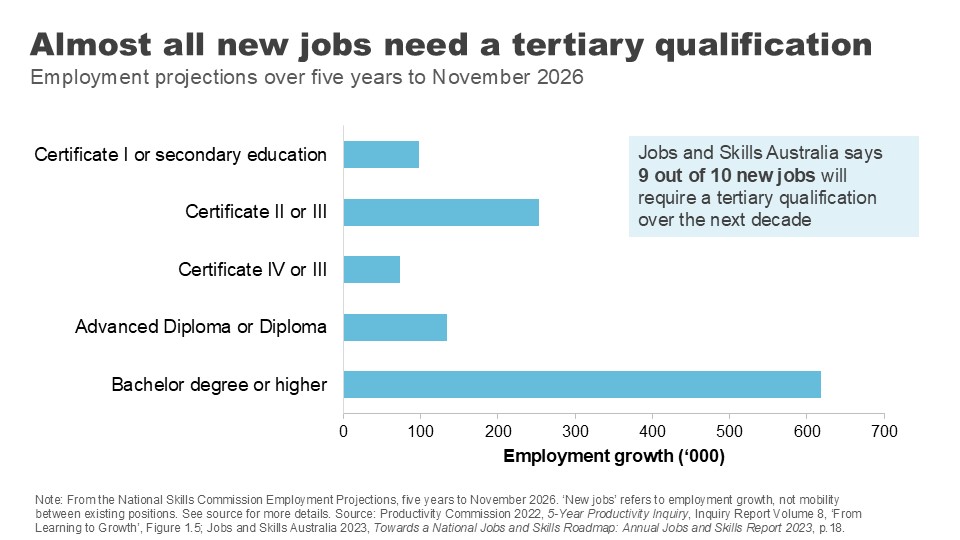
The recent Universities Accord argued governments should continue to promote participation in university and vocational education and set ambitious targets for governments to boost attainment rates by 2050.
The benefits of higher education are why the PC has supported a return to a system of uncapped demand driven funding. 19
But even with this potential upside, the huge ramp up in the education levels of the population will not be repeated. This means the contribution of gains from the quantity of education in the productivity numbers is likely to be more subdued in coming decades than in the previous ones.
This brings the quality of education into even sharper focus.
Education quality: levelling up
Improving education quality means improving outcomes for students for a given level of investment.
Which begs the question: how are we currently faring?
As already mentioned, university graduates have good labour market outcomes over the medium term compared with those who acquire skills via VET or school alone, even after adjusting for student characteristics.
Australian universities also perform well overall on student-assessed measures of quality. Indeed, the average university brings home a 76% – just scraping through with a distinction – on overall experience for undergraduate students. 20 On assessed teaching quality, it’s 80% – a solid mark. 21
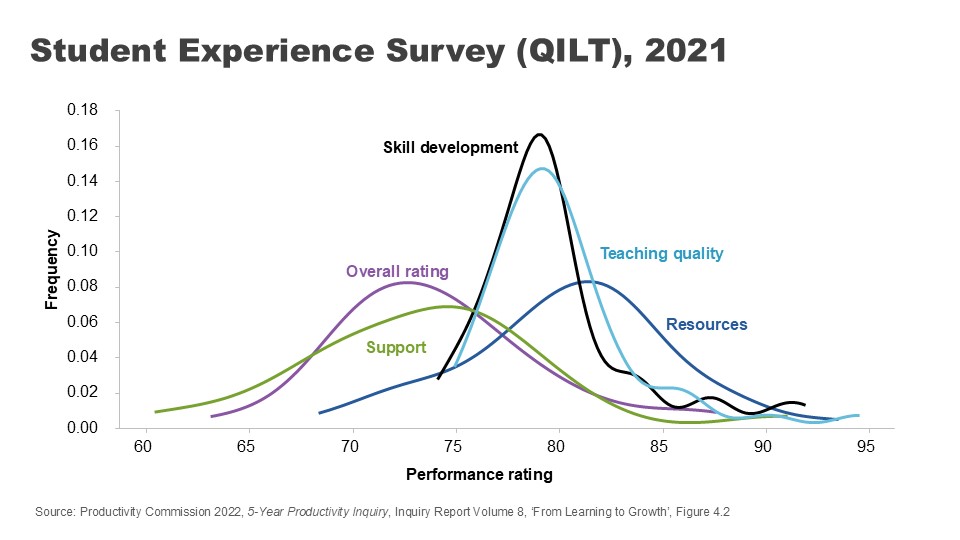
Further, on measures of employer satisfaction, overall satisfaction with graduates sits just below 84% and has remained strong over time. 22
But there are reasons to be vigilant.
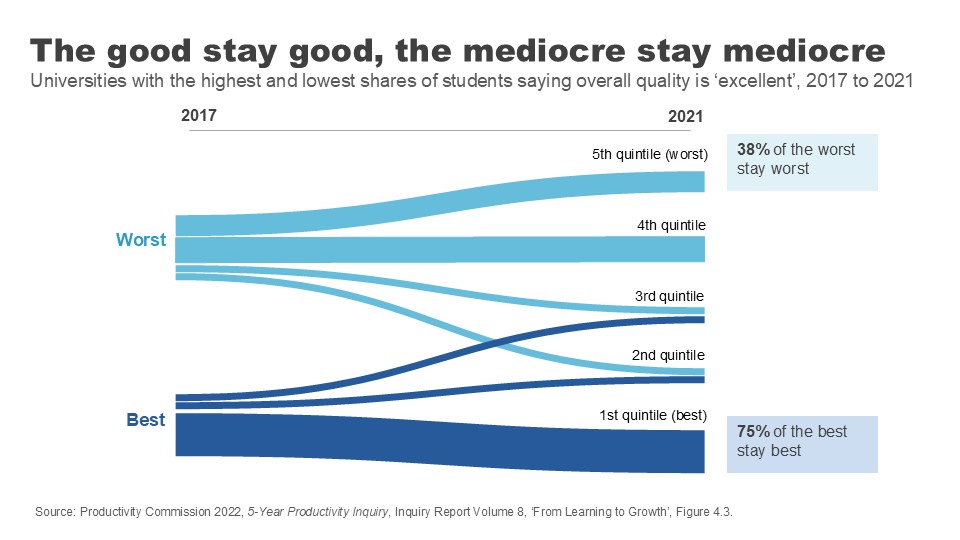
Despite the relatively strong average student-assessed quality scores, there is a fair degree of variation across institutions.
There is also stickiness in the outcomes data, suggesting a lack of course correction. Measured over a 4-year period, the universities that start with the highest share of students nominating their quality as ‘excellent’ tend to stay excellent, while those with the lowest shares also tend to stay at the bottom.
Employer satisfaction scores, while high overall, are stronger for foundational and technical skills than broader job skills like collaboration and adaptation. 23
And employers report much lower levels of satisfaction with the collaboration skills of graduates who study entirely remotely. 24 This matters because these ‘social skills’ are increasingly demanded by employers as a complement to technical skills. 25
More generally we need to consider the impact of online course delivery for student learning. The shift to online adds convenience and flexibility for students, but it comes with risk to quality.
Measures of learning engagement dropped when the pandemic hit our shores, and have not recovered since. 26
We may have jumped many of the initial hurdles to hybrid learning during those chaotic months of shutdowns, but not everyone has yet nailed the challenge of how to do online delivery well. A sea of blank Zoom screens is not ideal for either students or teachers.
More broadly, the Productivity Commission has noted the lack of direct incentive for teachers and universities to improve teacher quality.
We’re used to looking at star ratings when we book a hotel or a restaurant, but prospective students often don’t have good data when choosing between courses. 27
This lack of visibility combines with other factors – a general sense that teaching hold less prestige than research, government funding settings that fail to reward quality, and a lack of external oversight – to weaken the incentives for delivering the best teaching. 28
Of course, there are non-pecuniary incentives for individuals and institutions to teach well. And indeed, intrinsic motivations for excellence continue to steward high quality and innovative teaching practices at our universities.
But that is not enough to ensure that every teacher is delivering at a high standard.
The PC has put forward a range of recommendations for change. An important one is making lecture and course materials publicly available. Letting the public see behind your high walls would sharpen the incentives for quality teaching, allow students to make better decisions around what courses might match their interests and assist in lifetime learning – giving those not looking for an accreditation access to an endless supply of learning opportunities. 29
We need to ensure that teaching excellence is at the heart of our universities if we are going sustain the big improvements in quality needed for future productivity gains.
Promoting innovation
I want to turn now to another critical way in which universities impact our prosperity – in their role as vectors for innovation.
It is technological change that drives most productivity improvements over time. 30 And it is ideas that make technological change possible.
Economics Professor Daniel Susskind has argued that asking ‘how do we generate more growth?’ is essentially the same as asking ‘how do we generate more ideas?’.
And what are universities if not factories for ideas? 31
It is worth remembering that when we talk about ideas we are not just talking about the novel, frontier research that some of your researchers might be engaged in. ‘New to the world innovation’ is only around 1-2% of Australia’s innovation story. Diffusion – the application of existing knowledge to different businesses and contexts – is a crucial part of the innovation puzzle. 32
‘Innovation for the 98%’ must also be a focus of research efforts and graduate skills sets.
Universities spend more than they used to on research activity. Total university research expenditure has increased five-fold since the early 1990s – although growth has slowed somewhat in recent years.
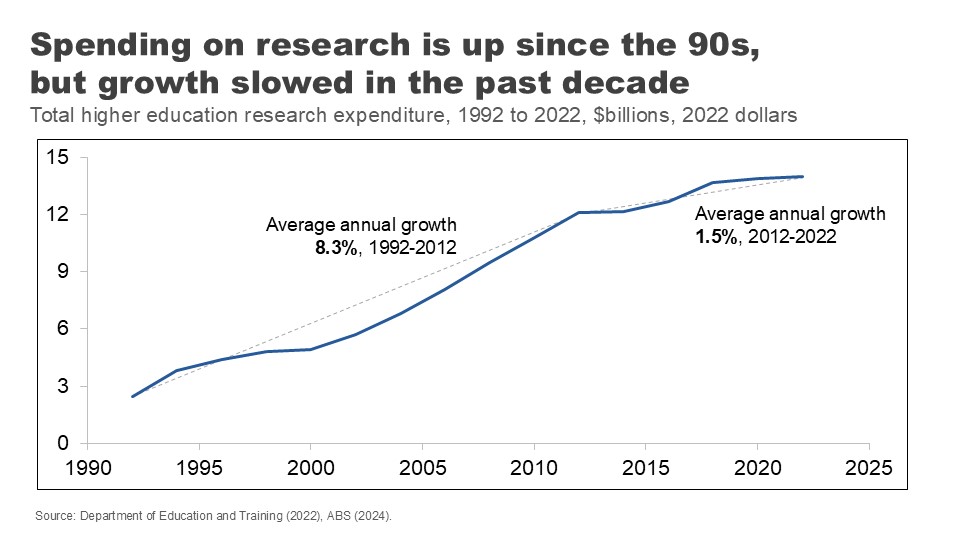
This ramp up in spending over the past three decades is repeated across much of the developed world. But it has not generated the ideas boom we might have hoped.
For example, if we turn to the US, we can see the number of people employed in research roles has grown 23-fold since the 1930s – a huge expansion in research effort. 33
But measured by the economic outputs of this research – the expansion in total factor productivity across the economy – the productivity of that research has declined 41-fold – or a growth rate of minus 5.1% per year on average. 34
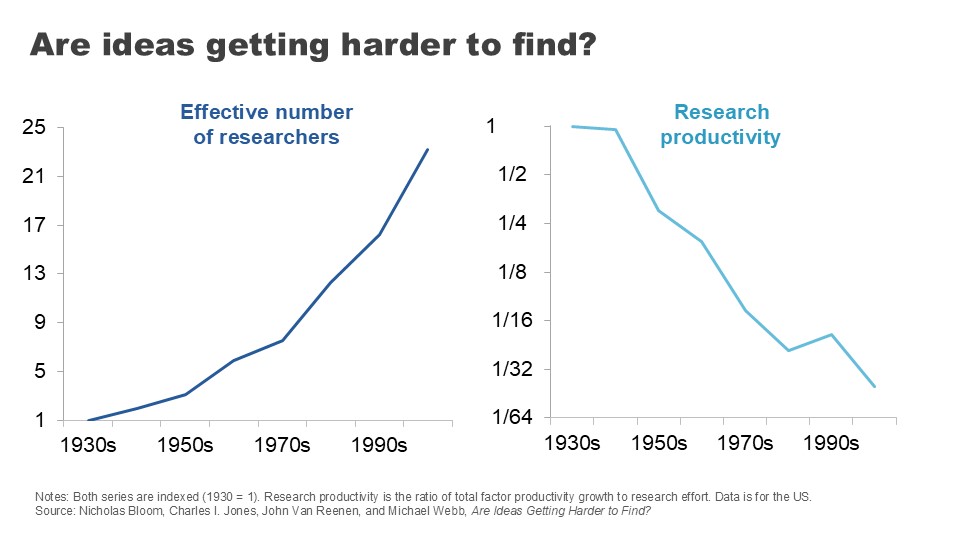
This tale of more and more effort and for less and less return has played out across a range of innovation areas.
Take Moore’s Law: the tendency for the number of transistors fitted onto an integrated circuit to double every two years. It is, on the face of it, a remarkable testament to our capacity for innovation. But the number of researchers required to bring about this result has grown to be 18 times higher than it was in 1971. 35
Agricultural crop yields are improving at a relatively constant or slightly declining rate, but the number of agricultural researchers required to achieve this has doubled. 36
In drug discovery, the number of new drugs approved per billion on R&D halves every nine years or so, in a phenomenon that has been dubbed ‘Eroom’s Law’: Moore’s law spelled backwards. 37
At the heart of the slowdown in research productivity is that researchers inevitably solve the easier problems first – making gains harder once the lowest hanging fruit has been picked. Indeed, being ‘Better than the Beatles’ is a challenge that confounds across so many research areas. 38
But even noting this difficulty, there is still scope to improve the productivity of the research process in ways that could help generate and diffuse new ideas.
Australia is unusual in that university-led research makes up a relatively large percentage of our R&D expenditure. 39
As a share of GDP, our universities chip in more for research and development than universities in the US and Korea, and we’re well above the OECD average. 40
The good news is that our university research is top notch on academic metrics.
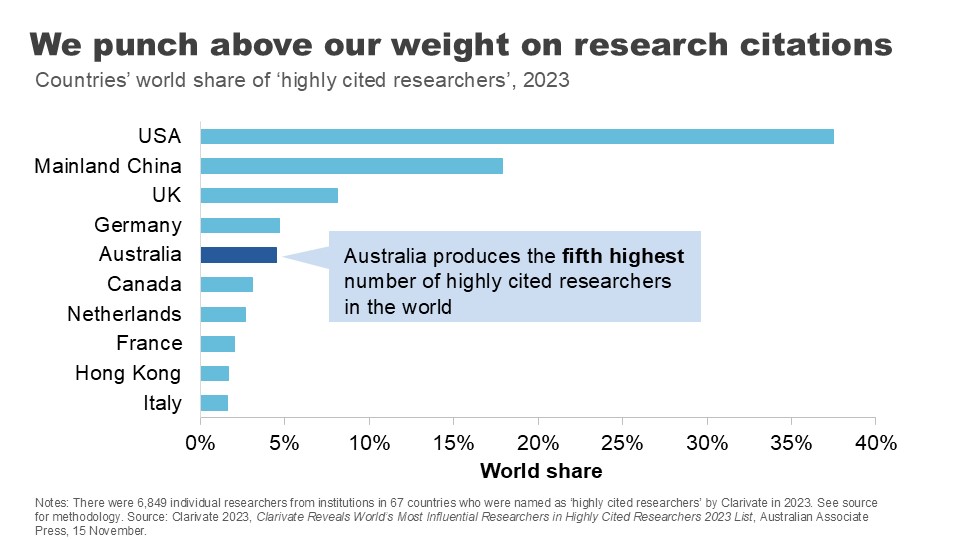
Despite our small population, we have the fifth highest number of highly citied researchers in the world. 41 And 84% of our research is rated at or above world standard. 42
Australian researchers also are more likely than those in the US or the EU to collaborate with international scholars, allowing us to ‘hoover up’ good ideas from overseas and apply them at home. 43
But there’s more we need to do.
There is a widely held view that Australian business collaboration with universities is poor. The perception is backed up in the numbers: data from the ABS suggests less than 10% of innovating firms got their ideas from universities between 2019 and 2021. 44
As much as policy makers say they want universities and business to ‘talk more’, clearly the incentives aren’t there to bring everyone to the table.
The Accord recognised the importance of nationally-relevant research in its recommendation for a new ‘Solving Australian Challenges Fund’ which would reward universities that apply their research capabilities to meeting Australia’s ‘big national challenges’. 45
Even where research turns up potentially useful ideas for Australian businesses or policy makers, we could do more to put them into practice.
Governments have long grappled with reducing barriers to research commercialisation – such as IP licencing and academic-spin offs or joint ventures – only partially successfully.
But the PC’s found we should be doing more to encourage knowledge transfers by encouraging labour mobility between industry and academia, and even by promoting joint conferences and networking events.
We can also help businesses tap into the experience and knowledge of academic researchers by reducing barriers to academic consulting, which is too often held up by administrative roadblocks. 46
There is also more to do on the productivity of the ideas generation process itself.
Long and expensive processes for grants can reduce ‘bang for buck’ and slow the research process.
US research on the peer-reviewed grant-making process concluded that the ‘tax’ of application processes may be up to 45% of researcher time. Further, these processes can skew or bias research efforts in a number of ways: towards more incremental research with a higher likelihood of surviving review than riskier or novel research; against interdisciplinary research; and towards researchers with a history of successful applications. 47
Certainly it does not take long for a conversation with Australian academics to degenerate into a similar set of complaints.
The recent Accord process suggested universities be paid for the indirect costs of applying for nationally competitive research grants, 48 and the Australian Research Council recently took the positive step of introducing an Expression of Interest round to its Discovery grant applications. 49
Future work may be necessary to explore alternative models like ‘science lotteries’ to continue tackling these challenges. 50
Where to from here?
I realise tonight I am speaking to a sector working through significant upheaval.
The COVID shock – the rollercoaster ride of closing and then reopening international borders with flow on effects for international student numbers – was obviously hugely challenging. Universities are on the frontline of a major technological change with the shift to online teaching and the growing adoption of generative AI in both learning and research.
Those challenges have been amplified by big and disruptive policy changes over a short period: first with the Jobs Ready Graduates package, then a suite of regulatory reforms to student migration settings, 51 and now the proposal for international student caps.
The Universities Accord process, a generally more constructive policy exercise, is also starting to flow through to policy. But it has raised fundamental questions about the university business model and the extent to which we can continue to rely on international student revenue to ‘cross subsidise’ research activity.
I am here tonight to say the payoff from getting the policy settings and the internal culture right are high. Universities hold in their hands two crucially important ingredients for national productivity: the skills of our labour force and the generation and diffusion of ideas.
Gains in both of these areas are becoming harder to come by. That might naturally push you to look for more resources. But I’m here to encourage you to also look for improvements via productivity at home.
Promoting teaching excellence, widely sharing learning, supporting research with Australian impacts and empowering students with an innovation mindset are just some of the ways in which Australia’s universities can shape a more productive future for Australia.
Footnotes
- Lucas RE Jr 1988, On the mechanics of economic development, Journal of Monetary Economics, Vol. 22, Issue 1, p.5. Return to text
- Productivity Commission 2023, 5-year Productivity Inquiry: Keys to growth, Vol. 2, Inquiry Report no. 100, Canberra, p. 6. Return to text
- Ibid., p.17. Return to text
- Susskind D 2024, Growth: A Reckoning, Penguin Books, United Kingdom. Return to text
- Sacks, D, Stevenson, B & Wolfers, J 2010, Subjective Well-being, Income, Economic Development and Growth, NBER Working Paper, No. 16441, October. See also Ortiz-Ospina, E. & Roser, M. 2013, Happiness and Life Satisfaction, Our World in Data, https://ourworldindata.org/happiness-and-life-satisfaction, (updated February 2024; accessed October 2024). Return to text
- Ortiz-Ospina, E & Roser, M 2013, Happiness and Life Satisfaction, Our World in Data, https://ourworldindata.org/happiness-and-life-satisfaction, (updated February 2024; accessed October 2024). Return to text
- Productivity Commission 2024, Quarterly Productivity Bulletin – June 2024, 27 June, Canberra. Return to text
- ABS 2023, Education and Work Australia, Table 35. Return to text
- See Norton, A 2023, Mapping Australian Higher Education 2023, ANU Centre for Social Research and Methods, for a discussion. Return to text
- Ibid., p.52. Return to text
- See Productivity Commission 2023, 5-year Productivity Inquiry: From Learning to Growth , Vol. 8, Inquiry Report No. 100, Canberra, pp.4-6, for a discussion of literature and controlling for cofounders. Return to text
- Brennan, M 2022, Productivity, Migration and Skills , ‘Rebuilding Australia’s Future’, Universities Australia Conference, delivered 7 July. Return to text
- Productivity Commission 2023, 5-year Productivity Inquiry: From Learning to Growth , Vol. 8, Inquiry Report No. 100, Canberra, pp.4-6. Return to text
- Ibid. Return to text
- Ibid. Return to text
- Ibid. Return to text
- Ibid, p. 3. Return to text
- Jobs and Skills Australia 2023, Towards a National Jobs and Skills Roadmap: Annual Jobs and Skills Report 2023 , Australian Government, October, p.18. Return to text
- Productivity Commission 2023, 5-year Productivity Inquiry: From Learning to Growth , Vol. 8, Inquiry Report No. 100, Canberra, Recommendation 8.4, p. 64. Return to text
- Quality Indicators for Learning and Teaching (QILT) 2023, 2022 Student Experience Survey , Department of Education, Table 1. Return to text
- Quality Indicators for Learning and Teaching (QILT) 2023, 2022 Student Experience Survey , Department of Education, Figure 1. Return to text
- Quality Indicators for Learning and Teaching (QILT) 2024, 2023 Employer Satisfaction Survey , Department of Education, Figure 1. Return to text
- Ibid., Table 3. Return to text
- Ibid. Return to text
- Brennan, M. 2022, Productivity, Migration and Skills , ‘Rebuilding Australia’s Future’, Universities Australia Conference, delivered 7 July. Return to text
- Quality Indicators for Learning and Teaching (QILT) 2023, 2022 Student Experience Survey , Department of Education, Figure 1. Return to text
- The PC recommended QILT data be refined and made more salient for prospective students. Productivity Commission 2023, 5-year Productivity Inquiry: From Learning to Growth , Vol. 8, Inquiry Report no. 100, Canberra, Recommendation 8.9, p. 111. Return to text
- Ibid., pp. 97-101. Return to text
- Ibid., Recommendation 8.9, p. 111. Return to text
- Williamson et al. 2015, Technology and Australia’s Future: New Technologies and their Role in Australia’s Security, Cultural, Democratic, Social and Economic Systems , Australian Council of Learned Academies. Return to text
- Susskind D 2024, Growth: A Reckoning , Penguin Books, United Kingdom, p.177. Return to text
- Productivity Commission 2023, 5-Year Productivity Inquiry: Innovation for the 98% , Vol. 5, Inquiry Report no. 100, Canberra. Return to text
- Bloom et al. 2020, Are Ideas Getting Harder to Find? , American Economic Review, Vol. 110, No. 4, pp. 1104-1144. Return to text
- Ibid. Return to text
- Ibid. Return to text
- Ibid. Return to text
- Scannell et al. 2012, Diagnosing the Decline in Pharmaceutical R&D Efficiency , Nature Reviews Drug Discovery, Vol. 11, No. 3, pp. 191-200. Return to text
- Ibid. Return to text
- O’Kane, M. et al. 2024, Universities Accord: Final Report, Australian Government, Figures 30 and 31. Return to text
- Ibid. Return to text
- Ibid, p.192. Return to text
- Ibid. Return to text
- Ibid. Return to text
- Productivity Commission 2023, 5-year Productivity Inquiry: From Learning to Growth , Vol. 8, Inquiry Report no. 100, p.49. Return to text
- O’Kane, M. et al. 2024, Universities Accord: Final Report, Australian Government, p. 299 Return to text
- Productivity Commission 2023, 5-Year Productivity Inquiry: Innovation for the 98% , Vol. 5, Inquiry Report no. 100, Canberra, Recommendation 5.4, pp. 50-52. Return to text
- See Sharma, I. et al. 2022, Piloting and Evaluating NSF Science Lottery Grants: A Roadmap to Improving Research Funding Efficiencies and Proposal Diversity , Institute for Progress, 2 February, for a summary. Return to text
- O’Kane, M et al. 2024, Universities Accord: Final Report, Australian Government, p. 216-217. Return to text
- Australian Research Council 2023, Discovery Projects Scheme: Two-stage Application Process , 30 October, https://www.arc.gov.au/news-publications/media/feature-articles/discovery-projects-scheme-two-stage-application-process (accessed October 2024). Return to text
- Sharma, I et al. 2022, Piloting and Evaluating NSF Science Lottery Grants: A Roadmap to Improving Research Funding Efficiencies and Proposal Diversity , Institute for Progress, 2 February. Return to text
- Norton, A. 2024, Australia made 9 changes to student migration rules over the past year. We don’t need international student caps as well , The Conversation, August 5. Return to text

