Right to repair draft report
Speech
Commissioner Paul Lindwall delivered a speech to the Australian Repair Summit in Canberra on 9 July 2021.
Download the speech
Read the speech
Thanks – it’s great to be here at the Repair Summit and I’m glad that Leanne has organised the day. We are well represented from the PC (including fellow commissioner Julie Abramson up from Melbourne and my Canberra colleagues Aaron, Paulene, Caroline, Sophie and Max – and colleagues online from Melbourne: Paul (now team leader), Roger, Bonnie, James and Holly). I also acknowledge the tremendous work of team leader Ana Markulev who had two deliveries: the draft report and then a baby.
The Right to Repair inquiry has been fascinating, with many dimensions to the topic. We released our draft report on 11 June and are inviting submissions in response to the draft by 23 July. We are also holding public hearings later in July.
We will send the final report to the Government by 29 October and it has up to 25 sitting days to table the report. The Government then decides whether or not to accept our recommendations.
In the draft report we pose some initial views and outline where we do not yet have sufficient evidence to make a call. The latter form information requests and we also expect to hold some roundtables to discuss specific areas of the report. Most of the draft recommendations can be characterised as ‘no regrets’ policies – those that are worth pursuing in any case.
If I could summarise the concerns that led to our inquiry, they would be this:
- it has become increasingly difficult and expensive to effect a repair on a broken product and there is a lock in to ‘authorised repairers’
- spare parts are not available
- products are not designed to last and fail early and consumers tend to buy new products rather than have their old products repaired
- there has been a proliferation of e-waste.
But these are broad generalisations and don’t always apply. In this inquiry we have examined the evidence from submissions and our own research, and we have also looked at the experience and policies implemented overseas.
What is a ‘right to repair’? There are a lot of definitions floating around, but for the purposes of our inquiry we have settled on this:
A right to repair is the ability of consumers to have their products repaired at a competitive price, by the repairer of their choice.
Note this does not mean that a consumer has the right to have a product repaired at any cost. We need to balance competing interests – those of consumers, manufacturers, retailers and governments.
For example, if my halogen light failed it would be prohibitively expensive to have it repaired rather than buy a replacement LED light.
In this report we have examined policies across a range of areas:
- Product obsolescence and design standards
- Consumer law
- Competition in repair markets
- Intellectual property
- e-waste management.
I want to touch on these today and there will be an opportunity to ask questions.
Product design and obsolescence
Why do some products last many years, while others break quickly? Some are easy to repair, others virtually impossible.
The cars in Cuba many dating to the 1940s, are lovingly maintained by their owners, often family heirlooms. As you travel around Cuba, you’ll see men hunched over cars, repairing engines and fixing exhaust systems.
Since the country lacks replacement parts, the locals are extremely crafty and adept in their repairs. Cuban ingenuity has kept these old cars on the road. Mechanics find ways to use imperfect parts and keep the things running.
In Australia, the CEO of the NRMA, Rohan Lund, recently wrote:
“Australians are notoriously slow at upgrading the family car – at 10 years, the average age of our cars is second oldest in the developed world”
But shouldn’t we be proud of this? Is it better that consumers switch over their cars in less than 10 years? We expect a washing machine to give more than ten years’ service and yet a car should be less than 10 years?
We replace products for a whole range of reasons. It could be the product is broken and it’s more expensive to repair than replace. It could be that a new product offers features that we desire, or the new product is more efficient and less environmentally harmful. It could be that we like a change for the sake of fashion.
The design of many products today has incorporated solid state technology, including the internet of things, allowing our products to be connected and controlled remotely. This has been an important factor leading to the rapid change over of certain products.
But why do Pont du Gard and the Pyramids of Giza stand after so many thousands of years? It’s because they were built by trial and error – over engineered if you will. The Roman bridges and Egyptian pyramids that were not so well constructed have collapsed long ago.
Today we can design products very precisely, using the minimum materials needed for the particular product. The products are then made in a factory in very consistent and predictable ways. This has led to an increase in the mean time between failures (MTBF) of well designed and built products and also a narrowing in the variation of the MTBF.
Yes, products fail and break. But frequently they are becoming replaced because of continuing rapid technological innovation. We the consumer are replacing our products before they fail.
Do we replace products needlessly? Yes, and I’m as guilty of that as are many of us. Am I brainwashed into buying the new phone? No. It’s my choice.
Overall we didn’t find clear evidence that manufacturers deliberately design products to fail early.
But perhaps there might be merit in some labelling scheme to help consumers understand how easy it is for their product to be repaired and its durability. France has such a labelling scheme and we are investigating this further for the final report.
Consumer law
Australian consumer law (ACL) provides extensive and comprehensive guarantees. But the guarantees are not well understood and they can be difficult and costly to enforce.
It is important to separate the manufacturer’s warranty from a consumer guarantee under Australian consumer law. Warranties cannot supplant consumer guarantees.
The rights a consumer has under the guarantees are for a repair, replacement or refund depending on the nature of the failure. The ACL provides that a product will have ‘reasonable durability’ but doesn’t define what that means. This leaves consumers, manufacturers and retailers being unsure and can cause confusion. In 2019-20, the ACCC reported over 37,600 complaints about consumer guarantees and warranties.
So we think there is scope to improve the understanding of consumer guarantees and make it easier for consumers to enforce their rights. So we have three draft recommendations that we expect will help.
First, we think the ACCC should develop and publish estimates of the minimum expected durability of products within major categories of common household products. We expect this would help consumers, retailers and manufacturers better understand what a reasonable durability for such products might be. We also think that the ACCC should develop this guidance in consultation with relevant State and Territory consumer regulators, consumer groups and business groups.
Second, we think there is scope for an extension of alternative dispute resolution (ADR) schemes to better resolve complaints and we cite two examples, one from South Australia and the other from NSW. ADRs can help consumers enforce their rights without the expense of going to Court.
Third, for systemic issues we think a super-complaints system which allows complaints from recognised consumer groups to be made to the ACCC and for these to be fast tracked and responded to by the ACCC will help where an issue is of widespread concern.
Additionally, we have received many submissions that express concern about the availability of spare parts and software/firmware updates. We are inviting further evidence to inform just how far we should go and whether there would be a net benefit in mandating manufacturers to hold spare parts for minimum periods as well as whether software updates be provided by manufacturers for a reasonable period of time after the product has been purchased.
Holding spare parts is costly, so is providing software updates for products no longer manufactured. But so too is it costly when a product cannot be repaired for the sake of one spare part.
It’s a balance and that’s why we are asking for more evidence.
As an aside, the increasing use of 3D printing may provide a less costly way of providing spare parts in the future – just as we now see print on demand for rarely purchased books.
Competition in repair markets
In 2018 there were about 57,000 repair and maintenance businesses and over 203,000 workers. The repair sector generated about $35 billion in sales revenue.
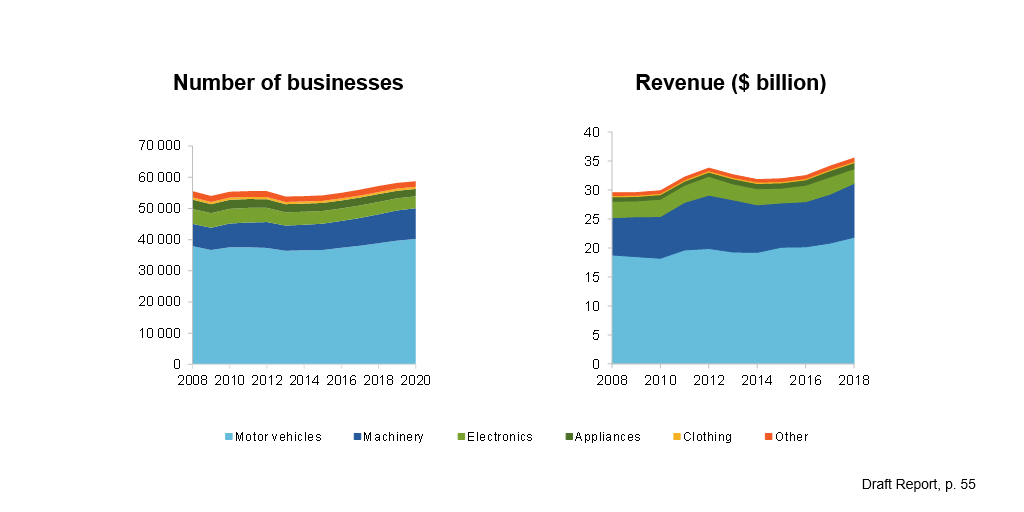
It’s probably not surprising that the largest repair industry in Australia is for motor vehicles. There were 40,000 of them in 2020. They are large, expensive and complex mechanical and computerised products requiring regular maintenance.
The next largest repair industry is machinery repair, including for agricultural, construction and mining machinery of which there were around 10,000 repairer businesses.
Appliance repair – such as for washing machines, ovens, air-conditioning units, water heaters, etc – comprises mostly of small businesses. It has experienced relatively strong growth over the past ten years, but also consolidation.
Finally the electronics repair industry – for computers, mobile phones etc – is a small part of the sector and has been declining probably due to the relative cost of repair to replacement.
So that is the repair sector – a mixture of independent and ‘authorised’ repairers. And a common refrain to this inquiry has been the efforts by manufacturers and retailers to send customers to their authorised repairers and to make it difficult for independent repairers.
In the report we discuss the interactions between competition in the primary market – the original product purchase – and in the secondary market – the repair market. A highly competitive primary market can mitigate the negative effects of an uncompetitive secondary market.
That said, there are several products for which market characteristics, including high consumer lock-in and limited product competition, may mean that competition in those repair markets is limited. For the draft we identified agricultural machinery and mobile phones and tablets as products where there is likely to be consumer detriment.
We also looked at concerns in the repair markets for motor vehicles, construction machinery, watches and medical equipment.
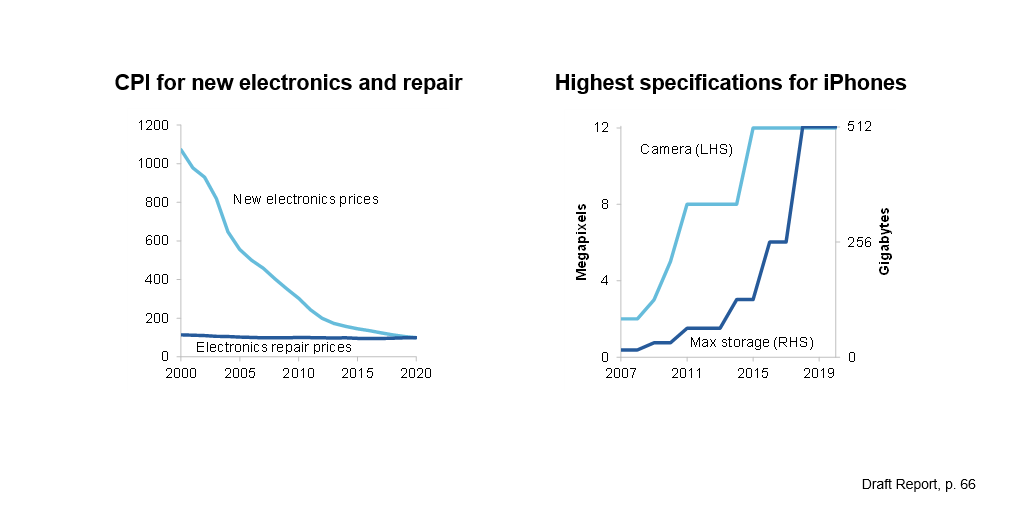
The cost of repair is driven largely by labour costs, and this is one reason that many products are often less expensive to replace than to repair, although examples of the difficulty in replacing the screens and batteries of smart phones are manifold.
These design features – making repair difficult – are not unique to Australia as we are an importer of most of this technology. That said, we are looking at the potential for labelling schemes as I mentioned before that exist in France.
The labour-intensive nature of repair is such that the relative price of new electronics (produced in mass in a capital-intensive factory) has fallen rapidly in real terms while repair costs have grown with labour costs.
Aside from potential labelling schemes, there are a number of measures which we propose and wish to examine further to promote competition in the repair sector.
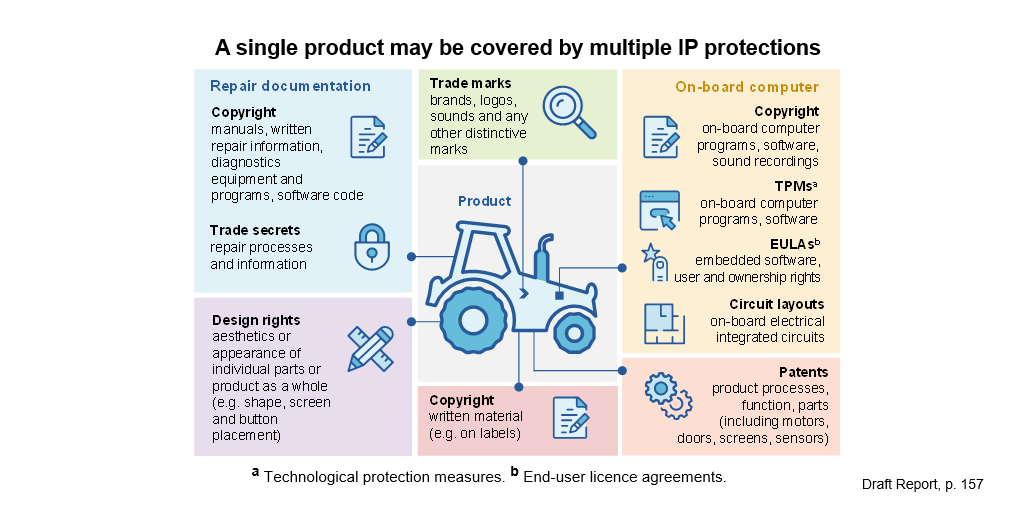
First, should we amend copyright law to provide better access to repair information (manuals, schematics, and diagnostic information) which can often be hidden behind TPMs (technological protection measures such as digital locks)? This could be achieved via a specific copyright exemption for the reproduction and sharing of information in a fair dealing exception in the Copyright Act.
Or it could be through a general copyright exemption via a broad fair use exception in the Copyright Act, something we recommended in the 2016 Intellectual Property Arrangements inquiry report. It’s notable that the United States has a fair use exception to its copyright laws.
And where repair information is hidden behind a TPM, would allowing repairers to distribute and share tools to circumvent such measures to access repair information be beneficial?
A step beyond such intellectual property options would be a positive obligation on a manufacturer to supply spare parts, diagnostic equipment and repair manuals to independent repairers. And if so, to which products should such an obligation apply?
We don’t make a recommendation on such copyright and positive obligation options in the draft report because we need to ascertain that there would be a net benefit from doing so – we need to examine potential unintended consequences and the effects of such proposals on the primary and secondary markets.
Warranty terms
Under Australian consumer law, the consumer guarantees are not voided if a consumer has had their product repaired by an independent repairer. However, manufacturer warranties can include terms that void the warranty after any independent repairs, or if aftermarket parts are used. We examined a number of warranties and found several examples of these voiding clauses. But warranty terms cannot displace the consumer guarantees.
To make this clearer for consumers, we have recommended that there be additional mandatory warranty text which clearly states that the entitlements to consumer guarantees under the consumer law do not require consumers to use authorised repair services or parts.
A step beyond which we canvass but do not yet recommend is whether a provision such as the US Magnuson-Moss Warranty Act should apply in Australia. That is, manufacturers would not be able to void warranties if a consumer used an independent repairer.
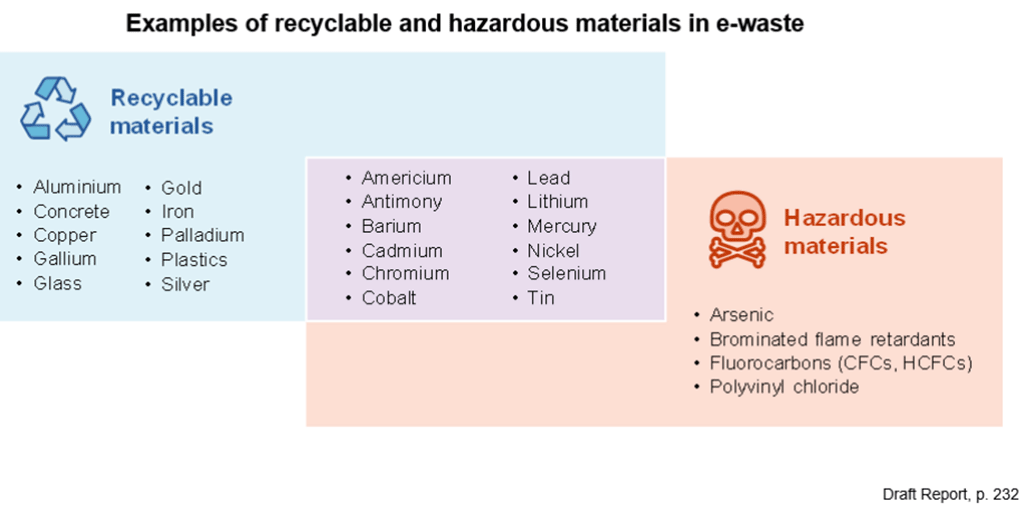
E-waste
E-waste is a growing problem in Australia as elsewhere as more and more products use electronic components. Its share of total waste is less than 1% at present, but over the past ten years the weight of e-waste has grown 131% compared to 41% for general waste.
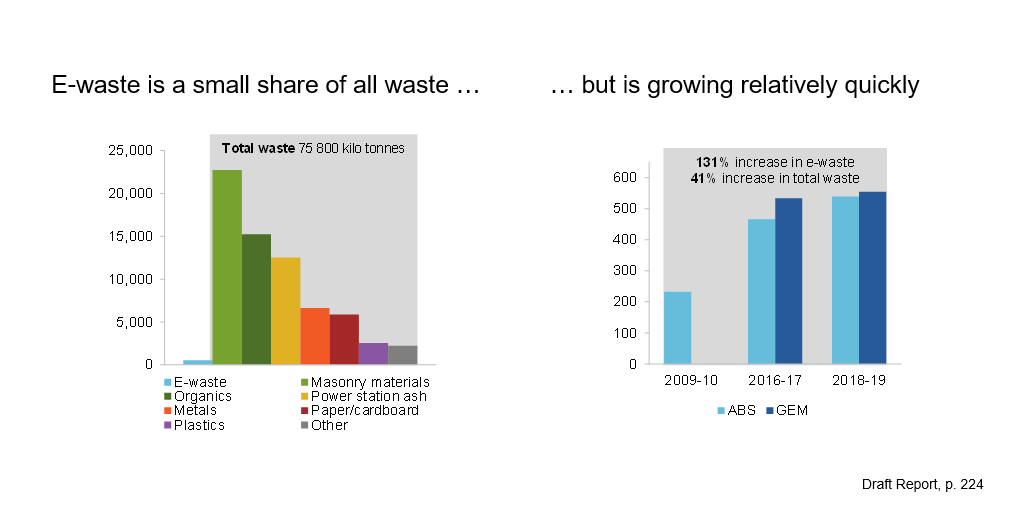
E-waste consists of many materials, some of which is valuable, and some hazardous. The range of materials changes over time, however, as product design and regulations change. Fluorocarbons found in fridges and air conditioners, for example, have been phased out. And the products which presently make up most e-waste include such things as CRT televisions which are no longer manufactured. Sustainability Victoria forecasts that solar panels will comprise around 10% of e-waste in 2035, up from less than 1 per cent in 2015.
While Australia’s landfill management practices are generally effective, clearly if materials which would otherwise end up in landfill are able to be efficiently reused or recycled than they should be.
A product stewardship scheme – where a manufacturer or importer takes responsibility for the waste from its products – is one way to reduce e-waste.
But a feature of such schemes – such as the National Television and Computer Recycling Scheme – is that they tend to incentivise recycling over repair and reuse. We think that there should be a change to that scheme so that e-waste products that have been repaired or reused count towards the scheme targets. There will need to be design changes of course (and perhaps a name change) and it would be important to have a good scheme design to prevent rorting.
Australia has a relatively small population with limited e-waste recycling capacity because of its dispersed population and high labour costs. So the scope for large-scale, efficient recycling in Australia is limited. The lack of cost-effective domestic recycling can increase the incentives to stockpile, dump or unlawfully export e-waste.
Exporting of e-waste is not problematic provided it is to destinations that efficiently and safely recycle the waste. Australia is a signatory to the Basel Convention on the Control of Transboundary Movements of Hazardous Wastes and their Disposal but not yet the Basel Ban Amendment of 1995 which prohibits signatory states from exporting hazardous waste to any country not in the OECD or EU.
We are recommending the use of GPS trackers – which are relatively low cost – and can be used to see where e-waste is ending up. A risk-based sampling approach would be a useful method focusing on the types of products and supply chains that have the highest risk of unlawful exports.
Conclusion
In this draft report, the Commission has sought to address concerns around a right to repair from a number of angles. There is no silver bullet, however, nor will a right to repair solve by itself e-waste concerns. But there are measures which we are proposing and which we are examining further for the final report that would make a measurable improvement to concerns around sustainability. But it also behoves all of us as consumers to be aware of our patterns of consumption.
I’m not a fan of buy now and pay later schemes, which is a form of instant gratification. Perhaps further consumer education campaigns might help, but our own behaviour as consumers should be one that sets a good example.
As for the ubiquitous smartphone, did you know that according to a US survey 46% of those surveyed (over 18 years of age) used their phones 5 to 6 hours a day. Taking the median, that’s over 2000 hours in a year. That’s a lot more usage than pretty much every other product you have. Your washing machine? Perhaps 150 hours a year. Your car? Perhaps 100 hours a year. So if your smartphone lasts four years, that 8000 hours of use. There are only 8760 hours in a year!
Thanks for listening and contributing to the PC’s inquiry.
Hugh Stretton Oration
Chair Danielle Wood delivered the 2024 Hugh Stretton Oration at the University of Adelaide.
Download the oration
Read the oration
I would also like to begin by recognising the Kaurna people as the traditional owners of the land on which we meet today. I acknowledge their deep connection to this place and pay my respects to their elders, past and present and to any Aboriginal or Torres Strait Islander people with us this evening.
Thank you everyone for being here. It is very special for me to be back at the University of Adelaide, the place where I experienced the heady years of my undergraduate Economics degree. Lots of long afternoons in the Reading Room of the Barr Smith library, the occasional equally long one at the Uni Bar (RIP), but an incredible spirit of learning, thinking and debate that was so foundational for me.
A huge thank you to the Provost, Professor John Williams AM, Deputy Vice-Chancellor and Vice-President (Academic) Professor Jennie Shaw and Professor Adam Graycar for having me back. I am honoured to have the Governor Her Excellency the Honourable Frances Adamson in attendance, as well as the University Chancellor, the Honourable Catherine Branson AC KC.
There are also a couple of other very special guests in the audience, my parents Rae and Simon Wood, who are hearing me speak for the first time in a professional setting this evening. And I am grateful that after listening to my almost constant talking from the age of two, they are still willing to come back for more.
Hugh Stretton’s legacy
It is also a huge privilege to have the opportunity to honour the professional contribution of Professor Hugh Stretton AC. Professor Stretton’s incredible intellect and impressive CV has been well detailed by the Vice Chancellor.
Three things stood out to me in reading about his professional life.
The first was his intellectual energy and imagination. I particularly enjoyed the reference provided by one of his former supervisors on his application to lead the School of History:
The first impression is of extremely high intelligence. He uses his gifts quietly, however, and is given as much to listening as to talking... He is quite clearly an exact and energetic scholar, though … I am not at all confident that he will publish either quickly or much. I have no doubt that he would build a School of History soundly and with imagination. 1
Now today, any mention of a relaxed approach to publication might be an automatic disqualifier, but the referee was right about Stretton’s suitability to successfully lead the department.
By the end of his tenure as chair in 1966 the School of History had gained a reputation as one of the best of its kind in Australia. 2 And much of this was down to Stretton’s reputation as a formidable thinker and public intellectual. 3 Ultimately in academia, and in life, the spirit of curiosity counts for much.
The second was Professor Stretton’s gift for turning new ideas into policy practice.
His most famous work, a book on urban planning called Ideas for Australian Cities, was so influential that when applicants were interviewed for positions in the Whitlam government’s Department of Urban Development, the first question was: ‘What do you think of Stretton?’. 4
While becoming the opener for a public service interview is a bar not many of us will reach, that spirit of marrying rigorous evidence with real world policy implications is one that I know that many of us strive for in our work.
And the third and perhaps most notable thing was Stretton’s unwavering belief in fairness and opportunity for all. He believed public thinkers have a responsibility to look for chances to make a difference, to reduce disadvantage and make Australia a place where anyone can prosper.
As he once said: “We should be doing all we can, by old and new means that fit our changing historical conditions, to leave Australia fairer than we found it”. 5
Tonight I hope to give you some ideas about how we take up Stretton’s challenge.
I’m going to take you through what we know about inequality in Australia today.
Using new analysis released this week by the Productivity Commission, I’ll show you the distribution of wealth and income in Australia and how it’s changed over time.
I also want to give you a sneak peek of some research we haven’t yet published on intergenerational mobility. This goes to the important question: how much does who your parents are, go on to influence your life outcomes?
To finish, I’m going to give you a ‘fair go toolbox’ – a set of policy allen keys that can fit the inequality problem at hand.
A few disclaimers...
But first let me start with a few disclaimers, and as I’m an economist rather than a lawyer I’m going to put these right upfront rather than buried in size 6 font in a footnote.
1. Economic inequality is a surprisingly slippery construct
‘The rich are different to you and me’, writer F Scott Fitzgerald once claimed. ‘Yes’, said Hemmingway, ‘they have more money’.
At one level inequality is that simple: some people have more money than others.
But as I will come to, economic inequality measures can vary a lot depending on what we are measuring – do we care about income, consumption or wealth?
And there can be a range of worthwhile questions to ask:
- How are those doing it toughest faring?
- How much do the most well off – say the top 10% or 1% – have compared to others?
- Or how are resources distributed across the population as a whole?
Each can give us different insights.
And that’s before we even get to the question of how opportunities and outcomes change over a person’s lifetime, or vary by gender, age or for First Nations Australians.
So, to manage this complexity, tonight I’m going with the maximalists – or perhaps the Strettonist – approach. I will take you through a range of indicators and cuts of the data to give you a broad account of the state of play. But I also want to talk about what this actually looks like in people’s lives.
As Stretton said:
“I’m not sure that much valuable reform has sprung from high theory about the dynamics of distribution. More has come from ...competent accounting, summarising and insistent publication of the patterns of inequality… and the effects of those distributions on the quality of people’s experience in life.” 6
2. Be a sceptic
It is somewhat uncomfortable to say this as the leader of the organisation that prides itself on evidence-based, often data-driven, analysis. But in almost all data analysis we deal with imperfect data and are forced to make choices about how to address that.
In inequality research those choices can make a big difference to the story.
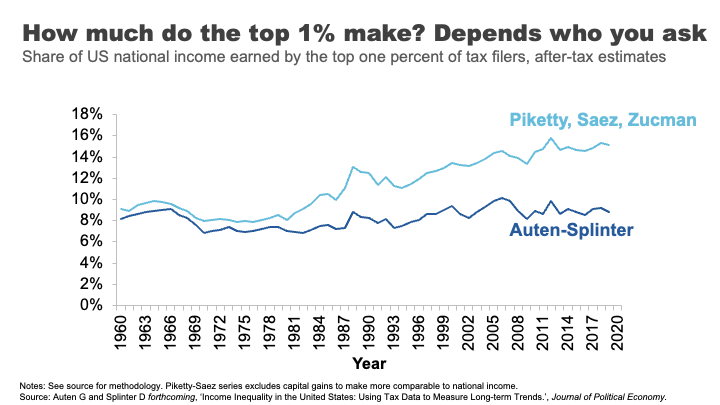
Very recently this challenge has jumped off the pages of academic journals and on to the front page of the Washington Post with the so called ‘inequality wars’.
On one side of the war you have famous inequality researchers, Thomas Piketty and Emmanuel Saez.
They have spent the better part of two decades analysing inequality, including by using American tax data to document a significant and growing share of US incomes flowing to the top 1%.
It’s rare to get rock star economists, but these guys are it.
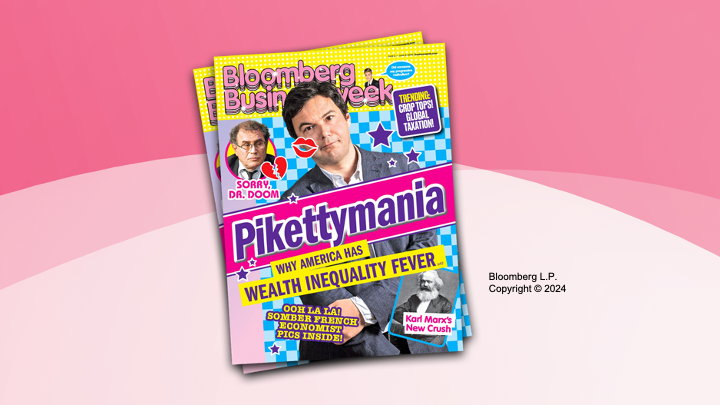
(As an aside if you purchased but did not finish Piketty’s hefty Capital in the 21st Century back at the height of Pikettymania in 2011 you are not alone, on some measures it is the second most unfinished book on Kindle, after Hilary Clinton’s autobiography...). 7
On the other side of the war sit Gerald Auten and David Splinter – their names might not ring any bells.
These two relatively unknown tax code nerds come from the US Treasury Department and Congress Joint Committee on Taxation.
Using the same tax data as Piketty and Saez, they come up with the opposite conclusion: after tax, the share of US income going to the 1 % has barely moved since the 1960s.
Cue much triumph from some commentators and members of the press.
But beyond the simplistic discussions of Piketty and Saez being proved ‘wrong’ was the more nuanced truth – both sets of researchers had made a series of judgments around issues like how to estimate ‘missing money’ not included in tax returns, and how to attribute spending on health, education or defence across the population.
The appropriateness of each of these judgements is now the subject of further debate, but what is clear is that what might seem like technical judgments can sometimes have a big effect on conclusions.
In all the analysis I present tonight we’ve tried to be as robust and open as we can about any judgments made. But I encourage you to keep your sceptics hat on.
3. There will be graphs
I’m an economist, there will be lot of graphs this evening. But I’ll do my best to ‘use my words’ and hopefully we can avoid data overload.
Income inequality in Australia
Ok, let’s start with talking about the broad distribution of income in Australia.
I know it’s not always au fait to talk about what you earn in public, so I’ll ask you to do this exercise in your heads. I want you to think about whether you consider yourself to be a low-income earner, a middle-income earner, or a high-income earner.
Let’s see how you went.
Here’s the distribution of Australian taxable income. That is, the income before tax but after you’ve made any allowable deductions.
If your taxable income is over about $51,000, you earn more than 50% of Australians who lodge a tax return. If you earn more than $95,000, that puts you in the top 20%. If you earn $336,000 or above – you are the 1%.
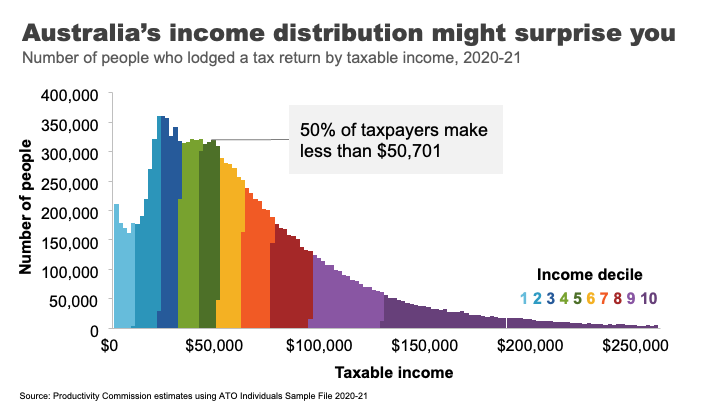
A surprising number of people get this wrong. In fact, the vast majority of us consider ourselves to be ‘middle income earners’. 8 This is probably because the people we tend to live near and associate with are more likely to be in a similar tax bracket to us.
This is presumably why every year or so high earners from the media and political class kick off passionate debates about whether $200,000 is really a high income 9 – while, I suspect, the 97 % of Australians earning less than that amount just roll their eyes.
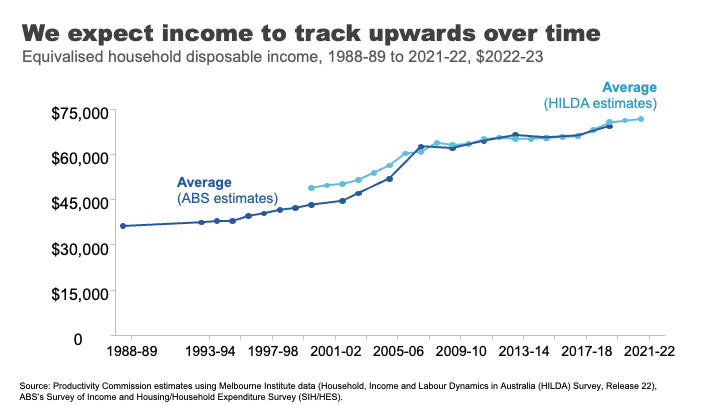
If we move to looking at using disposable income – that is income after tax and transfers – for an average Australian household, we can see that incomes have risen over time.
This is generally what we have come to expect, that outside of short dips during major economic shocks, income growth will continue its long march upwards over time.
And how has this growth been distributed?
The answer is relatively equally across the population in recent decades.
Indeed, in the 30 years between 1989 and 2019, income grew pretty consistently across the income distribution. Those in the top 10% experienced slightly higher growth than other groups, but nothing like the strong growth in income inequality seen in the US that dominates much of our inequality discourse.
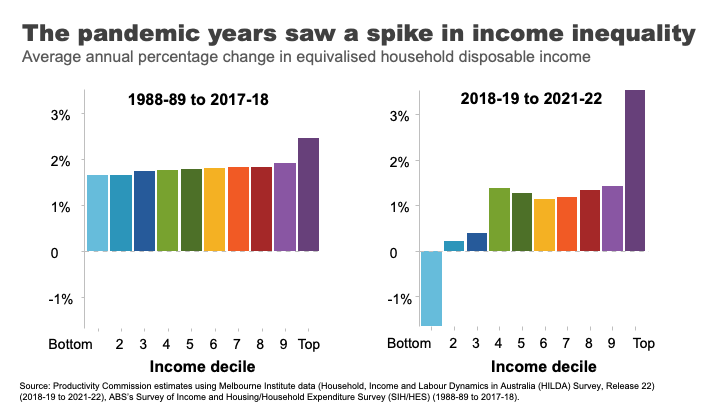
In contrast, the COVID period and its aftermath has seen greater dispersion with incomes at the top growing rapidly and those at the bottom going backwards.
The reasons are complicated, but reflect the roller coaster ride of lockdowns and recession, increases and withdrawals of government supports, and the healthy bounce back and high inflation that followed.
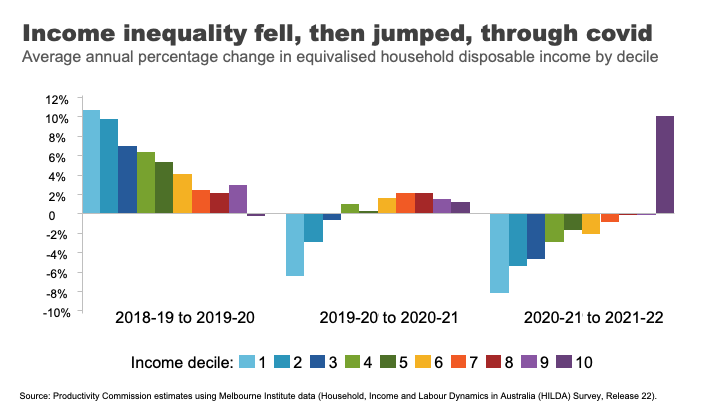
As you can see, the three years of the COVID period actually reflect three quite different inequality dynamics.
At the start of the COVID 19 pandemic, government-imposed lockdowns caused drastic declines in economic activity and widespread job losses. 10 In response, the Australian Government provided substantial support, which cushioned the economic harm across the community.
The effective doubling of the JobSeeker payment, and the flat $1500 per fortnight JobKeeper payment for workers in eligible businesses 11 produced high income growth for those at the bottom and middle of the income distribution.
As the economy re-opened, supports were withdrawn, those gains were reversed.
And despite the strong economy and labour market, high inflation meant real wages went backwards for most workers over the past two years.
In contrast, high income households benefited from rip-roaring growth in business income as well as decent investment income, as the economy recovered.
Overall, and barring any further major shocks, we can probably expect the next few years will bring a return to a more ‘normal’ income growth and certainly to the more consistent patterns seen across the distribution observed in the pre-COVID era.
It is also interesting to reflect on how we compare to other nations.
Egalitarianism is tied up with Australian identity. We are the land of the ‘fair go’, a place where your taxi driver, your boss, and even the Prime Minister can all be safely referred to as your ‘mate’.
But does the reality match the mythology?
Not entirely.
Australia’s income inequality is ‘middle of the pack’ by rich-country standards. Comparing based on the Gini coefficient – a measure of overall inequality – Australia is close the OECD average.
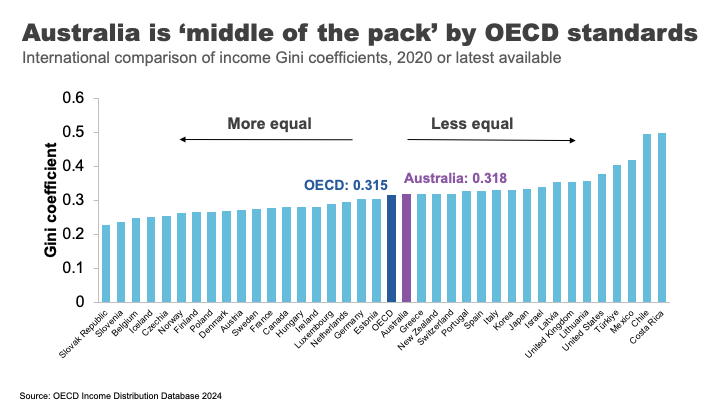
Overall, we not as unequal as our friends in the US and the UK, but nor are we as egalitarian as the Nordic countries.
One important reason for these large cross-country differences is differences in tax and transfer policies.
For example, the US starts relatively unequal, but by no means the most. But because they redistribute income less, they end up the most unequal of Western nations. 12 In contrast, Finland has close to US-levels of inequality before taxes and transfers. After, it is one of the most equal nations in the OECD. 13
These are important differences that highlight a point I want to come back to: policy choices matter to inequality.
But now we have a snapshot of how Australians across the distribution have fared over time and relative to elsewhere, I want to turn to another important part of the inequality story: outcomes and opportunities for the most disadvantaged.
Poverty in a rich country
It’s almost 40 years since Bob Hawke declared that no child would live in poverty by 1990. 14
But, according to ACOSS, one in eight people lived below the poverty line in 2019-20, including one in six children. 15
This measure of poverty looks at relative income poverty – it’s set at 50 % of the typical Australian household disposable income, less housing costs.
Some argue it is better to look at absolute measures (for example, the amount of money required to be sure a household can achieve a basic standard of living) or indicators of material deprivation.
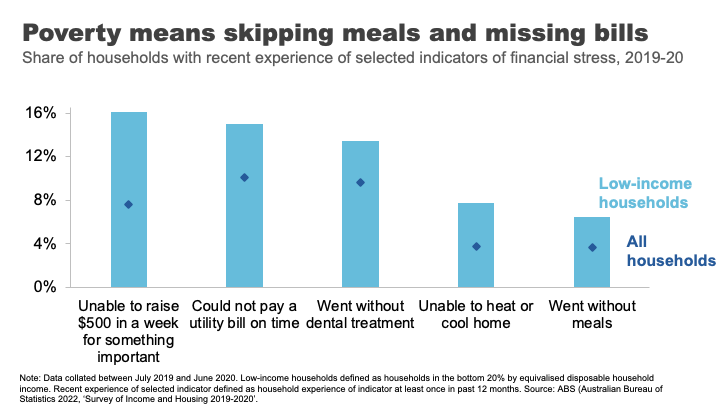
For example, amongst low-income households in 2019-20, 16% were unable to raise $500 for something important, 8% were unable to heat their homes, and 7% went without meals. 16
And it’s that sense of precariousness that pushes the impacts of poverty from the material to the mental. And those impacts can have a long tail.
As journalist Rick Morton writes about his own childhood growing up in a poor household: 17
I saw Mum’s daily, sometimes hourly, battles to stay solvent. I saw how hard she worked and what it did to her body and her mind. The stress of even thinking of it now is difficult to explain. It is built not only into my own mind but also in my flesh. The things I will do to avoid the feeling today. The things I try to do for Mum to make it so she never has to feel it again.
The biggest risk factors for poverty are: being on JobSeeker or Parenting Payment. 18
Policy and poverty remain inextricably linked.
Wealth inequality in Australia
Of course economic differences are not just found in incomes. Wealth or how much money you have ‘behind you’ is an important determinant of outcomes too. Wealth is a buffer – it can be converted into future consumption opportunities and provides a sense of financial security.
That is why we understand the pensioner who owns their home and has $250,000 in the bank is in a materially different economic position to the single part-time worker who records a similar $30,000 income but has few assets.
Wealth has grown significantly in Australia in recent decades.
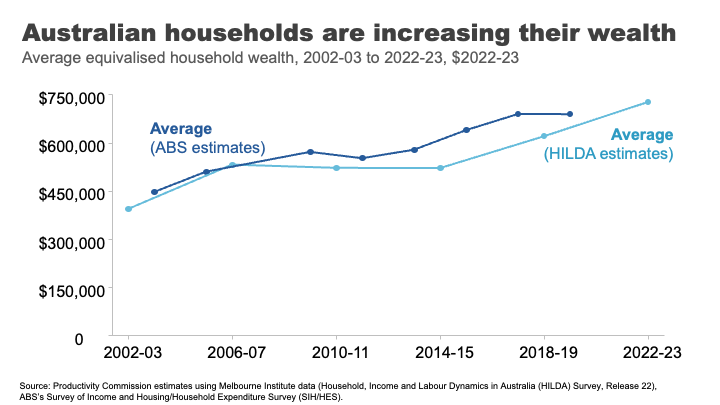
I remember in primary school the shorthand for someone really, really, rich was a ‘millionaire.’ The average Australian household is now more than halfway to that benchmark. Indeed, a person that owns a typical house outright in Clarence Gardens is a ‘millionaire’. 19
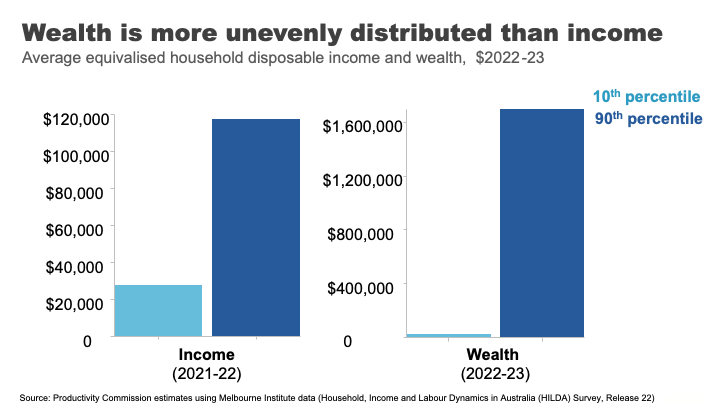
Wealth overall is much less evenly distributed than income.
If we take a household at the 90th %ile for wealth, they have almost 70 times as much wealth as the Australians at the 10th %ile. For income the figure is only four times as much.
Wealth also has much greater extremes.
In his 2013 book on inequality, Battlers and Billionaires, Parliamentarian and economist Andrew Leigh provided a memorable analogy, which I have updated today:
Imagine a ladder on which each rung represents a million dollars of wealth. If we were to put all Australian households on this ladder 50% of us are about halfway to the first rung, the top 10 % are about 1.5 rungs up, the top 1% are reaching for the fifth rung – just high enough to clean the gutters. 20 Gina Rinehart is more than 11kms off the ground. 21
But even with this very long ladder, Australia’s wealth inequality is lower than many other OECD countries. 22
But an important question is how has the distribution changed in recent decades?
The answer is: it’s complicated.
Pre-pandemic, wealth grew faster for the top half of the distribution.
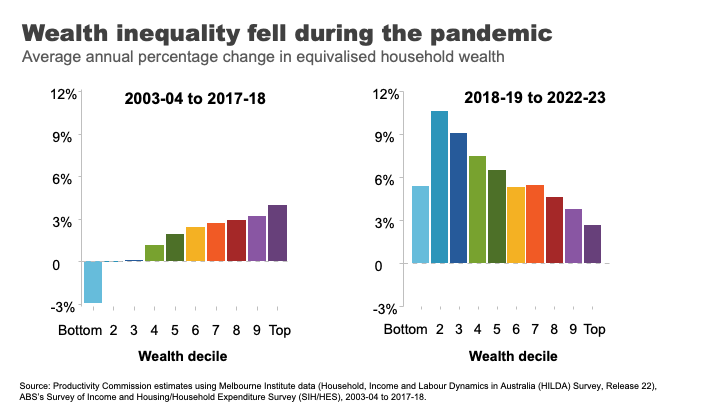
But the pandemic once again, produced some surprising results.
This pattern flipped and wealth grew more quickly overall and significantly faster for lower and lower middle wealth groups during the COVID period.
The two main reasons for this are:
- The strong growth in housing prices, particularly in the regions and the smaller capital cities. This had the biggest impact for homeowners in the lower middle and middle parts of the wealth distribution.
- Higher income from increased government support during the pandemic and fewer opportunities to spend, helped boost bank balances and debt repayment among low-wealth households. 23
And while this is good news for many households at least in the short-term, the longer-term run-up house prices has produced a different set of inequality concerns.
A decaying dream? House prices and inequality across generations
Here I want to stop and reflect on the different ways in which the very strong growth in house prices has impacted economic outcomes for different groups in Australia.
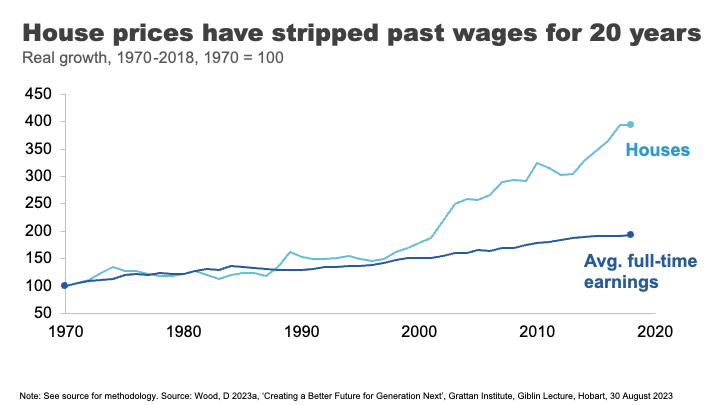
Until the 1990s, house prices broadly tracked growth in incomes. But between 1992 and 2018 they grew at almost three times the pace on average. 24
The effect has been an increase in the upfront barrier to home ownership and increasingly also the ongoing costs for those that are able to clear that hurdle.
The result, unsurprisingly, has been falling home ownership.
In the early 1980s, when my parents were buying their first home, around 70% of those in their early 30s owned a home. Today that figure is just 50%. And the drops have been particularly acute amongst low-income young people. 25
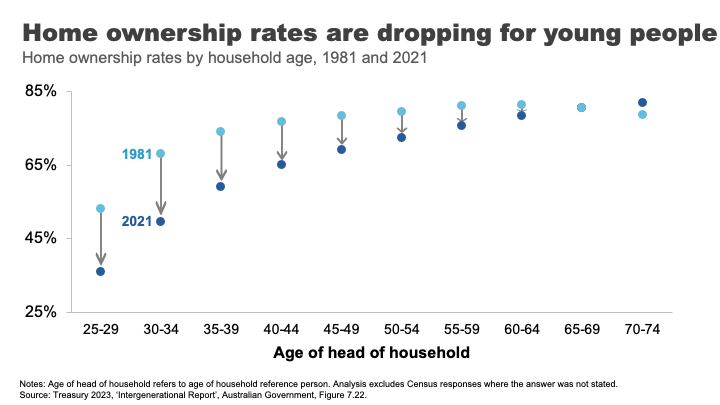
The declining opportunities for homeownership are a particular source of dissatisfaction and unrest amongst many non-homeowning younger Australians. Amongst the so-called Generation Z non-homeowners, 93% want to own their own home. But only 63% think it is likely that they ever will. 26
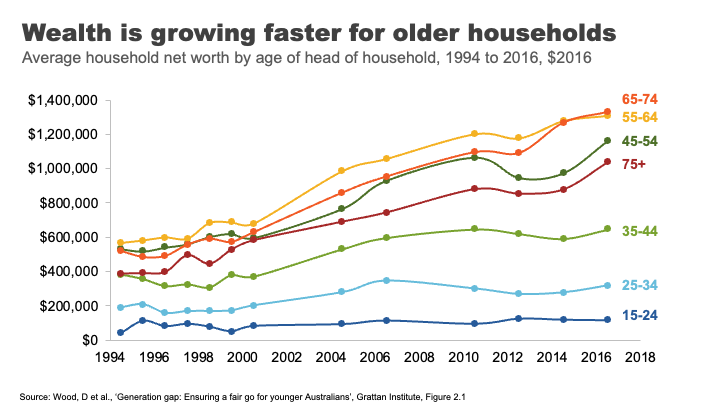
The rise in house prices has also contributed to rising generational disparities in wealth accumulation.
Older households have always had more assets on average than younger ones. But the run up in house prices has created windfall gains for existing homeowners. This has been a major contributor to the rapid growth in wealth among older households.
A household headed by someone aged 65-74 had on average $1.3 million in assets in 2016, up from $900,000 for the same age group in 2004. Rising asset prices over the past seven years mean this figure is almost certainly substantially higher now.
In contrast, the wealth of households under 35 has barely moved in 15 years. And poorer young Australians have less today than poorer young Australians did 15 years ago. 27
Overall the developments in the housing market over recent decades have left many, particularly many older Australians, very well off. But the cost has been considerable housing stress amongst the vulnerable, and a generation of younger Australians who will reach middle age with substantially lower rates of home ownership than their parents.
Land of the fair go? Social mobility in Australia
Now I want to move from the photo to the movie: from talking about disparity in economic outcomes at a point in time to talking about how these outcomes can evolve over someone’s life.
A question that has rightly been of interest to those concerned about inequality, is how does inequality in outcomes influence equality of opportunity. ;Or to be more specific – how much are economic opportunities determined by who are our parents are?
Generational mobility has historically been a hard thing to study. To understand its dynamics we need linked data on parental economic outcomes and those of their children over a long duration.
In the absence of this type of data, at least until recently, people got creative.
In one of my favourite studies, Parliamentarian Andrew Leigh alongside co-authors Gregory Clark and Mike Pottenger, identified rare surnames in the 2014 electoral roll among doctors and university graduates from 1870. They found, nearly 150 years later, that people with those rare surnames are more likely to be in the so called ‘elite’ professions than people with surnames such as Smith.28
Indeed, they found that so called ‘status persistence’ for surnames was as high in Australia as for England or the United States. 29
In somewhat brighter news, more recent studies using linked administrative data point to a more optimistic picture on social mobility in Australia.
Looking at economic outcomes for a million individuals born between 1978 and 1982 Economists Nathan Deutscher and Bhashkar Mazumder find that Australia is one of the more economically mobile advanced economies. 30>
Indeed, they find Australia’s ‘intergenerational elasticity of income’ (a measure of how much your family’s income affects your own) is similar to Canada and close to those of the Nordic countries, and considerably more mobile than places like the United States. 31
In forthcoming work the Productivity Commission uses family-linked tax data that confirms that estimates of intergenerational mobility remain comparatively high.
But in contrast, things may be stickier for those doing it toughest.
In a 2017 study, Professor Deborah Cobb-Clarke and her co-authors showed that young people are 1.8 times more likely to need social assistance if their parents have a history of receiving social assistance themselves. 32
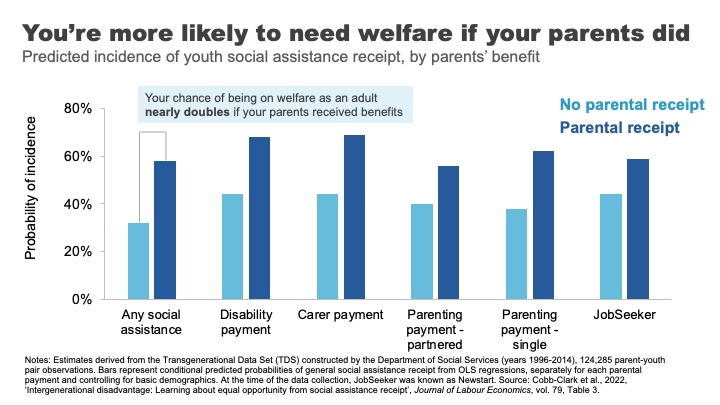
Consistent with this, the Productivity Commission’s forthcoming work shows that people in their late 20s whose parents received social transfer payments were about one and a half times more likely to receive social transfer payments themselves.
The Cobb-Clarke work showed that these transmission effects were particularly pronounced for disability payments, payments for those with caring responsibilities, and parenting payments for single parents. Interestingly, disadvantage stemming from parents’ poor labour market outcomes was much less persistent. 33
Cobb-Clarke and her co-authors posit that parental disadvantage may be more harmful to children’s later life outcomes if it is more strongly driven by circumstances rather than personal choice.
This aligns with the growing appreciation by economists of the impact of lack of hope or despair in shaping life choices and outcomes. 34
This was the sentiment expressed by a Tasmanian woman on welfare supports: 35
It’s not so much what we are missing out on, it’s the next generation and it is a hard cycle to break because they look at it and think, well, what’s the point? We’re always going to be poor, things are hard, nothing’s going to get better. Why should we bother?
Schools under stress: a red flag for future mobility?
One of the foundational supports for economic mobility is a strong education system.
Indeed, educational attainment has been estimated to explain up to 30 % of the transmission of economic advantage between parents and children. 36
Australia has historically had a strong system of school education that has supported opportunities across the population.
But there are some red flags for future prosperity and mobility that we should heed.
Indeed, despite growing funding in recent years, Australia’s school system has not been delivering the results we want for our young people.
Data from the OECD suggest that the performance of Australian school students in Reading and Maths is going backwards, with significant falls in our levels of achievement since 2000.
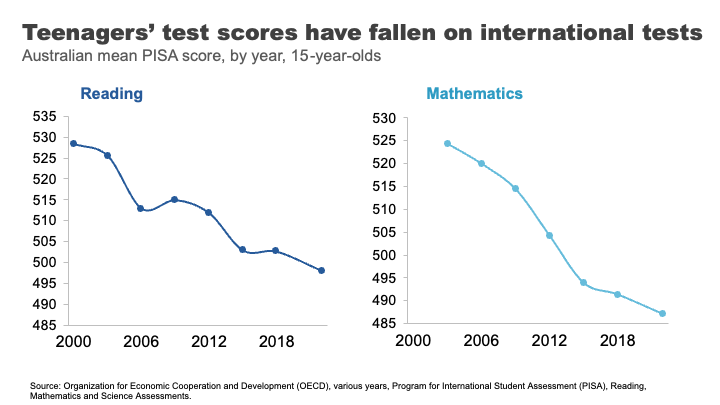
Estimates based on this data suggest the average Australian Year 10 student in 2018 was eight months behind in reading compared to where Year 10 students were at the turn of the century, and results have largely flatlined since. 37 We’ve seen even sharper declines in mathematics scores, where the decline for Year 10 students by 2018 was almost a year of learning.
But how much does parental background make a difference to how students fare?
The answer is a lot. More than half of the most economically disadvantaged 15-year-old students in Australia are not proficient readers.
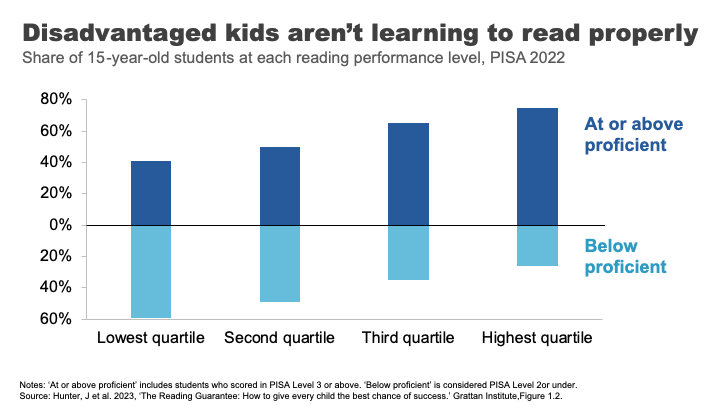
Analysis from the Grattan Institute shows that the disparity in outcomes was worse in Australia than in Canda or the UK and on par with the US. 38
These gaps in performance widen through the schooling process.
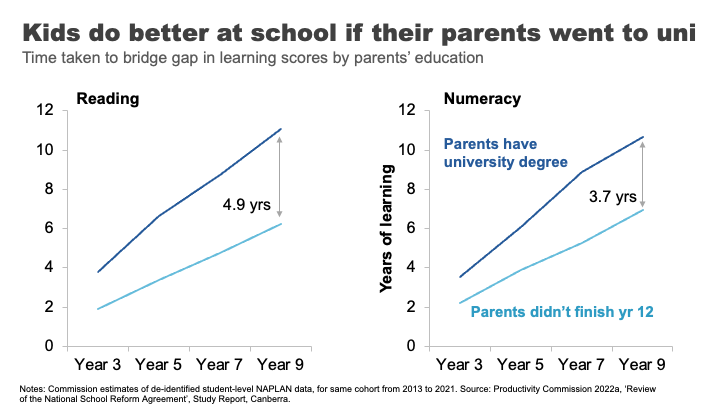
The Productivity Commission looked at this using NAPLAN data. 39 We compared the average reading outcomes of students whose parents did not finish high school to those whose parents have a bachelor’s degree or higher. We found the learning gap – equivalent to almost two years of reading achievement in Year 3, progressively widens to an almost 5-year learning gap by the time students reach Year 9.
For mathematics, the gap widens from 1.3 to almost 4 years.
If we take education as an indicator of both a country’s future economic prosperity and its social mobility – this data must concern us.
It has been pleasing to see senior leaders, including here in South Australia, engage with this issue and its implications. But turning the ship around will require significant shifts in the way we deliver education in Australia.
A nation divided: why mixing matters for mobility
Another less obvious mobility-enhancer is where we grow up, and more specifically, who we grow up with.
US economist Raj Chetty and co-authors made a splash in 2014, when their study using administrative records on the incomes of more than 40 million children and their parents found very large variations in social mobility across the US. For example, they estimated a child from the poorest 20% of families had nearly a 3 times better chance of making it into the top 20% of income earners as an adult if they lived in Silicon Valley rather than Charlotte North Carolina. 40
In a later paper, Chetty and another co-author reinforced the importance of these neighbourhood effects by studying outcomes for families who moved to different parts of the Unites States.
They found that outcomes for children whose families move to a better neighbourhood improve the more time they spend there.
Indeed, every additional year in a ‘good neighbourhood’ sees that child’s outcomes converge closer to the average for that neighbourhood by about 4 %.41
And if you are thinking that this type of locational lottery could only exist in a place as unequal as the United States – think again.
Economist Nathan Deutscher has replicated this work for Australia. 42
And while the dipartites between regions are less pronounced here, we see the same convergence in outcomes, the longer a child is exposed to a ‘good neighbourhood’.
Deutscher finds that place matters most during the teenage years and suggests it might be ‘peer effects’ that explain locational differences in outcomes.
In other words, who you hang around with in those formative years makes a difference. Which may well be a validating result for any parent that has ever uttered the immortal phrase: “If Tanya jumped off a cliff, would you do it too?”.
This is consistent with more recent work that suggests it is economic connectedness – the capacity of low socioeconomic people to make friends with those from higher socioeconomic groups – that is the principal driver of social mobility. 43
And this is the very thing that gets lost as neighbourhoods and schools become more stratified and we participate less in social mixing opportunities. This means that observed declines in the types of activities that help build the social glue – from volunteering, to local sport, to attending church – over time might further erode social mobility.
What’s a policy maker to do?
Where does all this leave policy makers?
How much policy makers should seek to address inequality is not a straightforward question. It has been dissected by philosophers since Plato. And economists have been at intellectual fisticuffs over it for much of the past century.
Today, even the strongest advocates for greater equality will acknowledge that some inequality is inevitable and that it is important to maintain incentives for innovation and effort.
Many of the richest people in the world – Gates, Dyson, Musk – are innovators whose work has reshaped our lives. It is at least partly the ‘size of the prize’ available to successful innovation that drives the efforts and risks of would-be innovators and entrepreneurs.44
On a more relatable level, let’s think of the University we are at tonight. Would we expect students to flow through these gates to spend years of their lives learning about engineering or medicine or economics, and to work long hours while establishing themselves in their career, without some return for these efforts? In other words, incentives are important for growing the pie, even if they result in a somewhat unequal distribution of it.
On the other hand, even many of capitalism’s biggest cheerleaders raise concerns about the social and economic implications of stark economic dispersion.
Recently the IMF has warned that high inequality and especially poor social mobility can impact on long-term economic growth. 45 Others have shown that physical and mental health problems are worse in more unequal societies, predominantly due to the physiological stress of operating within a steep economic hierarchy. 46 And still others have linked rising inequality, or declining social mobility, 47 with the rise of populism as the ‘left behind’ lodge their protests vote against the so called elite.
All of this is to say that targeting inequality is complex. And while the ‘line’ across which inequality flips to doing more harm than good is far from clear, what is clear is that policy makers have a broad set of tools that can help push in their desired direction.
A policy makers’ toolbox
A few years ago, a group of high-profile economists organised an international conference on combatting inequality with a mission of engaging with the full suite of policy responses. 48
Their conclusion, although not revolutionary, provides helpful clarity: that the right policy response depends on why you care about inequality.
In particular, they draw a distinction between policies concerned with:
- outcomes for most disadvantaged – particularly for addressing entrenched poverty
- boosting opportunities for a ‘hollowed out’ middle class – a much greater concern in the United States than here, where, as we have seen, income growth has been broader based
- opportunity hoarding – or the way wealthy people might leverage their economic and political power to entrench their position.
The right policy tool will also depend crucially on whether policy makers are more concerned with equality of opportunity or outcomes.
Below is an adapted version of the taxonomy they created. It shows the breadth – and importantly the targeting of different levers that a would-be inequality buster might pull.
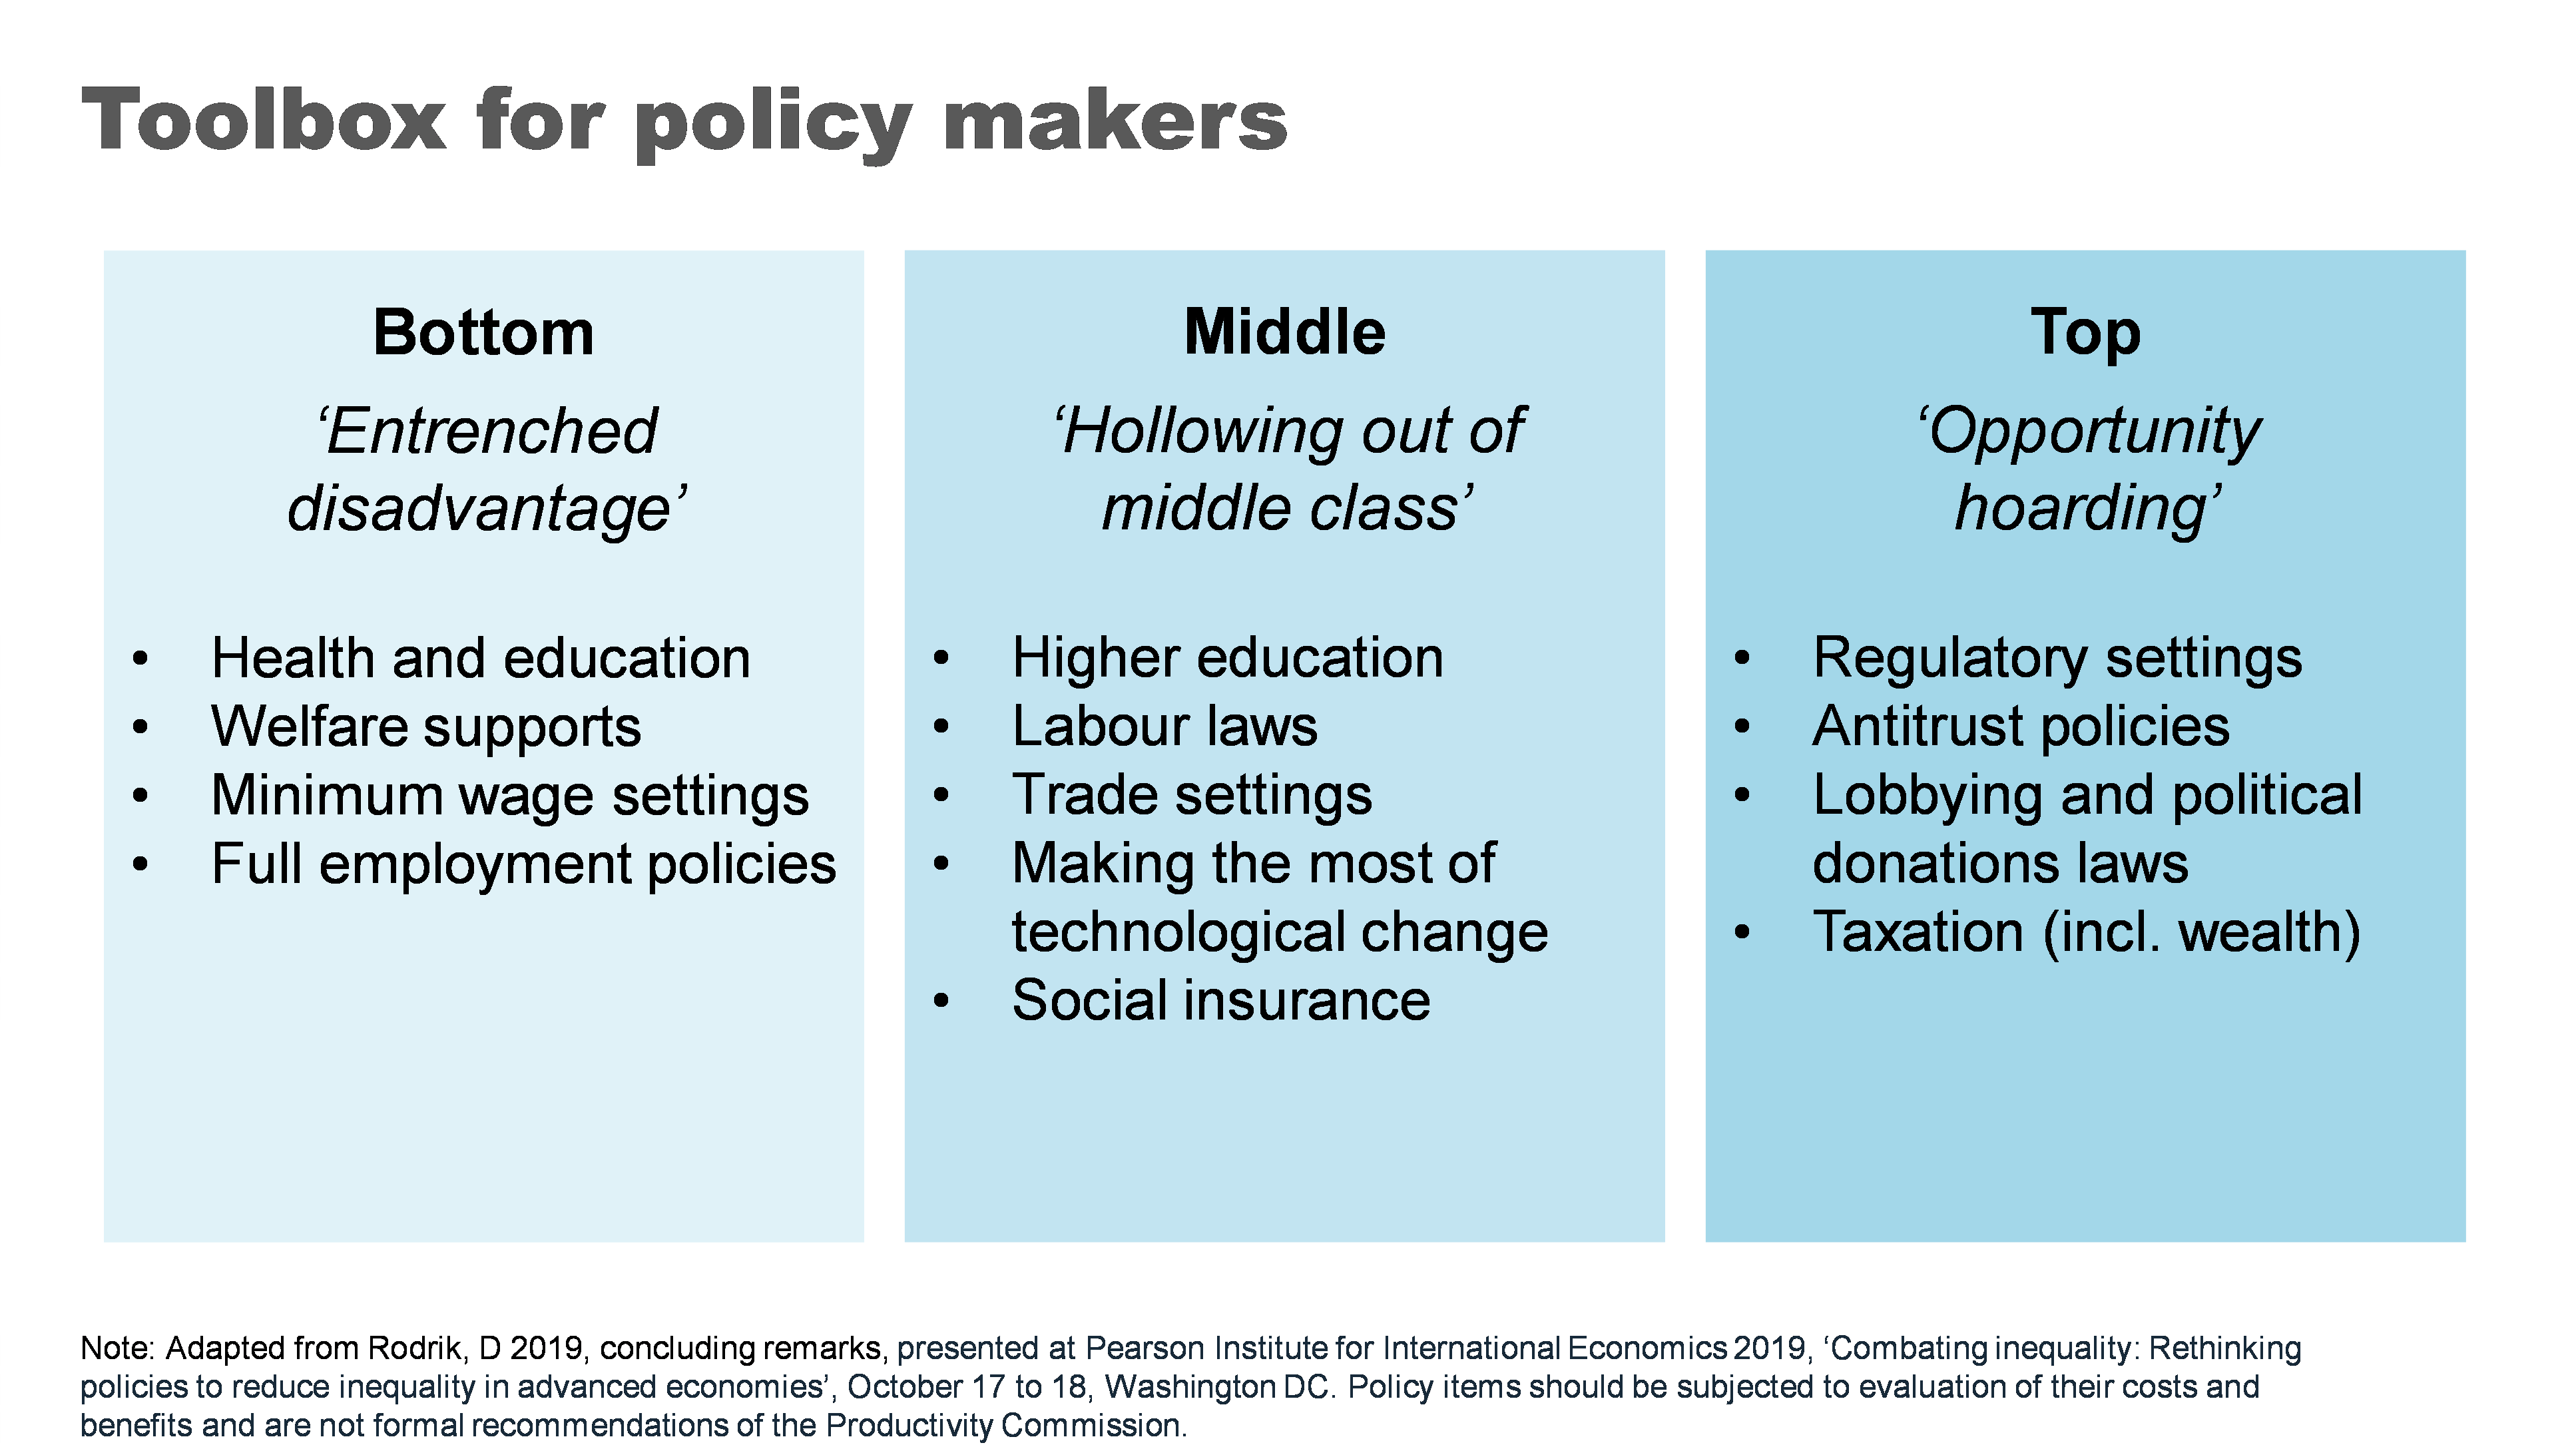
Now I do not advocate for all of the policies proposed. Indeed, whether any of these policies would be a good idea would require careful analysis of the costs and benefits in the particular context you might use them. There are probably good ideas that have been left out too.
But I did want to talk very briefly about four of the ‘biggies’ that I think really matter in an Australian context.
Growing the pie can mean bigger slices for all
Now in a presentation largely focused on distribution of the pie, I want make the case for making the pie bigger.
A cross-country and cross time evaluation suggests that growth is effective in reducing poverty. 49 Indeed, incomes for the bottom 10% are highly correlated with overall economic growth – a rising tide lifts some very important boats. We could put this beyond doubt for Australia by addressing some of the weaknesses in the current social safety net - a point I’ll return to.
The impact of higher economic growth on overall inequality is less clear. 50 But what is clear is that faster economic growth gives governments more room to support more generous welfare policies as well as other social spending on areas like education and health that particularly benefit those at the bottom and middle of the income distribution.
More generally healthy income growth can also support the political ‘buy in’ for these types of policies. 51
As for what governments can do to grow the pie – that would be a whole other lecture. But if the pie is of interest: ‘here’s one I prepared earlier’. My colleagues have published a comprehensive 1000-page guide for governments looking for ways to boost productivity and growth. 52
Fixing the housing mess
A functioning housing system is critical for improving our social and economic outcomes. Building more houses closer to jobs and amenities is needed to help younger and poorer Australians access the same opportunities as previous generations.
Australia’s population has grown strongly over the past two decades and will likely continue to do so. We can choose to push people out to the ever-expanding fringes of our cities or accommodate them through boosting supply in the inner and middle ring suburbs where most would prefer to live.
Allowing greater density in these areas not only expands supply but also boosts variety in housing choices, supporting more of the cross-socio economic mixing critical to social mobility.
After at least two decades of letting the ‘housing market frog’ slowly boil, there have been some positive steps from both Commonwealth and State governments to support the planning changes needed to boost supply. In particular, the Commonwealth government has offered incentives for states to target the construction of 1.2 million new homes over the next five years. 53
Similarly, moves to boost social housing are also a positive step, particularly where they’re targeted to those with the highest need.
Unfortunately, this new-found policy energy has come at the same time as the building industry faces challenges in ramping up.
But over time, if ambitious growth targets can be met, this could be a powerful shift in reducing inequality both within and between generations.
An education revolution?
School education is fundamental to supercharging opportunities for the next generation.
And while some of the problems our system faces are thorny, some of the solutions are surprisingly straightforward.
Our focus should start with getting the basics right – our schools should be supported and held accountable for delivering basic levels of literacy and numeracy. 54 My former colleagues at Grattan have called for a ‘Reading Guarantee’ – whereby governments would commit to ensuring at least 90 % of Australian students learn to read proficiently at school. 55
Supporting schools and teachers to deliver on these basics would require:
- making sure all teachers adopt evidence-based teaching practices such as phonics decoding for reading 56
- providing all schools and teachers access to a bank of well-sequenced high-quality curriculum materials 57
- reducing low value tasks for teachers to free them up to spend time on what really matters, 58 and
- providing better career paths to help schools attract and retain top teachers, and allowing top teachers to support and develop others in the profession. 59
Boosting social safety net
The Federal Government’s Economic Inclusion Committee just released its second report designed to inform the budget process.
Its lead recommendation remained unchanged from last year: to increase the rate of the JobSeeker and related income support payments.
The Committee finds that Australia’s unemployment benefits have been slipping further and further behind community living standards for two decades. 60
And while the recent 10% increase to Commonwealth Rent Assistance will provide much needed relief – as did the extra 15% in the last Budget – the Committee’s report demonstrates that the value of the payments has fallen significantly relative to average rents for the past 25 years. 61
Today, Australia’s payments to the short-term unemployed, including housing benefits, are the least generous in the OECD. 62
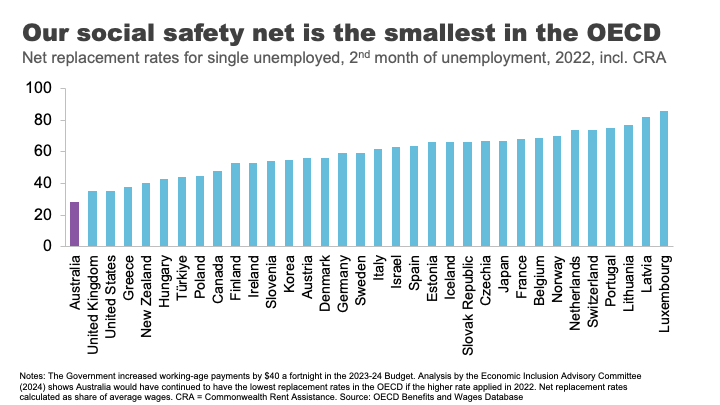
No single measure would do more to alleviate poverty than a material change in these payments.
What’s stopping us?
Partly it’s likely to be well-meaning concerns about the impact on incentives to work.
But consistent with previous work, the Economic Inclusion Advisory Committee finds that the negative effect on incentives is likely to be small, because current levels of the payment are so far below incomes from working. 63
Indeed, for those facing economic exclusion, higher income support payments may improve the capacity to search for and accept employment. 64
Second, is the cost. Moving as far as the Economic Inclusion Advisory Committee recommends on JobSeeker and related payments could cost up to $4.6 billion per year, 65 which is not straightforward for governments balancing a range of competing priorities. But as targeted interventions to address poverty go, there is very little waste.
Finally, there is the question of community support. Boosting Jobseeker payments rarely garners majority support across the population. 66 As I have previously argued, this is less a case of Australians being mean spirited and more about the grip of some persistent and unhelpful myths about welfare recipients. Your regular community service reminder tonight: the median Jobseeker recipient is a 45-year-old woman. 67
Finding our inner Stretton
And with that I want to wrap up where I began, with Stretton’s legacy.
Inequality is one of those topics where it is easy to simply revert to tired tropes, particularly off shelf ones from elsewhere.
Stretton encouraged us to look with curiosity and rigour, but also with an open heart. In doing so, everyone may take away something different from the numbers and analysis I have shared tonight.
To me, there are bright spots in the story. Australia has grown its income and wealth over several decades, and it has shared those gains broadly. Social mobility is relatively high.
On the other hand, many relying on payments are in poverty and the long shadow of that experience can be hard for children to escape. Our schools and suburbs are becoming less of a springboard for mobility. And we have made the Australian dream out of reach for a generation of young people.
Policy matters – there are many levers that governments can pull to make a difference to these outcomes. But it is up to Australians to decide which ones we want them to use.
Footnotes
- Munro, D 2016, ‘The House that Hugh Built, the Adelaide history department during the Stretton era, 1954-1996’, History of Education vol. 46, no. 5, p.634.. Return to text
- Ibid, p.631. Return to text
- Spoehr, J 2015, ‘Hugh Stretton: a great Australian public intellectual’, The Adelaide Review, 7 September. Return to text
- Davison, G 2018, ‘Watching a brilliant thinker stretching his mind’, Inside Story, 11 October. Return to text
- Spoehr, J 2015. Return to text
- Gibilisco, P and Stretton, H 2003, ‘A pragmatic social democrat: an interview with Hugh Stretton’, The Journal of Australian Political Economy, vol. 51, pp. 13. Return to text
- The Guardian 2014, ‘Can the Hawking Index tell us when people give up on books?’, 8 July.Return to text
- Hoy, C, and Mager, F 2021 ‘Why are relatively poor people not more supportive of redistribution? Evidence from a randomized survey experiment across ten countries.’ American Economic Journal: Economic Policy, vol. 13, no. 4, pp. 299–328.Return to text
- Hobman, J 2022, ‘EXCLUSIVE: 'It barely cuts it': Aussie finance guru exposes why $200,000 a year is NOT a big salary anymore - despite most of the country earning MUCH less - but not everyone agrees’, The Daily Mail, 14 July; Martin, P 2021, ‘Other Australians don’t earn what you think. $59,538, is typical.’ The Conversation, 8 June. Return to text
- Coates, B and Ballantyne, A 2020, ‘No one left behind: Why Australia should lock in full employment’, Grattan Institute. The unemployment rate surged from 5.2% in March 2020 to a peak of 7.5% in July 2020. ABS (Australian Bureau of Statistics) 2024, ‘Labour Force, Australia, Detailed, February 2024’. Return to text
- The Australian Government provided JobKeeper payments of $1,500 per fortnight to eligible businesses, which had to be paid to their employees, to minimise job losses and maintain employment and job attachment. AIHW (Australian Institute of Health and Welfare) 2021, ‘Australia’s welfare 2021: data insights’, pp. 84–86. The flat payment of $1,500 per fortnight meant some people – particularly part time workers – received more than their salary, while for others it led to a reduction in their salary. Treasury 2023, ‘The Australian Government Independent Evaluation of the JobKeeper Payment Final Report’, 28 September. Return to text
- Hasell, J 2023, ‘Income inequality before and after taxes: How much do countries redistribute income?’, Our World in Data Return to text.
- Ibid. Return to text
- As Prime Minister, Bob Hawke made the declaration in 1987, with the intention to reach the goal by 1990. Hawke, B 1987, speech delivered at Sydney, NSW, June 23rd, Museum of Modern Democracy: Election Speeches. Return to text
- Davidson, P, Bradbury, B and Wong, M 2023, ‘Poverty in Australia 2023: Who is affected’, Poverty and Inequality Partnership Report no. 20, Australian Council of Social Service and UNSW Sydney. Return to text
- ABS (Australian Bureau of Statistics) 2022, ‘Survey of Income and Housing 2019-20’, Australian Government. Return to text
- Morton, R 2020, On Money, Hachette Australia, p.18. Return to text
- Davidson, P, Bradbury, B and Wong, M 2023. Return to text
- ‘Clarence Gardens Adelaide - Greater Region, SA 5039’, https://www.realestate.com.au/sa/clarence-gardens-5039/, accessed 12 May 2024. Return to text
- Leigh, A 2013, Battlers and Billionaires: The Story of Inequality in Australia, Schwartz Publishing, Melbourne, updated according to Productivity Commission estimates using Melbourne Institute data (Household, Income and Labour Dynamics in Australia (HILDA) Survey, Release 22). Return to text
- Estimate based on data from AFR (Australian Financial Review), ‘Rich List 2023’, https://www.afr.com/rich-list, accessed 12 May 2024. Return to text
- Shorrocks, Lluberas, Davies and Waldenström 2023, ‘Global Wealth Report 2023’, Credit Suisse and UBS Global Wealth Databook. Return to text
- See Productivity Commission 2024, ‘A snapshot of inequality in Australia’, Research paper, Canberra, pp. 25-30 for a discussion. Return to text
- Wood, D 2023a, ‘Creating a Better Future for Generation Next’, Grattan Institute, Giblin Lecture, Hobart, 30 August 2023. Return to text
- Coates, B 2022, ‘Levelling the playing field: it’s time for a national shared equity scheme’, Grattan Institute. Return to text
- Susan McKinnon Foundation 2023, ‘McKinnon Poll: Understanding attitudes towards housing in Australia’, September, p.90. Return to text
- Wood, D 2023a. Return to text
- The authors define a set of elite ‘rare’ surnames in 1900 as those surnames where 29 or fewer people held the name in Australia in 2014 in the voting roll, and where someone holding that name graduated from Melbourne or Sydney universities 1870-1899. Clark, G, Leigh, A, and Pottenger, M 2020, ‘Frontiers of mobility: Was Australia 1870–2017 a more socially mobile society than England?’, Explorations in Economic History, vol. 76. Return to text
- Ibid. Return to text
- Deutscher, N and Mazumder, B 2020, ‘Intergenerational mobility across Australia and the stability of regional estimates’, Labour Economics, vol. 66. Return to text
- Ibid. Return to text
- Cobb-Clark et al., 2022, ‘Intergenerational disadvantage: Learning about equal opportunity from social assistance receipt’, Journal of Labour Economics, vol. 79. Return to text
- Ibid, pp.16-17. Return to text
- Case, A and Deaton, A 2020, Deaths of despair and the future of capitalism, Princeton University Press, Princeton. Return to text
- TASCOSS 2022, ‘Wellbeing First: A budget proposal to ease the cost of living and invest in the long-term wellbeing of Tasmanians’, 2023-24 TASCOSS Budget Priorities Statement, p.12. Return to text
- Breunig, R and Taylor, M 2023, ‘Success in life is tied to parental education. That’s why we need to track intergenerational school performance’, The Conversation, 14 February. Return to text
- Hunter, J et al. 2023, ‘The Reading Guarantee: How to give every child the best chance of success.’ Grattan Institute. Return to text
- Ibid, p.10. Return to text
- Productivity Commission 2022a, ‘Review of the National School Reform Agreement’, Study Report, Canberra. Return to text
- The authors found a child whose family is amongst the 20% most disadvantaged has a probability of ending up in the top 20% of income earners of just 4.4% if they live in Charlotte North Carolina, but 12.9% if they live in San Jose, in the heart of Silicon Valley. Chetty, R et al. 2014, ‘Where is the land of opportunity? The geography of intergenerational mobility in the United States’, The Quarterly Journal of Economics, vol. 129, no. 4, November, pp. 1553-1623. Return to text
- Chetty, R and Hendren, N 2018, ‘The impacts of neighborhoods on intergenerational mobility I: Childhood exposure effects’, The Quarterly Journal of Economics, vol. 133, no. 3, August, pp. 1107-1162https://academic.oup.com/qje/article/133/3/1107/4850660?login=false Return to text
- Deutscher, N 2020, ‘Place, peers, and the teenage years: Long-run neighborhood effects in Australia’, American Economic Journal: Applied Economics, vol. 12, no. 2, pp. 220-49. Return to text
- Chetty, R et al. 2022, ‘Social capital I: Measurement and associations with economic mobility’, Nature vol. 608, pp. 108-121. Return to text
- Deaton, A, ‘What’s wrong with inequality?’, The IFS Deaton Review, panellist introduction, https://ifs.org.uk/inequality/themes/whats-wrong-with-inequality/, accessed 19 May 2024. Return to text
- Cerra et al. 2021, ‘Links between growth, inequality, and poverty: A survey’, IMF Working Papers, Working Paper No. 2021/068. Return to text
- Wilkinson, RG and Pickett, KE 2009, ‘Income inequality and social dysfunction’, Annual Review of Sociology, vol. 35, pp. 493–511. Return to text
- Protzer, ESM 2019, ‘Social Mobility Explains Populism, Not Inequality or Culture’, Center for International Development at Harvard University, Working Papers, no.118. Return to text
- Pearson Institute for International Economics 2019, ‘Combating inequality: Rethinking policies to reduce inequality in advanced economies’, conference papers, October 17 to 18, Washington DC. Return to text
- Cerra et al. 2021. Return to text
- Ibid. Return to text
- Weisstanner, D 2023, ‘Stagnating incomes and preferences for redistribution: The role of absolute and relative experiences’, European Journal of Political Research, vol. 62, pp. 551-570. Return to text
- Productivity Commission 2023, ‘5-year Productivity Inquiry: Advancing prosperity’, vol. 1, Inquiry Report no. 100, Canberra. Return to text
- Productivity Commission 2022a, ‘Review of the National School Reform Agreement’, Study Report, Canberra. Return to text
- Hunter, J et al. 2023, ‘The Reading Guarantee: How to give every child the best chance of success’, Grattan Institute. Return to text
- Ibid. Return to text
- Hunter, J et al. 2022, ‘Ending the lesson lottery: How to improve curriculum planning in schools’, Grattan Institute. Return to text
- Productivity Commission 2022a. Return to text
- Goss, P and Sonnemann, J 2020, ‘Top teachers: Sharing expertise to improve teaching’, Grattan Institute; Gonski, D et al. 2011, ‘Review of funding for schooling: Final report’, Australian Government Department of Education, Employment and Workplace Relations. Return to text
- EIAC (Economic Inclusion Advisory Committee) 2024, ‘2024 Report to Government’, Australian Government Department of Social Services. Return to text
- EIAC 2024, p.62. See also Productivity Commission 2022b, ‘In need of repair: The National Housing and Homelessness Agreement’, Study Report, Canberra. Return to text
- EIAC 2024, p.54. Return to text
- EIAC 2024, pp.49-55. Return to text
- Ibid, p.55. Return to text
- EIAC, p.47. Return to text
- Wood, D 2023b, ‘The three myths that keep Australians in poverty’, The Sydney Morning Herald, 25 April. Return to text
- Ibid. Return to text
Acknowledgment
I would like to thank Productivity Commission staff especially Carmela Chivers, Sara Collard and the inequality team for their assistance with this speech. The speech draws heavily on their most recent work: A snapshot of inequality in Australia. All good ideas and analysis theirs – all mistakes my own.
Related publications
Related publications
