Indigenous Expenditure Report 2017
The 2017 Indigenous Expenditure Report was released on 26 October 2017. It provides estimates of the levels and patterns of Australian, State and Territory government expenditure on services relating to Aboriginal and Torres Strait Islander Australians. Data are available for 2015-16, with historical data provided for 2012-13, 2010-11 and 2008-09.
An explanatory note on the Indigenous Expenditure Report (IER)
The IER provides estimates of the levels and patterns of Australian, state and territory government expenditure on services relating to Aboriginal and Torres Strait Islander people. The document below is the latest edition of the IER, with the most recent data in respect of 2015-16.
The future of the IER is to be considered in the context of reporting under the National Agreement on Closing the Gap (see National Agreement on Closing the Gap | Closing the Gap). At this stage, a further IER has not been scheduled.
The IER provides data on all government expenditure. In 2015-16, the IER reported that total Australian, state and territory governments expenditure (for all Australians) was $556.1 billion, of which $33.4 billion was apportioned to Aboriginal and Torres Strait Islander people (6 per cent of total expenditure) and consisted of expenditure on:
- Indigenous specific services ($6.0 billion) – targeted expenditure understood to be exclusively for Aboriginal and Torres Strait Islander people – for example, Abstudy.
- Mainstream services (allocated on service use) ($21.4 billion) – services and programs available to all Australian individuals and/or families – for example, Medicare, school education, aged care.
- Mainstream services (allocated on population share) ($6.0 billion) – mainstream programs provided on behalf of the entire Australian community – for example, defence and foreign aid.
“The IER does not assess the adequacy, effectiveness, and efficiency of government expenditure. In addition, the IER expenditure figures do not show which people/organisations received funding to deliver government programs, nor the location of where money was spent (other than the state or territory)” said Alex Robson, Acting Chair Productivity Commission.
Key points and additional high level data
Key points
This Report provides estimates of Australian, State and Territory government expenditure for Aboriginal and Torres Strait Islander Australians across more than 150 expenditure categories. When combined with other information, the estimates contribute to a better understanding of the adequacy, effectiveness and efficiency of government expenditure on services to Aboriginal and Torres Strait Islander Australians. Expenditure may be compared across all States and Territories, and for Aboriginal and Torres Strait Islander, non‑Indigenous and all Australians.
In 2015‑16, total direct government expenditure on Aboriginal and Torres Strait Islander Australians was estimated to be $33.4 billion, a real increase from $27.0 billion in 2008‑09.
In 2015‑16, the estimated expenditure per person was $44 886 for Aboriginal and Torres Strait Islander Australians, around twice the rate for non‑Indigenous Australians ($22 356); a similar ratio to previous years in this Report 1. The higher per person expenditure (difference of $22 530) reflects the combined effects of:
- greater intensity of service use ($14 349 or 63.7 per cent) — because of greater need, and because of the younger age profile of the population
- higher cost of providing services ($8181 or 36.3 per cent) — for example, because of more remote locations, or because targeted services are provided in addition to mainstream services (for example, Indigenous liaison officers in hospitals).
In 2015‑16, Indigenous specific services (targeted expenditure assumed to relate exclusively to Aboriginal and Torres Strait Islander Australians) accounted for 18.0 per cent of direct expenditure on Aboriginal and Torres Strait Islander Australians, a decrease from 22.5 per cent in 2008‑09. Mainstream services (expenditure available to all Australians through services and programs — for example, school education) accounted for 82.0 per cent, an increase from 77.5 per cent in 2008‑09.
The Australian Government accounted for $14.7 billion (43.9 per cent) of direct Indigenous expenditure in 2015‑16, a real increase of $2.2 billion (17.5 per cent) from 2008‑09. The remaining $18.8 billion (56.1 per cent) was provided by State and Territory governments, a real increase of $4.3 billion (29.7 per cent) from 2008‑09.
This report does not assess the adequacy, effectiveness and efficiency of government expenditure on Aboriginal and Torres Strait Islander Australians. To do this requires the ability to link expenditure to individuals, and then determine the causality of that expenditure on outcomes (such as through a cost benefit evaluation). This is outside the scope of this report.
Direct expenditure by building block
The Key Points (above) provides high level information on Australian, State and Territory governments’ estimates of expenditure for Aboriginal and Torres Strait Islander Australians, including disaggregations by type of expenditure (Indigenous specific and share of mainstream) and over time (between 2008‑09 and 2015‑16).
Expenditure is further disaggregated across six broad areas that relate to the National Indigenous Reform Agreement and Overcoming Indigenous Disadvantage report building blocks: early child development and education and training; healthy lives; economic participation; home environment; safe and supportive communities; and, other government services. See the Glossary for details on expenditure categories in each building block.
In 2015‑16, expenditure per person for Aboriginal and Torres Strait Islander Australians was highest for safe and supportive communities ($10 948) and lowest for home environment ($4197). Expenditure on healthy lives, early childhood and education and other government services have shown upward trends since 2008‑09, while there has been a decrease for safe communities and for home environment (reflecting a decrease in Indigenous specific expenditure). Expenditure for economic participation has remained relatively stable (figure 1).
Figure 1 Expenditure on Aboriginal and Torres Strait Islander Australians, by building block and type of expenditure, by yeara, b
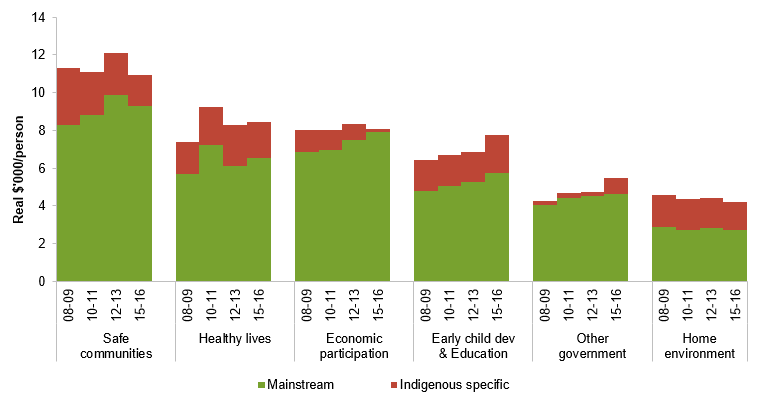
a Includes Australian, State and Territory governments direct expenditure. b Expenditure data adjusted in real terms to 2015-16 dollars.
Source: 2017 Indigenous Expenditure Report, tables W2, W4, W6, W8.
The proportion of government expenditure across building blocks differs for Aboriginal and Torres Strait Islander Australians and non-Indigenous Australians (figure 2). The largest proportion of expenditure per person for Aboriginal and Torres Strait Islander Australians was on safe and supportive communities (24.4 per cent), and for non‑Indigenous Australians it was on economic participation (23.2 per cent).
Figure 2 Expenditure on Aboriginal and Torres Strait Australians and non‑Indigenous Australians, by building block (per cent) 2015-16a
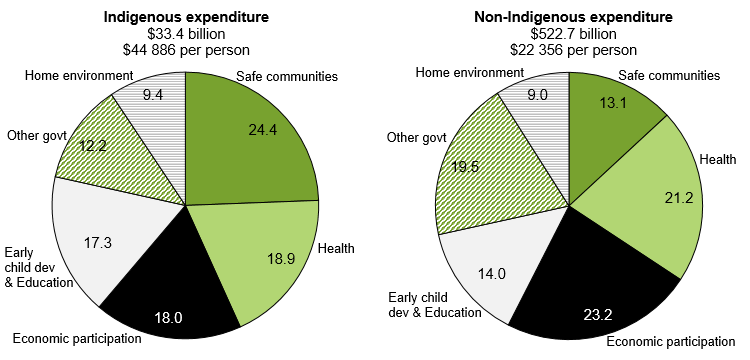
a Includes Australian, State and Territory governments direct expenditure.
Source: 2017 Indigenous Expenditure Report, tables W.17-18.
Direct expenditure by State and Territory
The Key Points (above) for the 2017 Indigenous Expenditure Report provides high level information on Australian, State and Territory governments’ estimates of expenditure for Aboriginal and Torres Strait Islander Australians, including disaggregations by type of expenditure (Indigenous specific and share of mainstream) and over time (between 2008‑09 and 2015‑16).
Expenditure is further disaggregated across the eight States and Territories, including between Australian, State and Territory governments.
In 2015‑16, expenditure per person for Aboriginal and Torres Strait Islander Australians was highest in the Northern Territory ($68 186) and lowest in Tasmania ($29 602). Expenditure per person has increased since 2008‑09 in all States and Territories except for the Northern Territory (the latter due in part to a decrease in Australian government expenditure to the NT) (figure 3).
Figure 3 Expenditure on Aboriginal and Torres Strait Islander Australians, by type of expenditure and level of government, by state and territory, by yeara, b
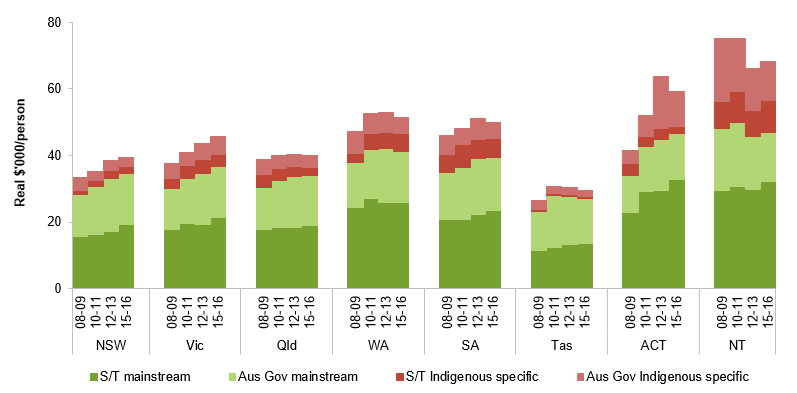
a Includes Australian, State and Territory governments direct expenditure. b Expenditure data adjusted in real terms to 2015-16 dollars.
Source: 2017 Indigenous Expenditure Report database (All government direct real table; tables P.1 and P.2).
The proportional split of government expenditure between States and Territories differs for Aboriginal and Torres Strait Islander Australians and non-Indigenous Australians (figure 4). For non-Indigenous Australians, it is close to the population share for all jurisdictions. For Aboriginal and Torres Strait Islander Australians, the proportion of government expenditure for NSW, Queensland and Tasmania is lower than their population shares, whereas for WA and the Northern Territory it is higher which could reflect in part higher intensity of service use or higher service costs (see Key Points above for further information on these concepts).
Figure 4 Proportion of all government direct expenditure on Aboriginal and Torres Strait Australians and non-Indigenous Australians, by State and Territory, 2015-16,a, b
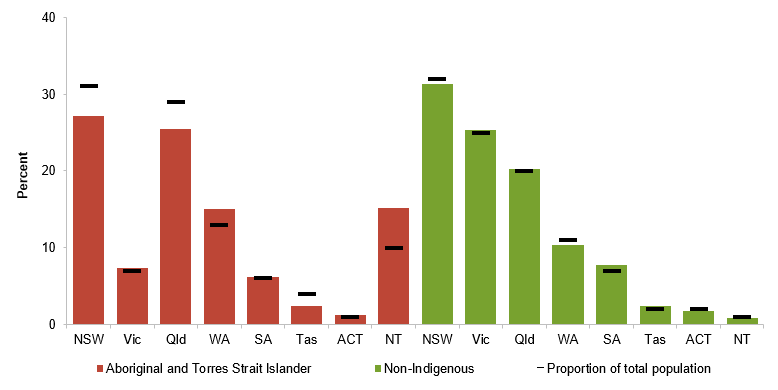
a Includes Australian, State and Territory governments direct expenditure. b Proportion of total population is the state population as a proportion of the national population.
Source: 2017 Indigenous Expenditure Report, table W.17; table 2.
Footnotes
- Estimates per person are not the same as estimates per user, and must not be interpreted as a unit cost. Locate Footnote 1.
2017 Indigenous Expenditure Report
An estimated $33.4 billion of Australian, State and Territory government expenditure was spent on services provided to Aboriginal and Torres Strait Islander Australians in 2015-16, according to the 2017 Indigenous Expenditure Report.
Around 18 per cent of this expenditure was on targeted programs for Aboriginal and Torres Strait Islander Australians, and the remainder was through non-targeted, or mainstream, services. Since 2008-09 (and after adjusting for inflation), targeted expenditure has remained relatively constant at around $6.0 billion, while expenditure on mainstream services has increased by almost one-third (from $20.9 billion to $27.4 billion).
Per head of total population, expenditure (targeted and mainstream) equated to $44 886 per Aboriginal and Torres Strait Islander Australian, around twice the rate for non-Indigenous Australians ($22 356) and similar to ratios previously reported back to 2008-09. Around two-thirds of the higher per person expenditure for Aboriginal and Torres Strait Islander Australians is accounted for by greater intensity of service use (reflecting greater need and younger age profile), with the remaining one-third accounted for by the higher cost of providing services (such as in remote locations).
Peter Harris, Chairman of the Productivity Commission and Chair of the Steering Committee for the Review of Government Service Provision emphasised the importance of robust, public evaluations to understand the adequacy, effectiveness and efficiency of government spending, something which is outside the scope of this report. 'Understanding which policies and programs deliver outcomes effectively is vital for Aboriginal and Torres Strait Islander Australians, and all Australians. Without understanding what works and why, we cannot say if money is being well spent' he said.
The full suite of information on this report, including the report, data tables and a ‘how to’ video for accessing the 2017 report data can be found at: /ier2017
The report is produced by the Productivity Commission for the Steering Committee for the Review of Government Service Provision. It is the fourth in the series.
Read the report
Analyse the data
Video
Overview data
24 standard tables in Excel and PDF reporting on all major categories.
More detailed data
3 sets of customisable pivot tables containing all published data.
Advanced database
One unformatted file containing all published data for individuals using their own statistical software.
The caveats below relate to specific purpose categories of expenditure in the IER.
General — caveats relevant to all jurisdictions
Aboriginal and Torres Strait Islander share of mainstream expenditure — accuracy of these data may be affected by:
- where data on Aboriginal and Torres Strait Islander service use are available, under-identification of Aboriginal and Torres Strait Islander people in relevant administrative collections may result in a reduction in the share of expenditure being reported
- where data on Aboriginal and Torres Strait Islander service use are not available, estimates based on population share may not reflect service use share and the greater the difference the lower the accuracy of the estimates.
Indigenous specific expenditure — relies on accurate identification by Australian, State and Territory governments of Indigenous specific programs. Where a program is not correctly identified as such it will be allocated to mainstream expenditure and only a portion of the expenditure related to Aboriginal and Torres Strait Islander Australians:
Change over time — Caution should be exercised when interpreting changes in expenditure over time, particularly for more lower level GPC categories, as:
- changes in the nature of a program over time can result in a change to its allocation under the GPC
- changes in government policies over time can cause significant movements in expenditure. New programs may lead to additional expenditure with a different allocation. Further, the completion of an extensive project may lead to reduced expenditure on a category in later years, whilst not necessarily signifying a reduction in service provision
- changes in the machinery of government, information systems and accounting policies may result in different allocations of expenditure over time.
Jurisdiction-specific
Australia
GPC code 0621.3 — Australian Government expenditure for years prior to 2015-16 is overstated as it included child support payment transfers between parents. Data for 2015-16 should not be compared to previous years for this GPC code.
New South Wales
GPC 03 codes — reduction in Indigenous specific expenditure from 2012-13 to 2015-16 is due to a reduction in Indigenous specific programs.
GPC 12 codes — increase in expenditure for all Australians is due to an expansion of community and regional transport programs.
Victoria
GPC code 0320 — machinery of government changes between 2012-13 and 2015-16 included the Victorian courts and tribunals moving from the Department of Justice to a separate agency, Court Services Victoria. This resulted in the establishment of transfers between these agencies where previously there were none as they were within the one agency.
GPC code 0711.2 — inconsistencies in categorisation of expenditure prior to 2015-16 means that these data are not comparable with data for 2015-16.
GPC code 12 — inconsistencies in categorisations of expenditure at the sub-level (for GPC 121, 1231 and 1233) prior to 2015-16 means that these data are not comparable with data for 2015-16.
Queensland
Government services related to Aboriginal and Torres Strait Islander Queenslanders are provided through both targeted and mainstream services. Queensland government noted that providing quality, consistent expenditure data on this basis was again challenging, particularly at a disaggregated level. They added it has often not been possible to determine the precise cause for a shift in reported expenditure for many GPCs, between one or more of the following factors:
- increasing complexity of social service delivery and the associated challenges of attributing expenditure between discrete GPC categories;
- changes to machinery of government resulting in expenditure categorised to certain GPCs being the responsibility of different departments over time, with differences of interpretation and lack of historical exposure to the IER collection in some agencies causing changes in expenditure recorded against those GPCs; and/or
- different priorities of governments (that is, whether the changes in figures represent a discrete decision of the government of the day to increase or reduce expenditure on an area covered by a particular GPC).
GPC code 0390 — the creation of the Public Safety Business Agency in 2013 has resulted in a significant increase in expenditure for GPC 0390 and some reductions in expenditure across other GPC 03 codes.
GPC code 051 — Acute care services in Indigenous communities has been re-classified from Indigenous-specific to mainstream (in line with the definition provided for these services). This has resulted in a decrease in Indigenous-specific expenditure for GPC 051 in 2015-16 compared to 2012-13.
GPC code 06 — machinery of government and policy changes have resulted in changes in expenditure allocations between sub-level codes between 2012-13 and 2015-16 (in particular, GPC 0610, 0629 and 0690.
GPC codes 1331 and 0422 — machinery of government changes in the vocational education and training sector have resulted in a shift of expenditure between 2012-13 and 2015-16 from GPC 0422 to GPC 1331.
Western Australia
GPC code 03 — a new cost allocation system was introduced by WA Police in 2013-14 which has resulted in a change in the Aboriginal and Torres Strait Islander share of mainstream expenditure in GPC 03 and sub-level codes.
GPC code 0623 — the first expenditure relating to NDIS payments has resulted in an increase in GPC 0623 in 2015-16 compared to 2012-13.
South Australia
Nil caveats.
Tasmania
Nil caveats.
Australian Capital Territory
Nil caveats.
Northern Territory
GPC codes 0449 and 054 — reassessment of expenditure allocations has resulted in redistribution amongst sub-level codes for 2015-16 data.
Glossary
The glossary of terms used in the Indigenous Expenditure Report 2017.
| Term | Definition |
|---|---|
| Aboriginal and Torres Strait Islander Australians | People in Australia who identify as being of Aboriginal and/or Torres Strait Islander origin. Data sources for Indigenous specific programs may have different criteria and this should be considered when using these data from this report (for example, eligibility for ABSTUDY includes being accepted as Aboriginal or Torres Strait Islander origin by the community in which the person lived or has lived). |
| ABS Government Purpose Classification (GPC) | A method of allocating expenditure by purpose. The GPC structure classifies expenditure in a cascading level of detail. The broadest is the 2 digit ‘major group’ (for example, social security and welfare, GPC 06 – referred to as tier 1), followed by the 3 digit ‘group’ (for example, welfare services, GPC 062 – referred to as tier 2). The most detailed category in the GPC is the 4 digit ‘subgroup’ (for example, welfare services for the aged, GPC 0622 – referred to as tier 3). |
| Building blocks | The six building blocks include the following expenditure categories:
|
| Complementary program | Indigenous specific programs, services and payments that are provided to Aboriginal and Torres Strait Islander Australians in addition to mainstream programs, services and payments. |
| Cost differential | The extent to which the cost of providing services to Aboriginal and Torres Strait Islander and non-Indigenous Australians varies. The cost difference component is used in the Report to estimate the Aboriginal and Torres Strait Islander share of mainstream expenditure. |
| Cost difference component | The component of mainstream expenditure resulting from the additional cost of providing mainstream services to Aboriginal and Torres Strait Islander Australians. |
| Cost of service provision | The cost of providing a service, which may differ between Aboriginal and Torres Strait Islander Australians and non-Indigenous Australians. |
| Direct expenditure | Government expenditure on services and payments provided directly to individuals, non-government service providers, or local governments. Estimates are available for:
|
| Expenditure | All expense transactions undertaken by the general government sector of the Australian, State and Territory governments, following the ABS Government Finance Statistics framework. It excludes capital expenditure but includes expenses related to ‘depreciation’ and maintenance of assets, and ‘capital grants’ made outside the general government sector, and indirect expenditure to other governments. The estimates in this report are reconcilable to expenditure reported under the Uniform Presentation Framework in jurisdictions’ annual financial reports. |
| Expenditure per person | Expenditure per person in the population. This is estimated as expenditure divided by the Aboriginal and Torres Strait Islander Australians, non-Indigenous or total population. It is not a measure of unit cost (expenditure per user), which is estimated as expenditure divided by the total number of service users, and should not be interpreted as a unit cost. |
| General government sector | All government units of the Australian Government, each State and Territory government, and each local government authority, as well as all resident non-market non-profit institutions that are controlled and mainly financed by those governments. The direct expenditure of public corporations is not within the scope of general government expenditure. The scope of the 2017 Indigenous Expenditure Report is the Australian Government and each State and Territory government's general government sector. The direct expenditure of ‘multi-jurisdictional’ and ‘local government’ units is excluded. |
| Indigenous | A person in Australia who identifies as Aboriginal and/or Torres Strait Islander. |
| Indigenous expenditure | Estimated government expenditure on services, programs and payments for Aboriginal and Torres Strait Islander Australians. |
| Indigenous specific expenditure | Expenditure on programs, services and payments that are explicitly targeted to Aboriginal and Torres Strait Islander Australians. Total expenditure on Indigenous specific services includes substitute Indigenous specific services (those provided as an alternative to or instead of mainstream services) and complementary Indigenous specific services (provided in addition to mainstream services). |
| Indigenous under-identification | The degree to which service users do not identify as Aboriginal and Torres Strait Islander. For example, a person’s Aboriginal and Torres Strait Islander status might not always be asked as part of the service delivery process. Alternatively, there might be a disincentive for service users to identify their Aboriginal and Torres Strait Islander status. |
| Indirect expenditure | Expenditure ‘to’ and ‘through’ other Governments. Most indirect expenditure is Australian Government expenditure 'to' and 'through' State and Territory Governments, including Specific Purpose Payments and Goods and Services Tax payments. For example, indirect expenditure by the Australian Government becomes direct expenditure when expended by a state government on goods or services. |
| Intensity of use | The estimated propensity of Aboriginal and Torres Strait Islander Australians and non-Indigenous Australians to use particular services. |
| Mainstream expenditure | Expenditure on programs, services and payments that are available to both Aboriginal and Torres Strait Islander and non Indigenous Australians on either a targeted or universal basis. See the Service Use Measure Definitions Manual for further information. |
| Nominal expenditure | Expenditure data that are not adjusted for inflation. |
| Non-Indigenous Australians | A person in Australia who does not identify as Aboriginal and/or Torres Strait Islander. |
| Non-Indigenous expenditure | Estimated government expenditure on services for non-Indigenous Australians. |
| Place of expenditure | The State or Territory where the expenditure occurred (that is, where the money was spent). In addition to State and Territory Government expenditure in each State and Territory, estimates are provided for Australian Government expenditure in each State and Territory. |
| Real expenditure | Nominal expenditure data are adjusted using the ABS General Government Final Consumption Expenditure (GGFCE) deflator so that comparisons over time adjust for inflation. The GGFCE deflates nominal expenditure data values to constant (real) dollar values. Real expenditure estimates in the Report are expressed in terms of 2015-16 dollars. |
| Service use component | The component of mainstream expenditure driven by Aboriginal and Torres Strait Islander Australians’ use of services. The Indigenous share of expenditure on mainstream services is estimated using the number of Aboriginal and Torres Strait Islander service users as a proportion of total service users. |
| Service use measures | Measures of service use provide a proxy for the distribution of mainstream expenditure (not benefits) among service users. Service use measures are used in the Report to estimate the Aboriginal and Torres Strait Islander share of mainstream expenditure. |
| Substitute Indigenous specific services | Services that are provided to Aboriginal and Torres Strait Islander Australians as an alternative to mainstream services, programs and payments. |
| Total expenditure | Direct plus indirect expenditure. Estimates are available for the Australian Government and each State and Territory government. Australian Government total expenditure estimates are also available by the State or Territory that expenditure is directed to. Total expenditure estimates for one government should not be added to total expenditure estimates for another government to create a national total as total expenditure estimates include both direct expenditure and transfers to other governments (indirect expenditure). A national total derived in this way would double count indirect expenditure (by counting both the transfer from the originating government and the subsequent expenditure by the recipient government using the transferred funds). The correct national total is total national direct expenditure (i.e. indirect expenditure netted out). |
| Transfers | see indirect expenditure |
| $/’000 | Expenditure estimates in thousands of dollars. |
| Unknown (Indigenous status) | In this Report, service users whose Indigenous status is unknown are apportioned between Aboriginal and Torres Strait Islander Australians and non-Indigenous Australian using methods set out in the IER Service Use Measure Definitions Manual, and used in estimating the Indigenous and non-Indigenous share of total expenditure. |
Acronyms and abbreviations
The acronyms and abbreviations used in the Indigenous Expenditure Report 2017.
| Acronym | Spelt out |
|---|---|
| ABS | Australian Bureau of Statistics |
| ACT | Australian Capital Territory |
| COAG | Council of Australian Governments |
| CSV | comma separated values |
| GGFCE | General Government Final Consumption Expenditure |
| GPC | Government Purpose Classification |
| IER | Indigenous Expenditure Report |
| LDM | Local Decision Making |
| NIRA | National Indigenous Reform Agreement |
| NSW | New South Wales |
| NT | Northern Territory |
| Qld | Queensland |
| SA | South Australia |
| Tas | Tasmania |
| Vic | Victoria |
| WA | Western Australia |
Technical manuals
Two manuals related to the 2017 Indigenous Expenditure Report.
Expenditure Data Manual
Definitions and guidelines for the collection of data used to estimate expenditure on services for Aboriginal and Torres Strait Islander and non-Indigenous Australians.
Service Use Measure Definitions Manual
Definitions, concepts and methods used to prorate mainstream expenditure between Aboriginal and Torres Strait Islander and non-Indigenous Australians.
- 2017 IER Service Use Measure Definitions Manual (PDF - 1355 Kb)
- 2017 IER Service Use Measure Definitions Manual (Word - 696 Kb)
Analyse the data
Data are presented as a set of 24 standard tables (in Excel and in PDF) and six Excel workbooks with more detailed level data.
Overview data
Direct expenditure estimates in a spreadsheet format, for use in general analysis of the IER dataset
More detailed pivot tables
Excel workbooks with pivot interface, for customisation in excel of detailed estimates from the IER dataset
All governments direct expenditure
Australian Government direct, indirect and total expenditure
State and Territory Governments direct, indirect and total expenditure
Printed copies
This publication is only available online.
Publications feedback
We value your comments about this publication and encourage you to provide feedback.
Review of the Indigenous Expenditure Report
Please provide feedback on ways to further enhance the policy relevance of this report.
