
Productivity update – September 2026

3 September 2026 | Alex Robson | Deputy Chair
Australia’s productivity growth remained stagnant in the June 2026 quarter, following a 0.6% decline in the March quarter. Output and hours worked both increased by 0.4% in the quarter, leaving labour productivity flat. Over the year to June, output rose 2.1%, while hours worked increased 2.3%, resulting in a 0.2% decline in labour productivity.
Market-sector labour productivity rebounded modestly, increasing by 0.2% in the June quarter after falling 0.7% in March, but is still 0.1% lower than this time last year.
Non market-sector productivity declined by 0.1%, following a 0.3% fall in the previous quarter, to be 0.3% lower than this time last year. Non-market sector productivity is now below the level it was in March 2007.
Overall, we are barely 1% above our 2015–19 average level of productivity. While this quarter’s flat overall result is an improvement on the decline in the March quarter, the stagnant pattern across the economy remains a cause for concern.
Productivity is the main driver of our long-term prosperity. It is the clearest path to sustainably improving Australians’ real wages and broader living standards.
These results underscore the importance of ongoing reform. No single policy can bring productivity growth to its long-term average – governments will have to make a lot of pro-productivity decisions.
In the May Budget, the government announced that it was progressing 13 of the 17 reform areas we highlighted in our five pillars of productivity inquiries. An important priority we highlighted in those inquiries was a need to reduce the cost of regulation. The PC is currently progressing inquiries into housing supply, business dynamism and reporting requirements that will identify further areas where government can streamline and improve regulation and regulatory processes to boost productivity.
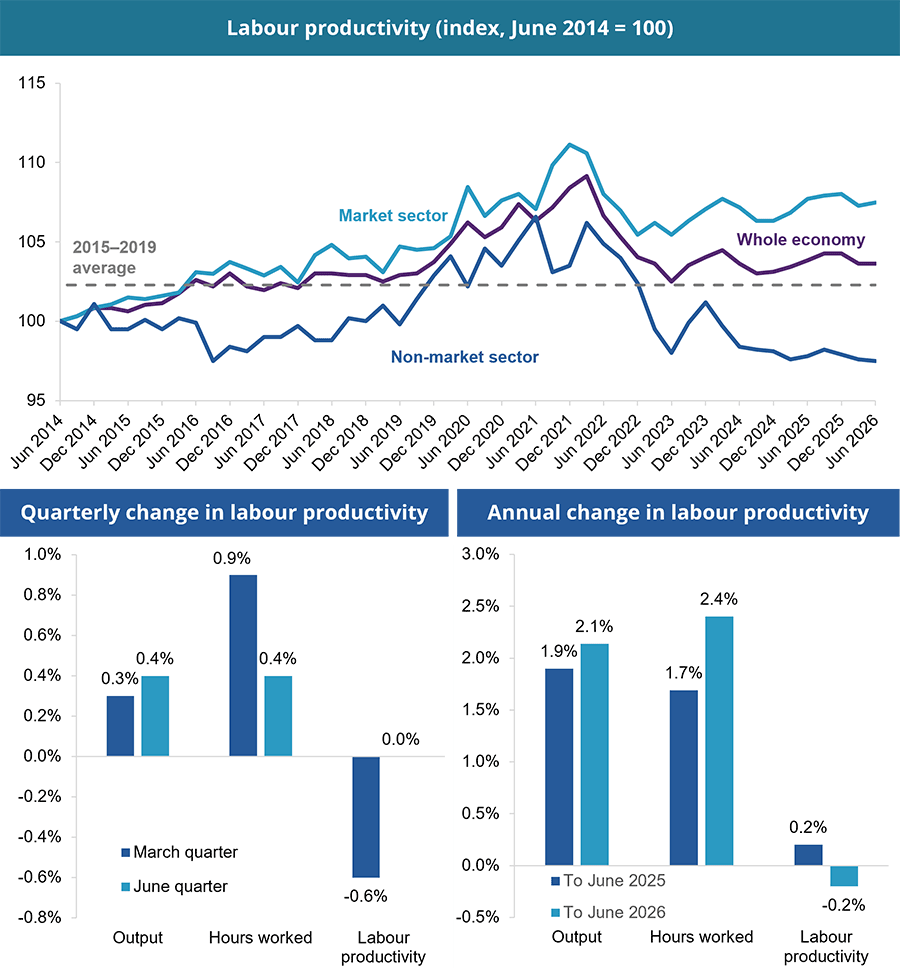
The 2015–2019 average is the productivity growth prior to the COVID-19 pandemic. It shows us our productivity jumped around during the pandemic but ultimately landed at this level in June 2023.
Source: ABS (2026) Australian National Accounts: National Income, Expenditure and Product, June 2026.
Panel A is a line chart that shows quarterly labour productivity indexes for the market sector, non-market sector and whole economy between June 2014 and June 2026. The figure also shows the 2015-2019 average level of productivity for the whole economy.
It shows market sector labour productivity has grown by 7.5% since June 2014, non-market sector labour productivity has decreased by 2.5% and overall labour productivity has grown by 3.6% since June 2014.
Panel B is a column chart that shows the quarterly change in output, hours worked and labour productivity for the March 2026 and June 2026 quarters.
It shows that in the June quarter, output increased by 0.4%, hours worked by 0.4% and labour productivity growth was unchanged.
It also shows that in the March quarter, output increased by 0.3%, hours worked by 0.9% and labour productivity decreased by 0.6%
Panel C is a column chart that shows the annual change in output, hours worked and labour productivity for the year to June 2025 and the year to June 2026.
It shows that in the year to June 2026, output increased by 2.1%, hours worked by 2.4% and labour productivity declined by 0.2%.
It also shows that in the year to March 2025, output increased by 1.9%, hours worked by 1.7% and labour productivity increased by 0.2%.
 Productivity update - September 2026 chart data (XLSX 42.3 KB)