Report on Government Services 2016
Chapter 14, Volume F
Services for people with disability
The Services for people with disability chapter (chapter 14) reports on the assistance funded by governments to people with disability and their carers, focusing on specialist disability services.
The National Disability Agreement (NDA), effective from 1 January 2009, provides the national framework and key areas of reform for the provision of government support and services for people with disability and their carers. The focus of this chapter is on the services and supports provided under this agreement.
Download the chapter
- Chapter 14 Services for people with disability, attachment tables, and data quality information (PDF - 6644 Kb)
- Chapter 14 Attachment tables (XLSX - 2674 Kb)
- Key Facts
- Indicator Framework
- Indicator Results
- Indigenous Data
In 2014-15, total government expenditure on specialist disability services was $8.0 billion — a real increase of 5.1 per cent from 2013-14. Of all specialist disability funding in 2014-15, 70.3 per cent came from State and Territory governments and 29.7 per cent came from the Australian Government.
Assistance is provided by governments to people with disability and their carers, through specialist disability services provided under the National Disability Agreement (NDA) and National Disability Insurance Scheme (NDIS).
Nationally in 2013-14 (2014-15 data were not available for this Report), the number of people with disability using NDA specialist disability services as a proportion of the estimated potential population was:
- Accommodation support, 5.8 per cent
- Community support, 23.2 per cent
- Community access, 7.7 per cent
- Respite, 16.4 per cent
- Supported employment, 6.9 per cent
- Open employment, 7.5 per cent of people who had an employment restriction.
In 2013-14, 4051 people who used disability support services under the NDA transitioned to the NDIS. As at 30 June 2014, there were 4883 NDIS participants who were existing State/Territory service users (that is, had transferred at some time from NDA services).
The Australian, State and Territory governments aim to ensure that people with disability and their carers have an enhanced quality of life and participate as valued members of the community.
The performance indicator framework provides information on equity, efficiency and effectiveness, and distinguishes the outputs and outcomes of government funded services for people with disability. The performance indicator framework shows which data are complete and comparable in the 2016 Report.
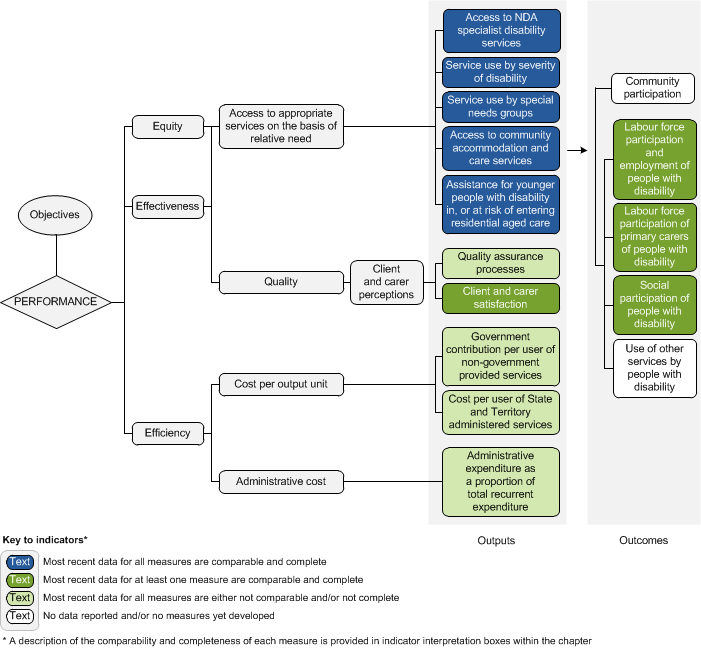
An overview of the Services for people with disability performance indicator results are presented. Information to assist the interpretation of these data can be found in the indicator interpretation boxes in the Services for people with disability chapter and attachment tables.
Equity — Access to appropriate services on the basis of relative need indicators
Access to National Disability Agreement (NDA) accommodation support services
Proportion of potential population who used accommodation support services, 2013-14.
| NSW | Vic | Qld | WA | SA | Tas | ACT | NT | Aust | |
|---|---|---|---|---|---|---|---|---|---|
| rate | 5.6 | 4.7 | 5.4 | 6.1 | 11.1 | 9.5 | 5.7 | 5.6 | 5.8 |
Service use by severity of disability
Proportion of people using accommodation support services who need help with Activities of Daily Living, 2013-14
| NSW | Vic | Qld | WA | SA | Tas | ACT | NT | Aust | |
|---|---|---|---|---|---|---|---|---|---|
| % | 83.5 | 77.4 | 84.8 | 93.5 | 87.3 | 88.7 | 82.4 | 79.2 | 84.3 |
Service use by special needs groups
Proportion of Aboriginal and Torres Strait Islander Australians using accommodation support services per 1000 Aboriginal and Torres Strait Islander potential population, 2013-14
| NSW | Vic | Qld | WA | SA | Tas | ACT | NT | Aust | |
|---|---|---|---|---|---|---|---|---|---|
| rate | 40.7 | 24.5 | 42.8 | 67.7 | 117.4 | 31.7 | 43.2 | 100.1 | 51.5 |
Access to community accommodation and care services
Users of NDA community accommodation and care services as a proportion of all accommodation support service users , 2013-14
| NSW | Vic | Qld | WA | SA | Tas | ACT | NT | Aust | |
|---|---|---|---|---|---|---|---|---|---|
| % | 90.5 | 95.5 | 90.1 | 95.9 | 92.0 | 87.2 | 100.0 | 100.0 | 92.3 |
Assistance for younger people with disability in residential aged care
Rate of younger people admitted to permanent residential aged care per 10 000 potential population, 2014-15
| NSW | Vic | Qld | WA | SA | Tas | ACT | NT | Aust | |
|---|---|---|---|---|---|---|---|---|---|
| rate | 35.7 | 35.2 | 26.5 | 24.0 | 31.9 | 49.0 | 15.1 | 5.7 | 31.6 |
Effectiveness — Quality — Client and carer perception indicators
Client and Carer Satisfaction
Proportion of people with disability who are satisfied with the quality of assistance received, 2012
| NSW | Vic | Qld | WA | SA | Tas | ACT | NT | Aust | |
|---|---|---|---|---|---|---|---|---|---|
| % | 81.3±3.3 | 77.6±3.7 | 79.6±5.3 | 83.0±8.5 | 85.3±5.8 | 92.1±6.9 | 77.5±11.9 | 87.5±16.2 | 79.5±2.4 |
Proportion of primary carers who are satisfied with the quality of assistance received, 2012
| NSW | Vic | Qld | WA | SA | Tas | ACT | NT | Aust | |
|---|---|---|---|---|---|---|---|---|---|
| % | 65.0±8.1 | 68.4±12.8 | 74.9±14.0 | 61.4±19.9 | 67.3±14.6 | 82.5±22.1 | 60.2±18.2 | 100.0±– | 69.0±5.0 |
Efficiency indicators — Cost per output unit
Government contribution per user of non-government provided services
Government funding per user of non-government provided accommodation support services in institutional/residential setting, 2013-14
| NSW | Vic | Qld | WA | SA | Tas | ACT | NT | Aust | |
|---|---|---|---|---|---|---|---|---|---|
| $ | 61 566 | 30 345 | 66 212 | 117 540 | 64 385 | 52 521 | .. | .. | 63 479 |
Cost per user of State and territory administered services
Total estimated expenditure per service user, State and Territory government administered programs, 2013-14
| NSW | Vic | Qld | WA | SA | Tas | ACT | NT | Aust | |
|---|---|---|---|---|---|---|---|---|---|
| $ | 40 407 | 26 851 | 42 394 | 43 761 | 27 721 | 26 585 | 18 061 | 31 675 | 39 072 |
Administrative expenditure as a proportion of total recurrent expenditure
Administration expenditure as a proportion of total expenditure (including actual and imputed payroll tax), 2014-15
| NSW | Vic | Qld | WA | SA | Tas | ACT | NT | Aust Gov | Aust | |
|---|---|---|---|---|---|---|---|---|---|---|
| % | 6.5 | 8.4 | 5.2 | 3.3 | 3.7 | 6.2 | 8.7 | 4.7 | 7.0 | 6.2 |
Outcome indicators
Labour force participation and employment of people with disability
Labour force participation rate for people with disability aged 15-64 years, 2012
| NSW | Vic | Qld | WA | SA | Tas | ACT | NT | Aust | |
|---|---|---|---|---|---|---|---|---|---|
| % | 50.6±1.7 | 53.4±2.7 | 54.0±2.8 | 56.5±5.1 | 52.6±1.9 | 45.8±3.1 | 63.0±5.3 | 58.6±7.0 | 52.8±1.3 |
Labour force participation of primary carers of people with disability
Labour force participation rate for primary carers aged 15-64 years, 2012
| NSW | Vic | Qld | WA | SA | Tas | ACT | NT | Aust | |
|---|---|---|---|---|---|---|---|---|---|
| % | 47.5±7.3 | 53.4±4.4 | 55.6±6.6 | 59.4±8.6 | 52.7±9.6 | 58.2±12.7 | 67.8±14.7 | 91.2±21.1 | 52.8±3.2 |
Social participation of people with disability
People with disability aged 15-64 years who have had face-to-face contact with ex-household family or friends in the previous week, 2012
| NSW | Vic | Qld | WA | SA | Tas | ACT | NT | Aust | |
|---|---|---|---|---|---|---|---|---|---|
| % | 72.8±2.9 | 76.3±3.2 | 69.7±1.6 | 77.6±3.0 | 77.5±2.6 | 78.1±5.9 | 73.8±6.7 | 72.7±5.3 | 74.2±1.2 |
Legend
.. Not applicable.
Some results reported here include 95 per cent confidence intervals (for example, 80 per cent ± 2.7 per cent).
Performance indicator data for Aboriginal and Torres Strait Islander people in this chapter are available in the attachment tables listed below. Contextual data and further supporting information can be found in the chapter.
| Table number | Table title |
|---|---|
| Table 14A.39 | Indigenous users of State/Territory delivered NDA services aged 0-64 years |
| Table 14A.40 | Users of NDA accommodation support services, by Indigenous status |
| Table 14A.41 | Users of NDA community support services, by Indigenous status |
| Table 14A.42 | Users of NDA community access services, by Indigenous status |
| Table 14A.43 | Users of NDA respite services, by Indigenous status |
| Table 14A.44 | Users of NDA employment services (aged 15-64 years), by Indigenous status |
| Table 14A.45 | Indigenous users of NDA open employment services/Employment Support Services aged 15-64 years, by age |
| Table 14A.46 | Indigenous users of NDA Disability Management Services aged 15-64 years, by age |
| Table 14A.47 | Indigenous users of NDA supported employment services/ Australian Disability Enterprises aged 15-64 years, by age |
| Table 14A.63 | Rate of younger people admitted to permanent residential aged care per 10 000 potential population |
| Table 14A.64 | Younger people who separated from permanent residential aged care to return to home/family |
| Table 14A.65 | Younger people receiving permanent residential aged care |
| Table 14A.149 | Indigenous users of basic community care services under 50 years, users born in non-English speaking countries under 65 years and all users aged under 65 years and Indigenous users aged under 50 years |