Report on Government Services 2016
Chapter 17, Volume G
Housing
The Housing chapter (chapter 17) focuses on the performance of governments in providing social housing, including public housing, State owned and managed Indigenous housing (SOMIH), community housing and Indigenous community housing.
The National Affordable Housing Agreement (NAHA) is the overarching agreement between Australian, State and Territory governments for providing assistance to improve housing outcomes for Australian people.
Please note: An errata was released with this chapter. The files below have been updated to reflect the changes.
Download the chapter
- Chapter 17 Housing, attachment tables, and data quality information (PDF - 2769 Kb)
- Chapter 17 Attachment tables (XLSX - 7476 Kb)
- Key Facts
- Indicator Framework
- Indicator Results
- Indigenous Data
Nationally at 30 June 2015:
- Public housing — there were 314 963 households and 321 627 dwellings (with another 5025 remote dwellings located in the NT)
- SOMIH — there were 9732 households and 10 035 dwellings
- Community housing — there were 69 171 households and 72 105 community housing tenancy rental units.
There were 12 775 households and 17 529 permanent dwellings managed by Indigenous community housing organisations at 30 June 2014.
Social housing aims to assist people unable to access alternative suitable housing options through the delivery of affordable, appropriate, flexible and diverse social housing.
Some forms of social housing aim specifically to contribute to Aboriginal and Torres Strait Islander community wellbeing by improving housing outcomes, especially for people living in remote communities.
The performance indicator framework provides information on equity, efficiency and effectiveness, and distinguishes the outputs and outcomes of social housing. The performance indicator framework shows which data are complete and comparable in the 2016 Report.
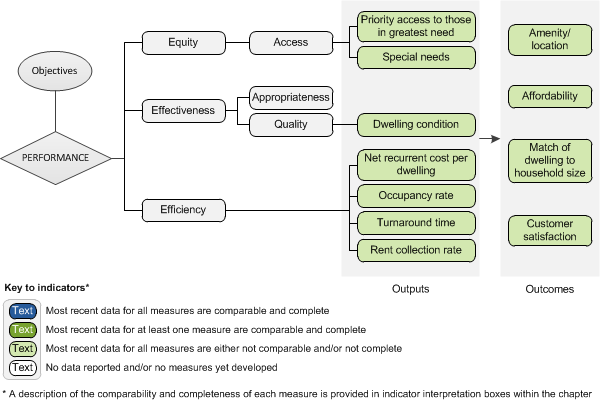
An overview of the Social housing performance indicator results are presented. Information to assist the interpretation of these data can be found in the indicator interpretation boxes in the Housing chapter and attachment tables.
Equity — Access indicators
Priority access to those in greatest need
Proportion of new allocations of housing to those in greatest need, 2014-15 (%)
Public housing
| NSW | Vic | Qld | WA | SA | Tas | ACT | NT | Aust | |
|---|---|---|---|---|---|---|---|---|---|
| % | 48.0 | 82.1 | 95.9 | 74.9 | 82.4 | 80.5 | 96.7 | 61.6 | 73.7 |
State owned and managed Indigenous housing
| NSW | Vic | Qld | WA | SA | Tas | ACT | NT | Aust | |
|---|---|---|---|---|---|---|---|---|---|
| % | 12.9 | .. | 96.5 | .. | 91.1 | na | .. | .. | 51.8 |
Community housing
| NSW | Vic | Qld | WA | SA | Tas | ACT | NT | Aust | |
|---|---|---|---|---|---|---|---|---|---|
| % | 72.5 | 84.9 | 85.9 | 79.4 | 83.1 | 51.7 | 97.9 | na | 73.4 |
Special needs
Proportion of allocations of housing to those with special needs, 2014-15 (%).
Public housing
| NSW | Vic | Qld | WA | SA | Tas | ACT | NT | Aust | |
|---|---|---|---|---|---|---|---|---|---|
| % | 68.0 | 57.7 | 67.2 | 54.1 | 67.2 | 60.6 | 66.5 | 69.8 | 63.7 |
State owned and managed Indigenous housing
| NSW | Vic | Qld | WA | SA | Tas | ACT | NT | Aust | |
|---|---|---|---|---|---|---|---|---|---|
| % | 55.6 | .. | 51.9 | .. | 5.0 | 63.0 | .. | .. | 53.8 |
Community housing
| NSW | Vic | Qld | WA | SA | Tas | ACT | NT | Aust | |
|---|---|---|---|---|---|---|---|---|---|
| % | 57.7 | 46.7 | 62.6 | 49.4 | 60.5 | 67.5 | 61.5 | na | 55.5 |
Equity — Effectiveness indicators
Dwelling condition
Proportion of households with at least four working facilities and not more than two major structural problems, 2014 (%)
Public housing
| NSW | Vic | Qld | WA | SA | Tas | ACT | NT | Aust | |
|---|---|---|---|---|---|---|---|---|---|
| % | 75.9±1.3 | 83.1±3.2 | 88.3±2.8 | 81.9±2.9 | 84.0±3.0 | 80.6±3.6 | 75.7±3.8 | 81.7±3.6 | 81.0±1.0 |
State owned and managed Indigenous housing
| NSW | Vic | Qld | WA | SA | Tas | ACT | NT | Aust | |
|---|---|---|---|---|---|---|---|---|---|
| % | 65.5±4.2 | .. | 80.3±3.5 | .. | 61.4±5.7 | 75.6±9.1 | .. | .. | 70.1±2.5 |
Community housing
| NSW | Vic | Qld | WA | SA | Tas | ACT | NT | Aust | |
|---|---|---|---|---|---|---|---|---|---|
| % | 87.9 ±2.1 | 87.7 ±3.5 | 93.8 ±2.5 | 94.4 ±2.5 | 86.4 ±3.7 | 80.5 ±4.7 | 87.6 ±5.9 | na | 89.3 ±1.2 |
Efficiency indicators
Net recurrent cost per dwelling
Net recurrent cost per dwelling, 2014-15 (CH and ICH = 2013-14) ($)
Public housing
| NSW | Vic | Qld | WA | SA | Tas | ACT | NT | Aust | |
|---|---|---|---|---|---|---|---|---|---|
| $ | 8133 | 7055 | 7880 | 11 061 | 9284 | 8379 | 9630 | 14 741 | 8486 |
State owned and managed Indigenous housing
| NSW | Vic | Qld | WA | SA | Tas | ACT | NT | Aust | |
|---|---|---|---|---|---|---|---|---|---|
| $ | 9186 | .. | 13 102 | .. | 12 288 | 7766 | .. | .. | 10 999 |
Community housing
| NSW | Vic | Qld | WA | SA | Tas | ACT | NT | Aust | |
|---|---|---|---|---|---|---|---|---|---|
| $ | 10 380 | 8788 | 7261 | 10 046 | 9600 | na | 6638 | na | 9264 |
Indigenous community housing
| NSW | Vic | Qld | WA | SA | Tas | ACT | NT | Aust | |
|---|---|---|---|---|---|---|---|---|---|
| $ | 4052 | 7792 | 9544 | 10 353 | na | 3792 | .. | na | 8615 |
Occupancy rates
Occupancy rates, 2015 (ICH = 2014) (%).
Public housing
| NSW | Vic | Qld | WA | SA | Tas | ACT | NT | Aust | |
|---|---|---|---|---|---|---|---|---|---|
| % | 98.7 | 98.0 | 98.3 | 97.7 | 95.8 | 98.3 | 98.0 | 94.7 | 97.9 |
State owned and managed Indigenous housing
| NSW | Vic | Qld | WA | SA | Tas | ACT | NT | Aust | |
|---|---|---|---|---|---|---|---|---|---|
| % | 97.6 | .. | 96.6 | .. | 95.8 | 98.6 | .. | .. | 97.0 |
Community housing
| NSW | Vic | Qld | WA | SA | Tas | ACT | NT | Aust | |
|---|---|---|---|---|---|---|---|---|---|
| % | 93.0 | 94.0 | 97.0 | 95.0 | 96.0 | 96.0 | 87.0 | 100.0 | 94.4 |
Indigenous community housing
| NSW | Vic | Qld | WA | SA | Tas | ACT | NT | Aust | |
|---|---|---|---|---|---|---|---|---|---|
| % | 96.7 | 98.5 | 94.1 | 91.3 | 88.7 | 100.0 | .. | na | 94.6 |
Turnaround time
Average turnaround times for vacant stock, 2014-15 (days)
Public housing
| NSW | Vic | Qld | WA | SA | Tas | ACT | NT | Aust | |
|---|---|---|---|---|---|---|---|---|---|
| Days | 29.9 | 29.1 | 24.3 | 21.5 | na | 26.9 | 34.1 | 93.1 | na |
State owned and managed Indigenous housing
| NSW | Vic | Qld | WA | SA | Tas | ACT | NT | Aust | |
|---|---|---|---|---|---|---|---|---|---|
| Days | 28.0 | .. | 38.5 | .. | na | 27.2 | .. | .. | na |
Rent collection rate
Rent collection rate, 2014-15 (CH and ICH = 2013-14) (%)
Public housing
| NSW | Vic | Qld | WA | SA | Tas | ACT | NT | Aust | |
|---|---|---|---|---|---|---|---|---|---|
| % | 99.5 | 98.8 | 100.2 | 100.0 | 99.8 | 98.5 | 99.3 | 98.5 | 99.5 |
State owned and managed Indigenous housing
| NSW | Vic | Qld | WA | SA | Tas | ACT | NT | Aust | |
|---|---|---|---|---|---|---|---|---|---|
| % | 94.0 | .. | 100.3 | .. | 97.4 | 98.4 | .. | .. | 96.3 |
Community housing
| NSW | Vic | Qld | WA | SA | Tas | ACT | NT | Aust | |
|---|---|---|---|---|---|---|---|---|---|
| % | 97.7 | 100.4 | 99.9 | 99.9 | 99.6 | 109.0 | 98.7 | na | 99.2 |
Indigenous community housing
| NSW | Vic | Qld | WA | SA | Tas | ACT | NT | Aust | |
|---|---|---|---|---|---|---|---|---|---|
| % | 92.5 | 100.1 | 82.1 | 89.7 | na | 99.5 | .. | na | 89.9 |
Outcome indicators
Amenity/location
Amenity important and meeting needs, 2014 (%)
Public housing
| NSW | Vic | Qld | WA | SA | Tas | ACT | NT | Aust | |
|---|---|---|---|---|---|---|---|---|---|
| % | 80.8 | 81.8 | 87.1 | 85.7 | 86.7 | 85.2 | 80.5 | 82.2 | 83.4 |
State owned and managed Indigenous housing
| NSW | Vic | Qld | WA | SA | Tas | ACT | NT | Aust | |
|---|---|---|---|---|---|---|---|---|---|
| % | 75.9 | .. | 82.9 | .. | 79.8 | 82.0 | .. | .. | 79.0 |
Community housing
| NSW | Vic | Qld | WA | SA | Tas | ACT | NT | Aust | |
|---|---|---|---|---|---|---|---|---|---|
| % | 84.2 | 86.0 | 86.1 | 88.4 | 88.2 | 82.5 | 81.1 | na | 85.5 |
Location important and meeting needs, 2014 (%)
Public housing
| NSW | Vic | Qld | WA | SA | Tas | ACT | NT | Aust | |
|---|---|---|---|---|---|---|---|---|---|
| % | 88.9 | 87.3 | 90.1 | 89.7 | 89.2 | 88.8 | 90.0 | 87.9 | 88.9 |
State owned and managed Indigenous housing
| NSW | Vic | Qld | WA | SA | Tas | ACT | NT | Aust | |
|---|---|---|---|---|---|---|---|---|---|
| % | 89.4 | .. | 89.3 | .. | 89.4 | 93.8 | .. | .. | 89.5 |
Community housing
| NSW | Vic | Qld | WA | SA | Tas | ACT | NT | Aust | |
|---|---|---|---|---|---|---|---|---|---|
| % | 86.0 | 89.1 | 85.4 | 88.8 | 91.0 | 88.3 | 83.8 | na | 87.1 |
Affordability
Proportion of low income households spending more than 30 per cent of their gross income on rent, 2014-15 (%)
Public housing
| NSW | Vic | Qld | WA | SA | Tas | ACT | NT | Aust | |
|---|---|---|---|---|---|---|---|---|---|
| % | 1.5 | 0.4 | – | 1.5 | – | 0.1 | 0.1 | 7.7 | 0.9 |
State owned and managed Indigenous housing
| NSW | Vic | Qld | WA | SA | Tas | ACT | NT | Aust | |
|---|---|---|---|---|---|---|---|---|---|
| % | 0.8 | .. | – | .. | – | – | .. | .. | 0.3 |
Community housing
| NSW | Vic | Qld | WA | SA | Tas | ACT | NT | Aust | |
|---|---|---|---|---|---|---|---|---|---|
| % | 7.6 | 0.1 | na | 17.7 | 9.0 | 27.8 | 0.4 | na | 8.7 |
Match of dwelling to household size
Proportion of overcrowded households, 2014-15 (%) (ICH = 2013-14)
Public housing
| NSW | Vic | Qld | WA | SA | Tas | ACT | NT | Aust | |
|---|---|---|---|---|---|---|---|---|---|
| % | 4.6 | 4.5 | 4.5 | 6.3 | 1.9 | 3.7 | 5.0 | 7.3 | 4.4 |
State owned and managed Indigenous housing
| NSW | Vic | Qld | WA | SA | Tas | ACT | NT | Aust | |
|---|---|---|---|---|---|---|---|---|---|
| % | 8.4 | .. | 12.6 | .. | 7.7 | 4.8 | .. | .. | 9.7 |
Community housing
| NSW | Vic | Qld | WA | SA | Tas | ACT | NT | Aust | |
|---|---|---|---|---|---|---|---|---|---|
| % | 4.8 | 5.1 | na | 1.8 | 2.1 | 1.8 | 0.3 | na | 3.9 |
Indigenous community housing
| NSW | Vic | Qld | WA | SA | Tas | ACT | NT | Aust | |
|---|---|---|---|---|---|---|---|---|---|
| % | na | 6.1 | 28.0 | 20.1 | na | na | .. | na | na |
Customer satisfaction
Proportion of tenants who were satisfied or very satisfied with the services provided by their State or Territory housing authority or community housing organisation, 2014 (%)
Public housing
| NSW | Vic | Qld | WA | SA | Tas | ACT | NT | Aust | |
|---|---|---|---|---|---|---|---|---|---|
| % | 64.8 ±1.5 | 75.5 ±3.6 | 83.8 ±3.2 | 73.0 ±3.4 | 75.7 ±3.4 | 73.2 ±3.9 | 75.7 ±3.8 | 71.6 ±4.0 | 72.7 ±1.2 |
State owned and managed Indigenous housing
| NSW | Vic | Qld | WA | SA | Tas | ACT | NT | Aust | |
|---|---|---|---|---|---|---|---|---|---|
| % | 49.1 ±4.4 | .. | 66.8 ±4.1 | .. | 66.2 ±5.5 | 62.2 ±10.5 | .. | .. | 58.3 ±2.7 |
Community housing
| NSW | Vic | Qld | WA | SA | Tas | ACT | NT | Aust | |
|---|---|---|---|---|---|---|---|---|---|
| % | 78.5 ±2.5 | 76.6 ±4.4 | 83.2 ±3.9 | 83.0 ±3.9 | 82.6 ±4.0 | 75.7 ±5.0 | 69.4 ±8.2 | na | 79.7 ±1.6 |
Legend
.. Not applicable.
na Not available.
Source: Chapter 17 and attachment 17ASome results reported here include 95 per cent confidence intervals (for example, 80 per cent ± 2.7 per cent).
Performance indicator data for Aboriginal and Torres Strait Islander people in this chapter are available in the attachment tables listed below. Contextual data and further supporting information can be found in the chapter.
| Table number | Table title |
|---|---|
| Table 17A.10 | Greatest need allocations as a proportion of all new allocations — SOMIH (per cent) |
| Table 17A.13 | Proportion of new tenancies allocated to households with special needs — SOMIH (per cent) |
| Table 17A.15 | Dwelling condition, public housing, 2014 (per cent) |
| Table 17A.16 | Dwelling condition, SOMIH, 2014 (per cent) |
| Table 17A.17 | Dwelling condition, community housing, 2014 (per cent) |
| Table 17A.18 | Dwelling condition, Indigenous community housing, 2012-13 (per cent) |
| Table 17A.21 | Net recurrent cost of providing assistance per dwelling (excluding the cost of capital) — SOMIH ($ per dwelling) |
| Table 17A.23 | Net recurrent cost per dwelling — Indigenous community housing (2013-14 dollars) |
| Table 17A.25 | SOMIH occupancy rates as at 30 June (per cent) |
| Table 17A.27 | Indigenous community housing occupancy rates (per cent) |
| Table 17A.29 | Average turnaround times for vacant stock — SOMIH (days) |
| Table 17A.31 | SOMIH rent collection rate (per cent) |
| Table 17A.33 | Indigenous community housing rent collection rate (per cent) |
| Table 17A.36 | Proportion of SOMIH tenants rating amenity aspects as important and meeting their needs, 2014 |
| Table 17A.37 | Proportion of SOMIH tenants rating location aspects as important and meeting their needs, 2014 (per cent) |
| Table 17A.41 | Average weekly subsidy per rebated household, at 30 June — SOMIH ($ per week) |
| Table 17A.42 | Low income households in social housing, at 30 June |
| Table 17A.43 | Proportion of low income households in social housing spending more than 30 per cent of their gross income on rent, at 30 June (per cent) |
| Table 17A.46 | Proportion of household gross income spent on rent — low income households in SOMIH, at 30 June (per cent) |
| Table 17A.49 | Proportion of overcrowded households at 30 June — SOMIH (per cent) |
| Table 17A.51 | Proportion of overcrowded households in Indigenous community housing (per cent) |
| Table 17A.52 | Proportion of Aboriginal and Torres Strait Islander households in public housing living in overcrowded conditions, by remoteness (per cent) |
| Table 17A.53 | Proportion of Aboriginal and Torres Strait Islander households in SOMIH living in overcrowded conditions, by remoteness (per cent) |
| Table 17A.54 | Underutilisation in social housing at 30 June (per cent) |
| Table 17A.56 | Customer satisfaction — SOMIH, 2014 (per cent) |