Benedict Davies
Hello, I'm Benedict Davies.
Simone Wong
Hi, I'm Simone Wong. Welcome to the ESA Victoria's podcast series.
In this episode, we're fortunate to have two guests.
Benedict Davies
Commissioner Catherine de Fontenay from the Productivity Commission and professor Jeff Borland from the University of Melbourne.
Simone Wong
Prior to commencing her role as a full time Commissioner, Catherine was an Associate Professor of Economics at the Melbourne Business School. She has also held visiting positions at the Stanford Institute for Economic Policy Research at Stanford University and the Stern School of Business.
Benedict Davies
Jeff Borland is Truby Williams Professor of Economics at the University of Melbourne. His main research interests are the operation of labour markets in Australia, program and policy evaluation and design, economic history and sports economics. Jeff has also held visiting positions at Harvard and the
ANU.
Simone Wong
Today they discuss both the Productivity Commission's work and Jeff's research into labour market outcomes for young people over the past decade. They will also explain the implications of their research for young people in the context of the COVID-19 pandemic. Over to you Jeff and Catherine.
Catherine de Fontenay
Welcome everyone, we're here to talk about the job market for young people, which is much on everyone's mind at the moment. So the way we're going to organize this is we'll begin by talking about the period from the GFC in 2008 until shortly before the covid crisis. That's the period that the two papers
we’re talking about today are focused on. But what we'd like to do is move on to thinking about the implications of those papers for the current covid crisis and what it means for young people.
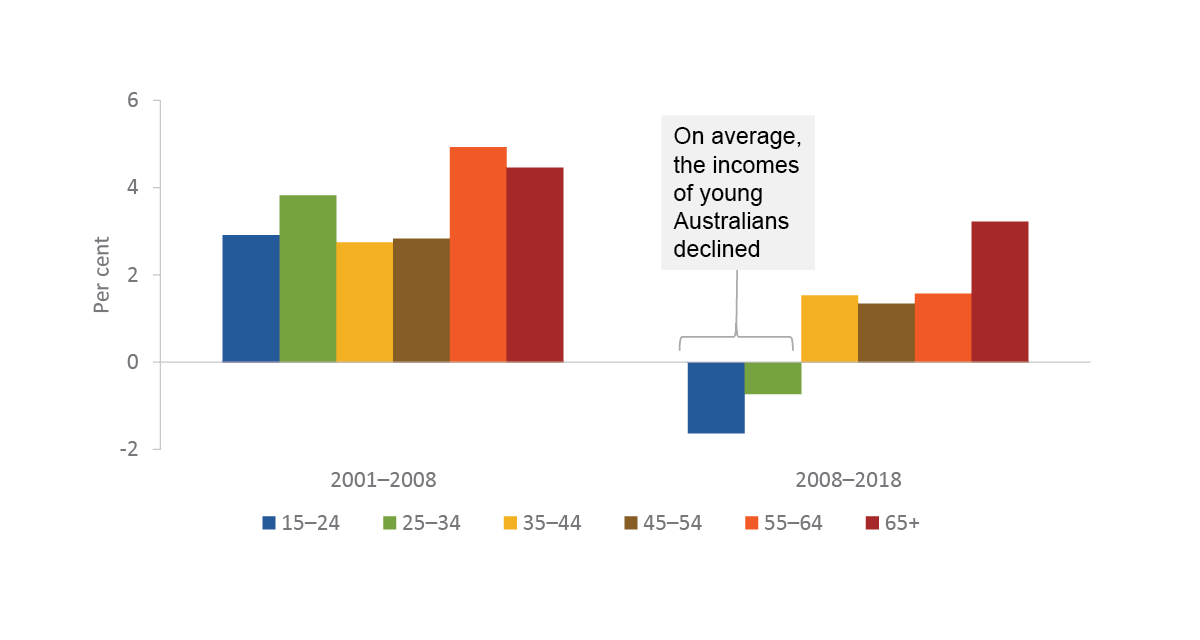
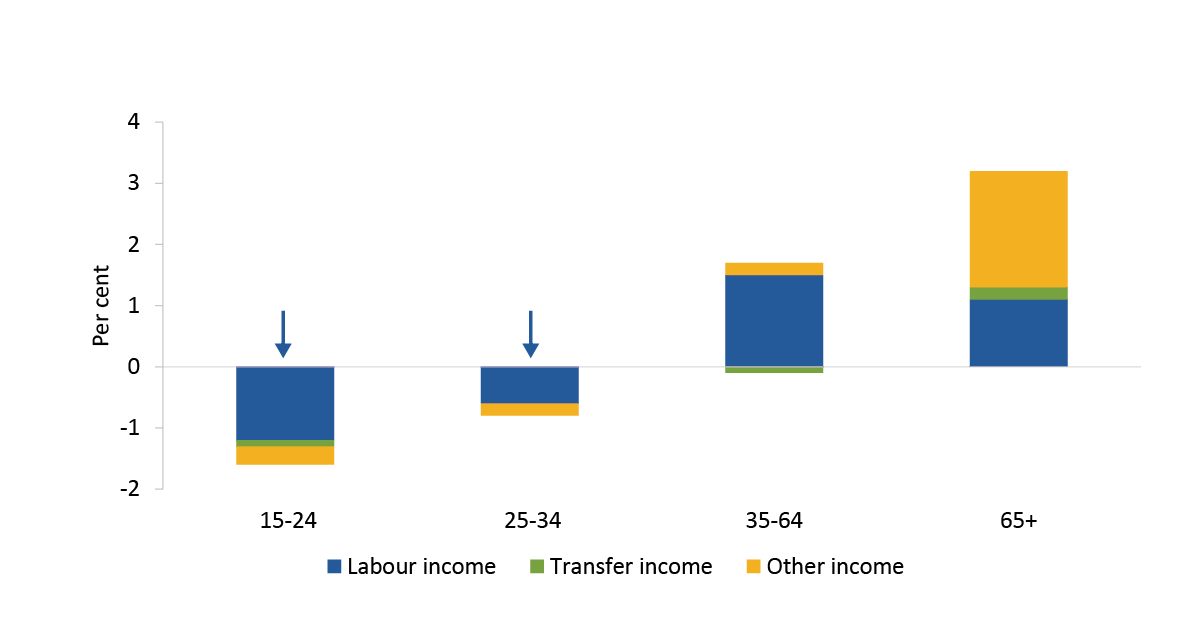
The Productivity Commission has just completed a report on youth incomes looking at why incomes haven't grown from 2008 to 2018 for young people.
Who are young people? So we actually mean both people aged 15 to 24 and also people aged 25 to 34.
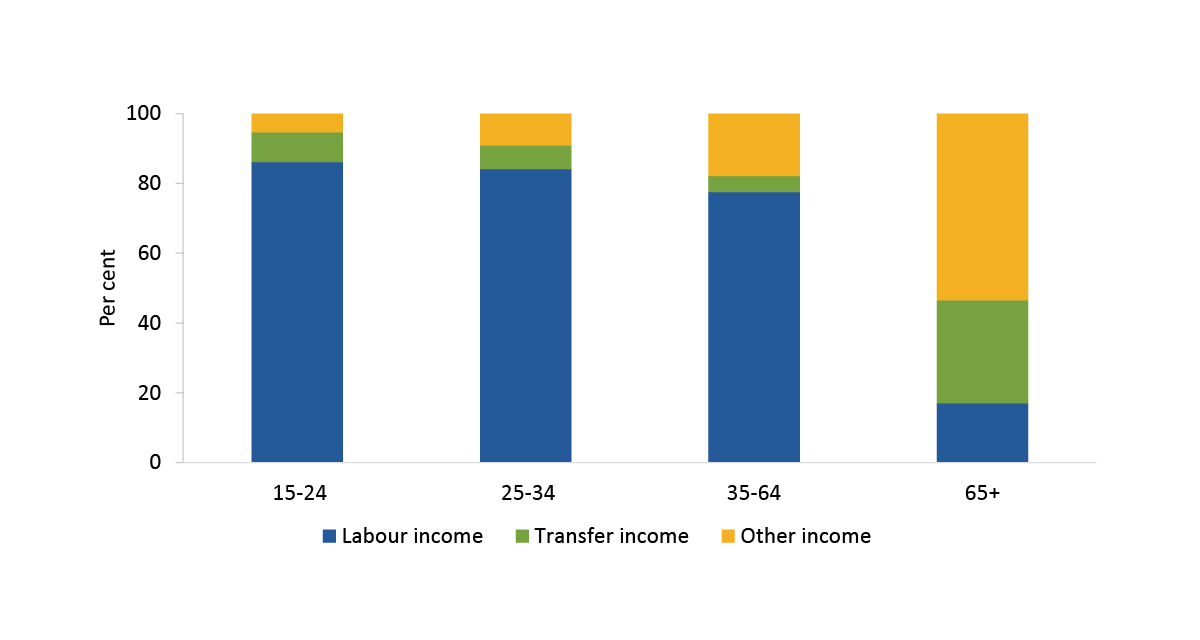
We looked at a number of components of income so labour income, income from government allowances and pensions such as Newstart, income from running your own business, investment income and transfers from your parents. Interestingly, transfers from your parents was the only category where income grew
over this whole.
So it was a discouraging story for young people since 2008. For most young people, income is mainly about labour income — what they get from their job. So today we're going to focus on the labour market.
Jeff, could you tell us about the recent paper by Borland and Coelli on youth employment — What's been happening to employment for young people under 25 and why?
Jeff Borland
Hi Catherine, thanks very much for inviting me to be part of the podcast. It's a really important topic and having had a sneak preview of the reports, I know how interesting and valuable the contributions they make to understanding the outlook for young people are. So it's really nice to be able to
join with you in in this discussion.
Yeah, you mentioned the work that I've done with my colleague Michael Coelli at University of Melbourne so we looked, I guess, in a couple of ways at something only slightly more specific.
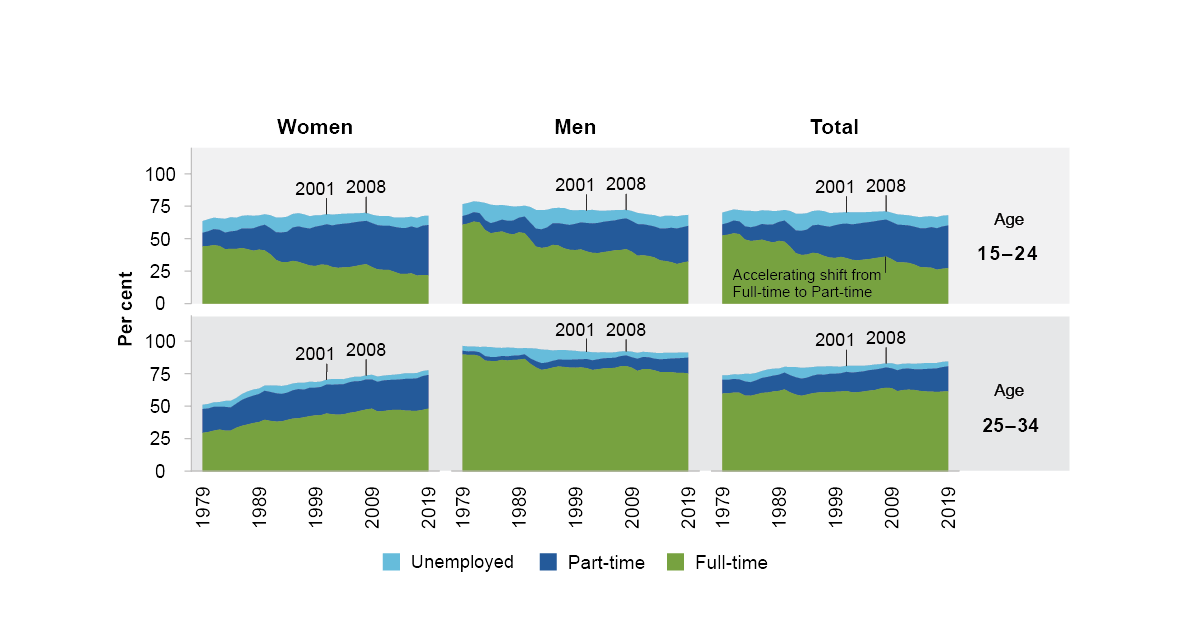
First of all, we define young people in our study is aged 15 to 24 and we focused on looking at employment outcomes, which as you mentioned, that fits into an understanding of what's happened to labour income and income of young people but more specific than the sort of task that PC’s undertaken.
What we found from our research is that we looked at the period after the GFC the decade or so after the GFC and I guess the first thing we tried to do is just to document what had happened to employment of young people. And how we try to do that is by separating out sort of pre‑existing trends in employment
of younger and prime‑aged and older people and try and separate out the effect of the business cycle. Because, for example, we know that young people's employment always decreases more in downturns and increases more in upturns.
So what we're really trying to say is look, putting aside those sort of influences, did we notice something particular about employment outcomes for young people after the GFC and we think the answer is yes. When we do the best job we think we can to control for the business cycle and trends, we think
that the employment population rate of people aged 15 to 24, that is, the proportion of people at that age who are in employment fell by about four to five percentage points during that time. And that's quite a sizable amount when you consider that back at, you know, coming out of or around the time
of the GFC, there was about, the employment population rate was about 60%, so we're talking about, pretty sizable, what economists will get decline in employment population rate.
We think the main explanation for that is really what's been happening in the aggregate labour market. You know labour demand and labour supply that following the GFC, we ended a period of slower growth in aggregate employment.
But labour force participation — while it's slowed a little bit after the GFC, didn't slow anywhere near as much. We've had this decade when labour supply has been expanding, sort of more rapidly than the labour demand. Or, you know, the number of people who want jobs is expanding more
than the number of jobs available.
Now when that happens, young people are in sort of a particularly disadvantaged position. Because they're the ones who are trying to make their way into the labour market or that they're in an above average share of that group. So they finish their education and they're wanting to get into work. So
they really depend on sort of new employment opportunities coming up. And when less new employment opportunities are coming up, then they tend to be one of the groups who get squeezed out. So we really think what happened in the decade after the GFC is that we've seen slowing aggregate employment growth
not quite as fast slowing in labour supply and young people have been crowded out of the labour market as a result.
Catherine de Fontenay
We also notice this decline in employment for young people and our first thought was that this was due to people spending longer in school, so there has been a decline in the long, long, long term employment in that younger group, mainly because people are spending more time in school. Do you think
that that's part of the story in this case? That people are studying longer or is it mainly this labour market story?
Jeff Borland
We found that young people spending longer in school wasn't sort of a major part of the story after the GFC. In fact, after the GFC, this sort of the impact of young people staying in school longer on their employment population, it was quite muted. I mean, maybe it's useful just to take a step back
and say look, the issue here is that you've kind of got two groups of young people, some who are in full‑time education, some who aren’t in full‑time education. People who are in full‑time education have on average lower likelihood of being in employment than people who aren't in full‑time education,
and so when you change the composition of young people or the mix towards people who are still in school, you kind of automatically lower their employment population rate. So as soon as you suggest your underlying question, Catherine, you know, probably we wouldn't worry so much about this decreasing
employment rate of young people if it was mainly being driven by this composition effect of them staying in school longer, but we found and I know you found as well that this composition effect isn't what's occurring. But basically you're getting declines in employment rates, within those groups of young
people who are students and not students.
Catherine de Fontenay
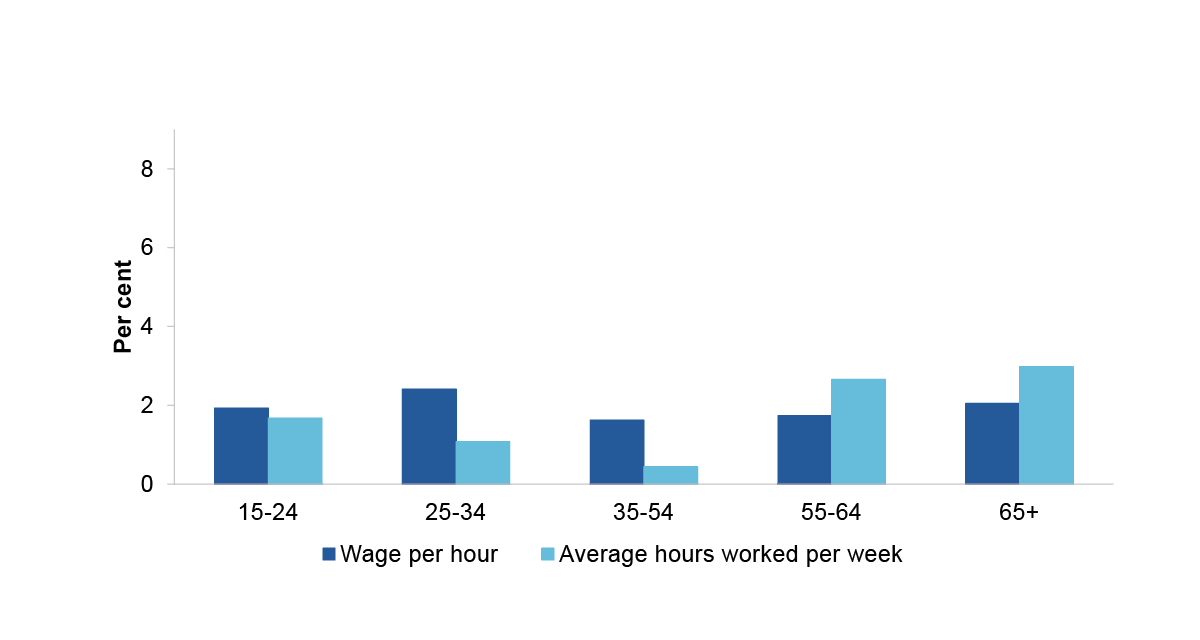
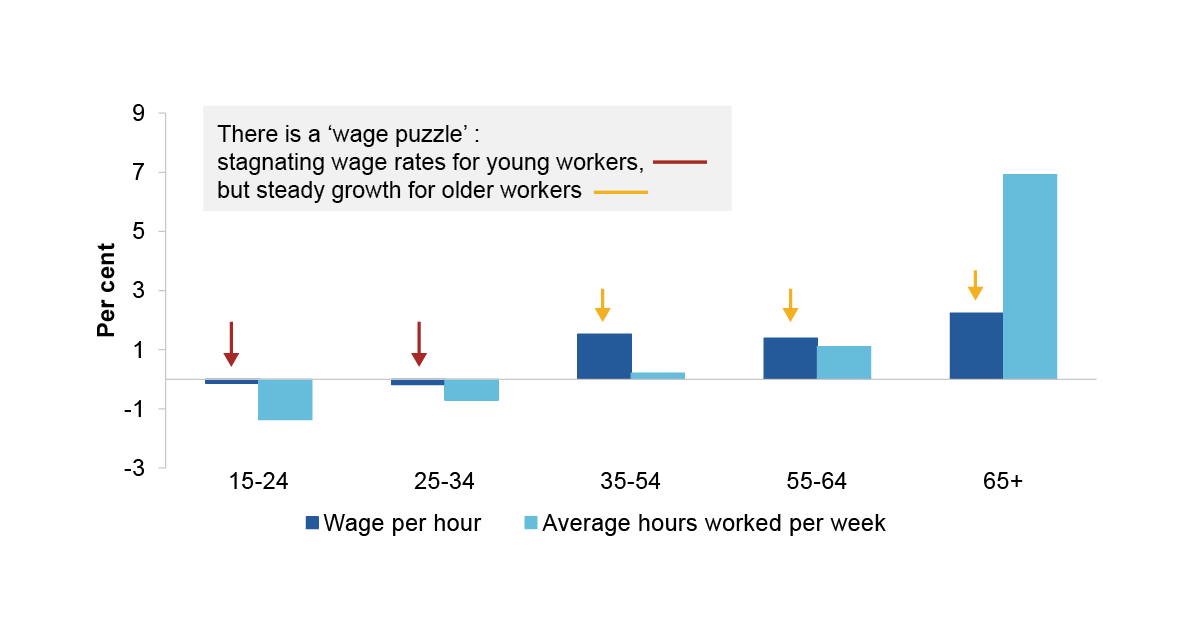
Yeah, so as Jeff highlighted, we do agree with his assessment. It is a market with weak labour demand and competition for jobs seems to be driving things now. In addition to the employment that Jeff and Mick looked at, we also looked at what was going on in wages and similarly for them we find a big
difference in outcome between those who already have a job, which on average is the sort of the older group, so the over 35s mostly already have a job and then those looking for a job so that includes those in the 15 to 24 category, but also a fair number of people in the 25 to 34 category who have finished
their studies and are looking for work.
So one thing that's interesting is there's some very interesting work from Guyonne Kalb and Jordy Meekes showing that by and large firms didn't cut wages for workers who were already in jobs after the GFC. Wages for those workers who were already in jobs just didn't grow quite as fast as before the
GFC, so this is called the sticky wages phenomenon. What it means is that firms don't really like cutting wages for their existing workers, even if conditions in the job market change. That could be about workers’ motivation that could be about awards that could be about agreements.
But what it means is that people who already have a job don't necessarily feel the effects of a bad labour market. Firms can offer lower starting wages to new workers, but what Kalb and Meekes found was that once workers were employed young workers’ wages grew fast and that may be because they
were being compared to those other workers who already had good wages. So Jeff, what are the good and bad aspects of this sticky wages phenomenon?
Jeff Borland
Well Catherine, this is a very big topic. I guess at various stages this has been the subject of a huge amount of research.
As you know, our colleague at University of Melbourne Ian McDonald was one of the people who sort of back in the 1980s made one of the really seminal contributions to this literature. As you suggested, I guess there's sort of two main approaches to think about sticky wages.
One is, as you said, that in countries like Australia where we have, uh, you know regulation of labour markets, we have minimum wages for workers here on awards, so part of sticky wages is workers who are on awards. They have the regulated minimum, and they're affectively not being scoped to adjust
wages.
You know, the second approach is a whole lot of sort of explanations for why in some sense it's optimal for firms to not cut wages. Or for it to need to be a very sort of big negative demand shock to get to the stage of thinking that that would be a way of adjusting. You know, I guess, for example,
there are sort of psychological‑based theories that say that workers’ morale, their attitude towards the firm and hence their productivity is adversely affected by wage cuts.
You know what Guyonne’s and Jordy’s really interesting research shows is that that does seem to be a phenomenon over the last couple of decades in Australia as well.
Catherine de Fontenay
It's interesting that while we saw sticky wages in that decade after 2008, it's probably because it wasn't a major recession, just a period of weak growth. But what I've found interesting slash depressing about the covid crisis is it's a bad enough crisis that we are seeing some firms sit down and say
that we have to renegotiate wages if we want to avoid huge numbers of job cuts. So it is a sign of just how serious the current crisis is that some firms have actually, despite this sticky wages phenomenon said, look, the current wages are not sustainable.
Jeff Borland
Yeah, I think that that's right, Catherine.
And I mean the other point to make about the sticky wages is that of course, and again, this is a point that your report, really, you know gets to, is that there's the wages of workers who are already in the firms, and then there are the wages of the workers who are being hired. And it's the wages of
the workers who are being hired that the so of course, obviously the same kind of institutional regulations applied to those workers that you can't be paying newly‑hired workers less than award wages or less than wages agreed under enterprise agreements, but it seems like you know those kind of other
arguments about sort of optimal stickiness don't apply to the hiring wages that we see, sort of a lot more adjustment in the hiring wages and so, that's an issue sort of again when it comes to thinking about young people that when you have adverse labour market conditions, they're going to find it harder
to get into work.
And then they're going to find their starting wages as sort of one of the ways in which employees are adjusting to a downturn so as your report sort of shows you, if you want to understand that the income situation of young people, you've got to understand both those perspectives of employment and wages.
Catherine de Fontenay
I guess the Kalb and Meekes result does sort of shed one light of hope on that. Which is they might start with much lower starting wages, but those do grow faster. And so that might balance that particular effect out in the long run.
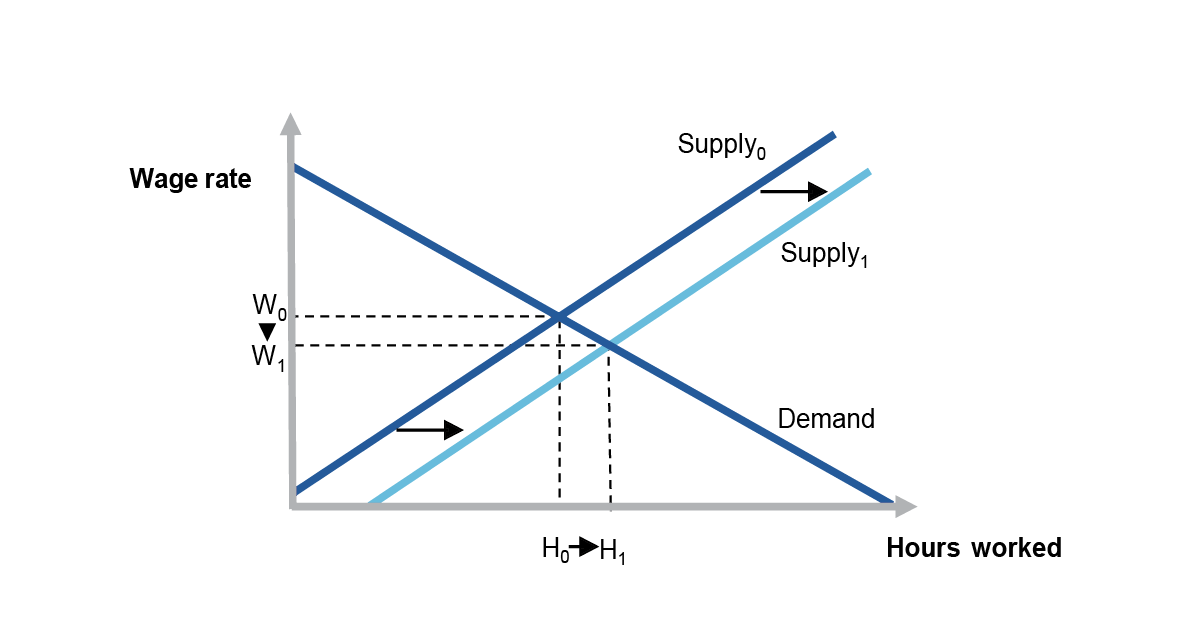
Now the Productivity Commission report identified another reason that labour supply and labour demand were misaligned during this time. And that's the big expansion of the University sector. The Commonwealth lifted caps on University places in 2009, and by the time caps were reintroduced, the number
of University students had increased by a third.
So there was substantial growth from 2009 to 2013.
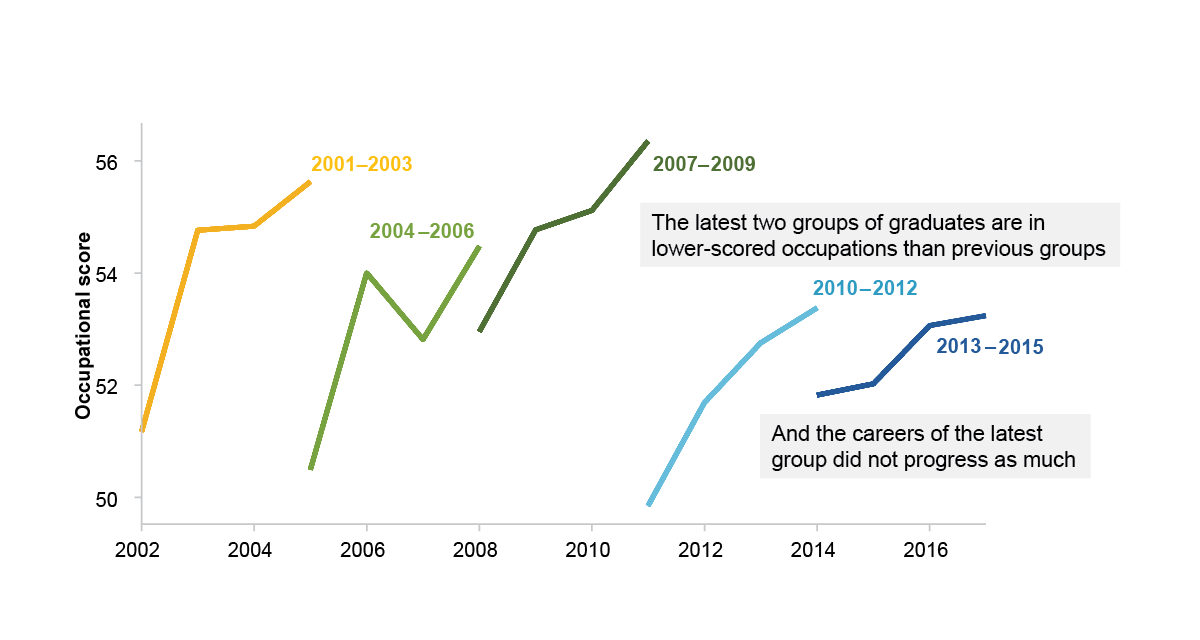
The result was that University graduates faced lots more competition when applying for their desired job.
What our report found was that many of them had to move down the jobs ladder. So a law graduate who missed out on a role at a prestigious firm would then try smaller law firms, or might give up and work as a paralegal, or in a hospitality job, or they might stay in a casual job while continuing to search
for the job they want. We find that phenomenon of moving down the jobs ladder quite an interesting one.
So one interesting question is how do we measure moving down the jobs ladder?
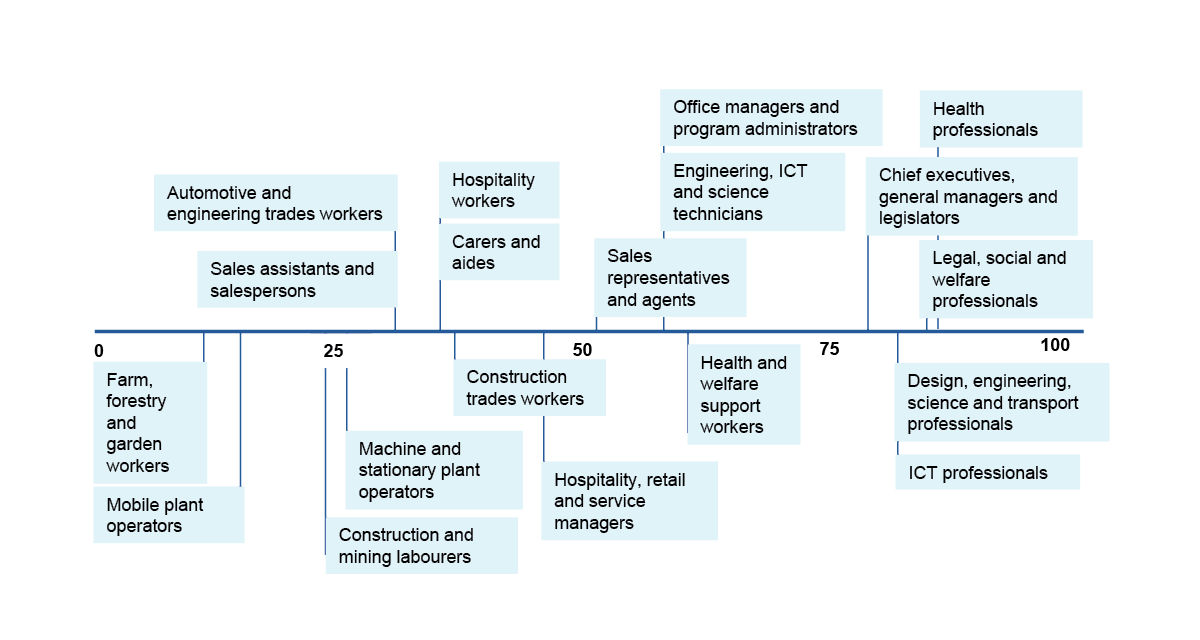
We use something called an occupational score from ANU. ANU developed a method for giving each occupation a score based on the education required for the job and average salary in that job. Now, just to be clear, obviously people care about more than just salary, but if you see a whole group of young
people moving further down this occupational score distribution then that's probably involuntary.
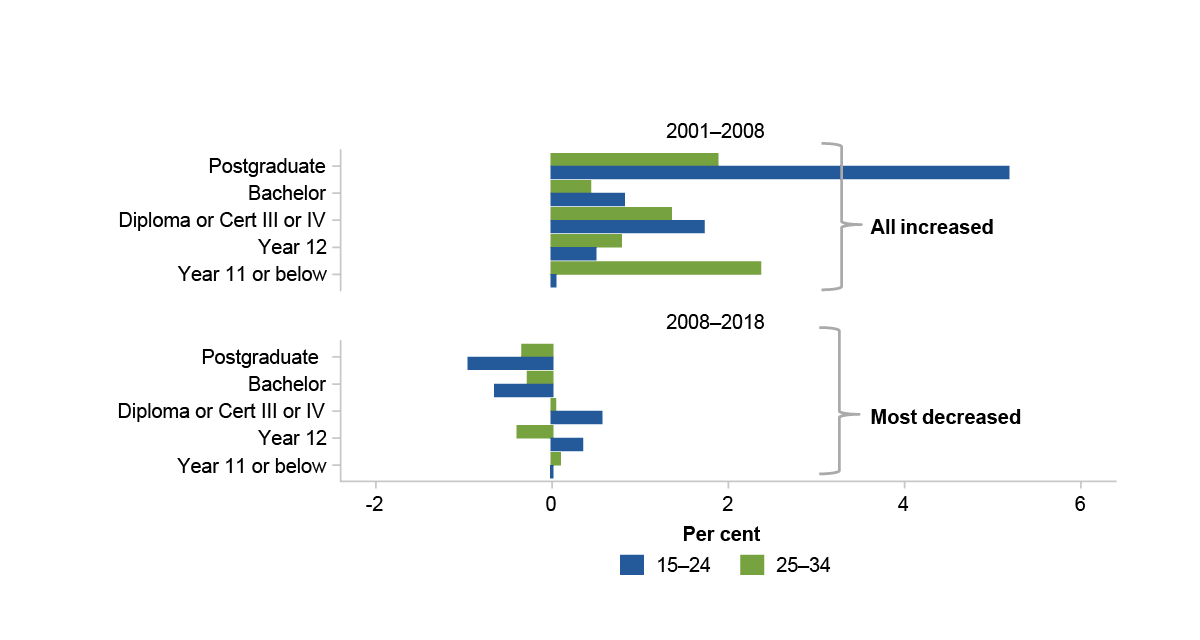
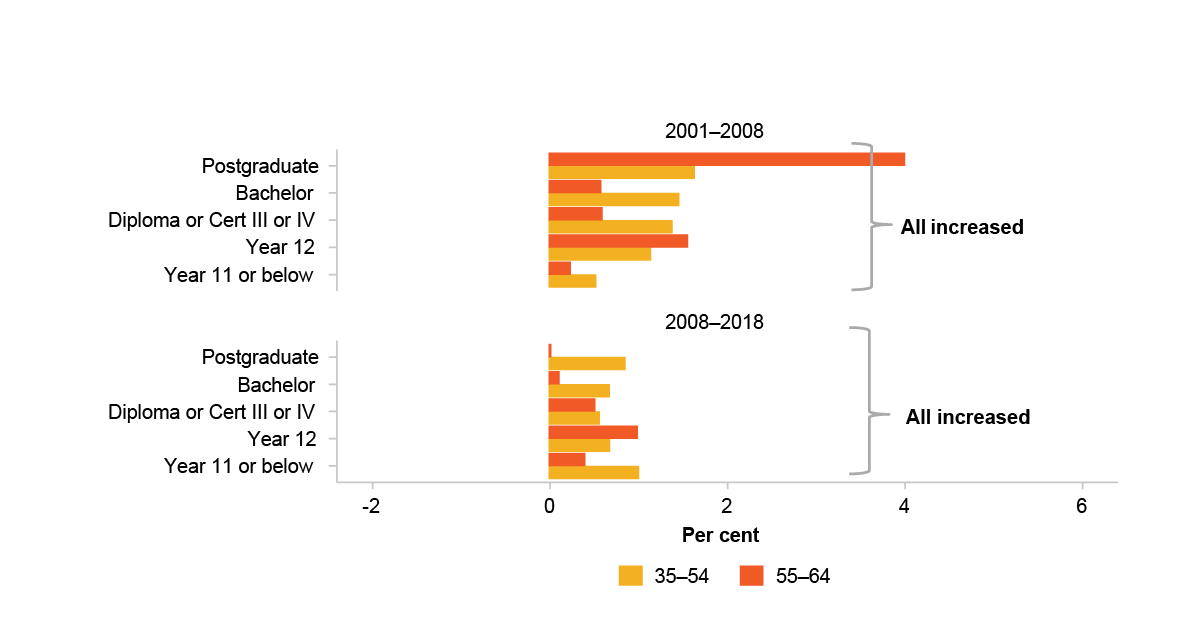
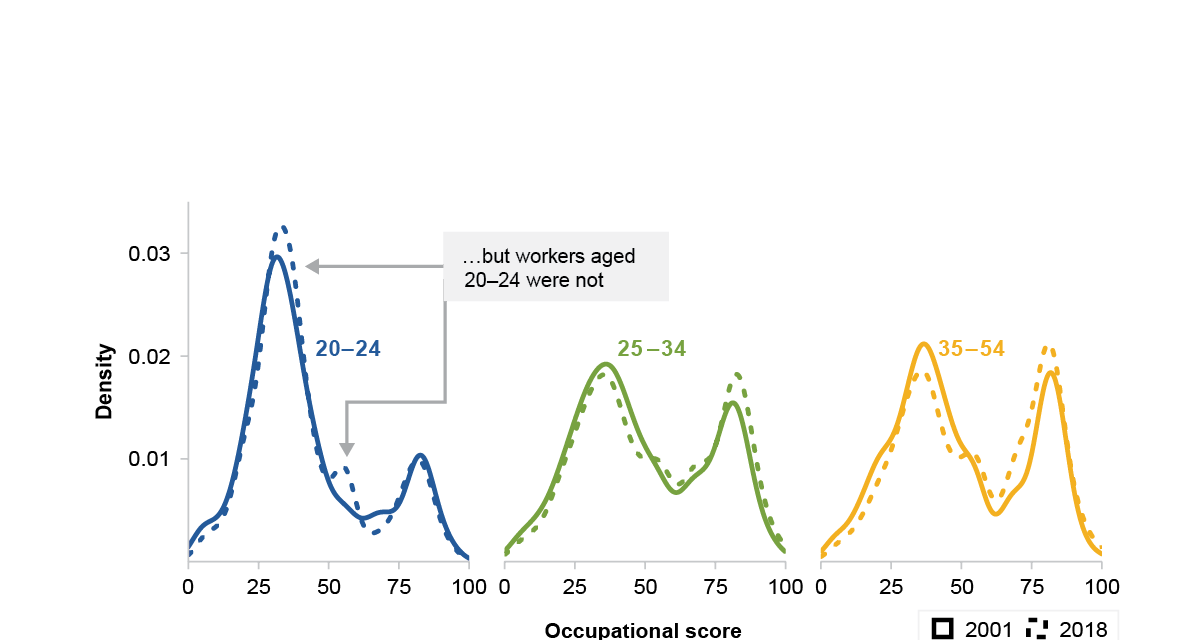
So we see two really interesting patterns. First, in the Australian economy overall the number of high‑scored jobs has been increasing, so that's good news that reflects the fact that all age groups have more education than they did in the past. And the types of work that's required has adjusted to
what's there, somewhat.
But the bad news is the chances that a graduate gets a high‑scored job has decreased by 2018. So even compared to 2001, if you are, say, a University graduate, your chances of getting the high‑scored job are substantially lower. So what that tells us is that graduates are facing more competition when
they're going for the jobs that they want.
And we also suggest that this has implications for other age groups because we also see the same results for people with vocational degrees and what we think is that these university graduates might have pushed these vocational graduates further down the jobs ladder as well for certain types of work.
And then at the bottom of the jobs ladder if you will, are young people who have limited education, maybe who left school relatively early and now they find themselves competing in the casual markets with even university graduates. And so we see a rise in long-term unemployment in certain disadvantaged
groups.
So this is quite a worrying phenomenon. Seeing a rise in long-term unemployment, seeing people in jobs that aren't fully using their skills, and we're worried about something called labour market scarring. So Jeff, what is scarring? And should we expect to see scarring in this generation of young people?
Jeff Borland
With regard to scarring, I guess I like to explain it by saying, it's what you usually understand by the word that if you cut your finger it sometimes bleeds a bit and then it heals and like a month later you wouldn't know that anything had happened to your finger.
But sometimes if you have a bigger cut on your finger, it bleeds, then it gets fixed up. But a month later you can see a little mark, the scar where it was. In exactly that way scarring is the idea that if young people (it can apply to older people as well but here we're talking about younger people)
if you experience some sort of adverse event or outcome at a point in time, that can have long‑term adverse consequences. So simply stated — if you are entering the labour market at a time when there's more competition, then that makes it more difficult for you to get a job at that
time. So, on average, that's an adverse experience for young people.
But unfortunately the evidence suggests that the effect of entering the labour market at a point in time where there's more competition, isn't confined to that period of time that it extends into the future. Most of the research on this topic has looked at the effect of entering the labour market in
macroeconomic downturns and so to my mind, the best recent study, we don't have studies at the moment for Australia, but the best recent study for the US found that for young people finishing their education at a time when the unemployment rate was about four percentage points higher than average, they
would experience, on average for the next decade, 6 per cent lower income every year. So in other words, 60 per cent over the 10 years or in other words, they'd lose about half of the labour income they might have expected to earn in the next decade because of having entered the labour
market in more difficult conditions.
Why does that happen? Well we think that there's two reasons. One reason is that if you enter the labour market when conditions are more difficult, as you said Catherine, you have bigger chance of being unemployed or long‑term unemployed. And we know that that casts a long shadow that if you are unemployed
today you are more likely than someone who wasn't unemployed today to be unemployed in the future. That could be because of skill atrophy. It could be because of negative effects on motivation. It may be that there's some stigma effect associated with having been unemployed.
The other reason scarring occurs, which is very much related to your research on job mobility, is the idea that in a macroeconomic downturn — macroeconomic downturn is just when demand is relatively low compared to supply — and that's really what you're describing in your report.
And in the last decades for this particular group of young people demand has been relatively low compared to supply. What that means is, exactly as you've described, that young people, probably in their first job, have to start further down the job ladder than they would have otherwise, and they can't
just undo that in an instant. Usually when you're in a downturn, that downturn lasts for a while. Young people can't move instantly between jobs. So It's not like I've had to take this lower job, but tomorrow I'm going to be out and moving to a better job. It takes time for job opportunities to come
up. And especially when you're in a general downturn.
So the other reason for scarring is that young people who are entering the labour market during more difficult times get pushed down the job ladder and it takes time for them to work their way up the job ladder. The international evidence suggests that lots of young people are able to make that transition,
but especially lower‑skilled young people may find it difficult to actually move up the ladder.
Catherine de Fontenay
Yeah, one interesting thing that we found in our work was that, if anything, this group of young people are moving up the ladder slower than in other periods and so it's not just that they're starting lower, it's that we're not seeing that same movement up the ladder.
It's not radically different to other periods, but you would hope it would be easier to move up quickly if we see a lot of people starting, a lot of smart people, starting low on the ladder and you would think employers would be more open to giving some of those people a go, but we're not seeing a lot
of movement up the ladder.
Jeff Borland
No, I think this is a really good point Catherine, because even in regular times, of course people moved. It's not like there are these normal times where everyone gets a job and that's their job forever. Of course, everyone moves up the ladder. Lots of people, their career trajectory is to move up
the job ladder even in what we consider good or normal times. But I think what you're describing is look there's always (even in one of the 2000s) there's this mobility up the job ladder but when you move into a time period where you know demand has decreased relative to supply that mobility up the job
ladder, which would usually happen, gets slow. That's exactly the sort of phenomenon that’s associated, for example with scarring.
Catherine de Fontenay
Yeah, so it's very worrying and you could understand why young people feel discouraged about their job prospects. So, speaking of worrying and discouraging, let's turn now to the current COVID crisis. So what we know, and particularly thanks to Jeff's work, is that this really affected young people.
So Jeff, tell us from your work, how is the current crisis affecting young people?
Jeff Borland
So the big point is, Catherine, we know that, for whatever reason, the employment impact of COVID is being concentrated on a set of industries: accommodation and food services, arts and recreation, and retail trade to some extent as well. They basically explain 2/3 of the of the employment decreases
that occurred in Australia between February and May.
The reason young people have been so adversely impacted is that they happen to make up 50% of the workforce in those in those industries. Whereas young people in March 2020 made up about 15% of employment in Australia they made up 40% of the decrease in employment that occurred between March and May.
So really the big driver of the impact on employment of young people has been the industry composition.
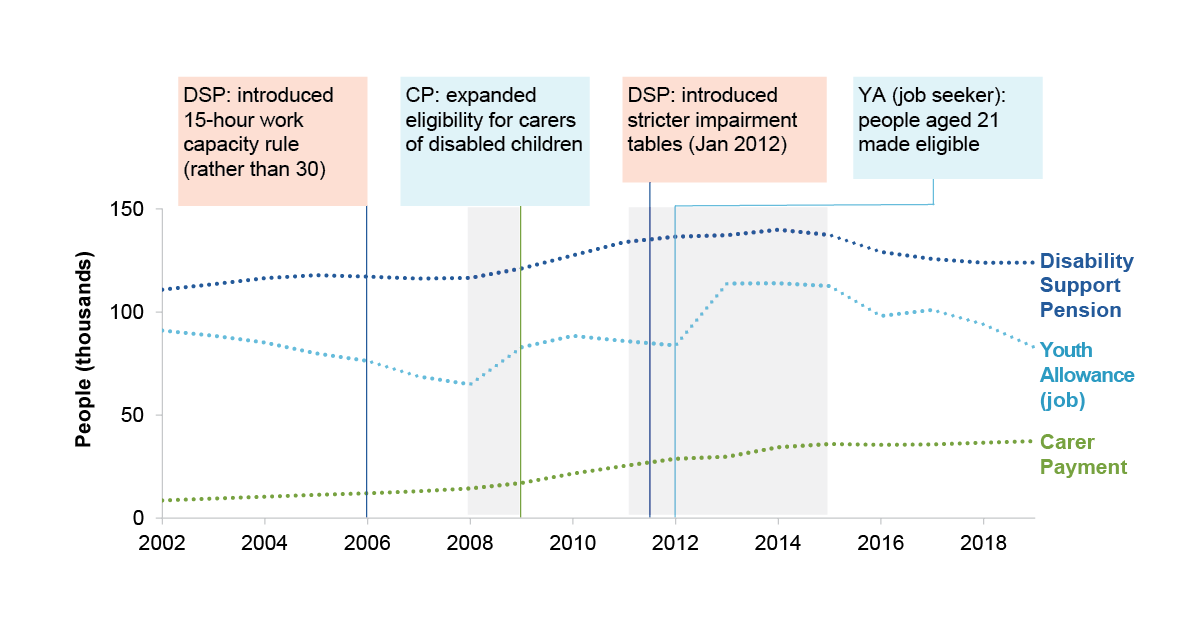
That's been exacerbated a little bit by government policy. So as you know, the JobKeeper policy excluded particular groups: casual employees had been in their job for less than a year, temporary migrants. It's also the case that they tend to have an above average share of younger people. Employers are,
of course, more likely, to lay off those workers because they can't get a JobKeeper wage subsidy for them. So it's likely that that's exacerbated that a little bit as well.
Catherine de Fontenay
Now you showed that there's been some recovery from May to June of employment for those people, but it looks like it's still a lot worse news for young people than for older people. Even if we look at the numbers in June. Am I right?
Jeff Borland
That's right Catherine, there has been from May to June — just to give some background from March to May, we saw about a 10.5% decrease in in hours worked in Australia and about a 6.7% decrease in employment. What we then saw from May to June, with reopening of the economy and relaxation of restrictions,
and COVID being substantially removed in a lot of states in Australia was that economic activity picked up again. And so hours worked increased by 3.5% and employment increased about 1.5% as well, and what was really happening there is that the same industries, which were most adversely affected to start
off with, they of course were the industries which have bounced back most. And because young people, as we've just been talking about, because young people were most in those industries, they have benefited most from the reopening and relaxation of restrictions. But exactly as you're saying, in exactly
the same way, as those industries haven't completely bounced back to where they were before the downturn started, young people's employment hasn't completely bounced back to where it was before. So yeah, some improvement in the last month that we have data for, but certainly not back to where things
were before COVID.
Catherine de Fontenay
Right. Now Roger Wilkins from the Melbourne Institute did some work on the characteristics of workers in these hard hit industries, and he has one interesting point which is that one small comfort is that the majority of these under 25 is at least still living with their parents, and so that provides
a cushion when young people lose their jobs. We also found that in our report: we found that in this pre-COVID era, as young people earned less, people who were 20 to 24 years old were more likely to live with their parents than in earlier periods, and more likely to receive financial help. But we also
found that only some parents could afford to have kids at home. So staying with your parents longer was much more likely in high‑income families.
Now Jeff, am I right to think that because many low‑income families will be dealing with job losses or reduced hours themselves, they may not be in a position to help their kids? It's just been a terrible time for so many people.
Jeff Borland
Yeah, so I think that's a really important point Catherine. I mean, the general point here is that in the end, probably what we can care about as economists, is general wellbeing: the extent to which we are able to consume necessary goods and services. So while it's really important to look at labour
market outcomes, it's always important from a welfare perspective to think about the extent to which that's translating into people's capacity to consume what we think of as the necessities of life. And so, exactly as you've said, I think Roger's work is really important in directing us to the fact that,
at least this initial wave of impact in being concentrated on young people, some of the negative impact of that is going to be cushioned, or limited by them living with parents who are able to support them.
And one piece of evidence in support of that idea is that we saw when the we were going through the phase of the decrease in employment, a huge withdraw from the labour force by young people who'd been displaced from employment. Maybe signaling that they didn't think there was big chance of getting
a job, but perhaps also signaling that they had this support to fall back on.
But, exactly as you say Catherine as well, that ability to provide support varies between families, and we know that it's not just the young. Young people might have made up 40% of the job losses, but they are still 60% of job losses spread across the other age groups. We also know that the job losses
which are occurring have been very much concentrated on low-pay occupations. So, for example, if you line up the occupations according to their average earnings and take into account how many people are employed in each of those occupations, from February to May, 60% of the employment decrease was in
the bottom 30% paid of occupations.
So it's important to recognize that there is this cushioning capacity from people having these broader family groups of living within your household with their family. But exactly as your said, Catherine, I think it's also really important to recognize that the scope for that cushioning is likely to
vary between families and that's why we have to keep worrying about the social safety net as we proceed to recovery.
Catherine de Fontenay
Yeah, and it highlights that anyone that does not have a broader support network — younger or older — who are in these low‑paid industries have taken a really big hit in this. For those of you that don't know, Jeff produces a newsletter that provides information on the labour market outlook
in Australia and background on some of the academic research, and I really encourage you to sign up for it because it's awesome.
In one of his latest newsletters, he's pointed out that there's two effects on young people of the COVID crisis. There is the immediate impact of some industries getting shut down, and as we were talking about this resulting high unemployment. But there is a longer‑term bad macroeconomic outlook. That
means that a broad set of industries are going to be hurt longer term, and that there will be slow job creation for quite a long period.
There's weak demand in the market, which means, and that's because lots of people have lost their jobs and are spending less. And so fewer new jobs are going to be created. But then there's a lot of unemployed people looking for work and a lot of people finishing their studies both under 25 and in that
25 to 34 year old age group. People finishing their studies and looking for work. And those people are going to be competing for fewer jobs.
So Jeff, what sort of policy options should we be considering at this point to help young unemployed people over the next few years?
Jeff Borland
I tend to classify the policy options into three groups, Catherine. The first group is exactly as we were talking about in the first part of the conversation: employment prospects for young people depend on the balance of demand, aggregate demand for labour and aggregate supply of labour. Young people
get squeezed out of employment when there's not enough new job creation going on. I would always say if someone told me, you've got one minute to tell the treasurer what they should most do for the young people. What would you emphasize? I'd go in and say look, keep doing the macro policy because the
best way to help young people is to run macro policy in the optimal way to get overall recovery happening as fast as possible — we get job creation as fast as possible.
Catherine de Fontenay
So could you give listeners an example of a macro policy?
Jeff Borland
Well, one example is, I guess I was on record as supporting the continuation of JobKeeper and some of the other general stimulus measures. My feeling was that, even if you took a best case scenario about how far the recovery would have preceded by September, that we would still be at about the equivalent
to the trough of the 80s and 90s recessions in Australia, and so I've been pretty convinced that more stimulus was needed beyond September. And, I think the decisions to continue JobKeeper and the decision to maintain a high level of JobSeeker — partly for the reason that they underpin the wellbeing
of individuals who would otherwise be being more adversely affected — but partly for the macro stimulus they provide, were good decisions.
Catherine de Fontenay
Okie Dokie. What other types of policies should we be looking at?
Jeff Borland
So I think of there being two other tiers of policy, so macro stimulus to get overall job creation is the first tier, the second tier is policies that direct what employment creation occurs more towards young people than might otherwise occur.
So an example of this would be your wage subsidy, or hiring credit type programs that are targeted at young people. By offering employers some payment or subsidy for hiring young people, it increases the incentive to hire young people relative to other workers. Now again, this is a very long literature
on these on these programs. You know advantages and disadvantages, when they work and when they don't work, but I think it's worth exploring those type of policies at the moment.
The third tier of policy then, is to accept, unfortunately, even with optimal macro policy and even with policies that might direct, to somewhat greater extent, what employment creation does happen towards young people, in a severe downturn, it's inevitable that, on average, young people are going to
spend a longer amount of time between when they would have finished education and getting into work. Not everyone. Some people would move into work as they would have, but some people are going to spend or longer amount of time. For those people, I think it's really important to be allowing them to do
activities that really maintain them on a pathway to employment.
So I guess the two main ideas there are extra skills and training. Hopefully not in a way that increases the debt levels of young people. So I think Victorian government making TAFE free, the Commonwealth government announcements last week about free training in some vocational areas are good ideas.
I think that probably needs to be expanded a bit to encompass other categories of young workers — the types of training and skills that it might be useful for them to do. And then the other policy opportunity is create career guidance and internship programs that maintain contact with work. Again,
there's issues about payment, wanting to do this in a way that young people aren't taken advantage of.
I think the other thing to say about policy for young people is it’s really important for young people to have a voice in this policy space. Especially when it comes to this third type of policy; policies that are intended to help young people stay on a pathway to employment. It’s really
important to get their advice on the types of programs that they think are going to be useful to allow them best to put themselves in a position to obtain jobs when the labour market picks up.
Catherine de Fontenay
Yeah, those are great ideas. There's no time for this unfortunately, but one thing that I've been worrying about is whether there will be fewer internships and fewer graduate opportunities as we work from home. Because with many jobs moving to home, a lot of the opportunities to sort of train graduates
and help interns get settled in, just by them being around the office and seeing how things are done, some of those opportunities have disappeared. So friends of mine have described that it's more challenging to train graduates in their office now that everyone is working from home. So we'll have to
think about ways to keep internships going and to make them as productive as possible.
Jeff Borland
I think that's a fantastic point, Catherine, because it's the technology, but it's also the downturn in economic circumstances. We know that it's an investment — having internship programs is an investment for firms. But it takes resources with the pay off in the future. A general concern is that
it's something firms will see themselves as being able to invest in. That's why I mentioned explicitly as a policy issue. Because I worry that in a recession it's almost like a market failure, that not enough of this stuff is going to happen, and so, at least during this period, there is a role real
role for government to step in and try and promote those type of programs.
Catherine de Fontenay
That's a really good point.
Just as a last question, let's think a little bit about those who are aged 25 to 34, so that group came into this crisis with much less income and savings than earlier generations — that's the conclusion of our report.
So when we think about them in this crisis, they're obviously going to have a more challenging work environment. And when they're trying to change jobs and move up the ladder, that's going to be more difficult than in earlier periods. Are we going to expect those young workers to pick up the tab, as
it were, for the coronavirus Government expenditure in the form of extra taxes over the course of their lives?
Jeff Borland
Well, I guess the answer is we are. By dint of them being younger that tax burden will be, you know, spread out overtime and it will be spread out across young people.
So I think, yeah, I'm not trying to minimize the costs of that tax burden. I mean, I think, the situation we are in, the costs of downturn so concentrated and so focused on particular people, that to me there's definitely a positive benefit cost in terms of trying to offset these really dire consequences
now in return for sort of a more spread out and kind of hopefully evenly distributed sort of burden in the future.
I think the other perspective I have for young people at the moment is that - Government, you're spending all this money and we're going to have to pay for it in the future, make sure you spend some money on us at the moment as well. You know JobKeeper, you are fantastic program, needed at the time
but you know very much focused on obviously on people who are already in work so I guess I've been saying, since the outset that look, as good a program as it is, you know there are groups who are excluded, like young people.
And so I think to me young people, they could complain about the fact they're going to have to pay off this debt in the future. And that's definitely a point. But I think the other perspective for young people at the moment is to say, make sure we get A fair share of the stimulus that's going to go
into the economy. We haven't got it so much from JobKeeper and so government make sure you give enough attention to us with the sort of thought towards job creation and other types of private assistance programs.
And Yeah, the package for apprentices and the vocational training last week to start on that, but I think it probably has to be more broadly based.
Catherine de Fontenay
Thank you, that's a fantastic point. Well thanks everyone so much for joining us. And Jeff - really appreciate your time and your insight into young people's labour markets.
Jeff Borland
Thanks Catherine and congratulations again on the Productivity Commission report on incomes of young people and also your research report on job mobility for young people.
I know a huge amount of hard work went into them, and, it's really reflected in the contribution they make to our understanding of what's happening in the labour market for young people.
Catherine de Fontenay
Thank you so much.