PC productivity update 2015
ISSN 2202-7378
This publication was released on 20 July 2015 and in this edition the Commission analyses the latest ABS productivity statistics and comments on new developments underlying Australia's recent productivity performance.
Each edition will unpack the latest ABS productivity statistics, and report on the findings of the Commission's most recent research into productivity issues.
Download the update
- Productivity at a glance
- Media release
- Infographic
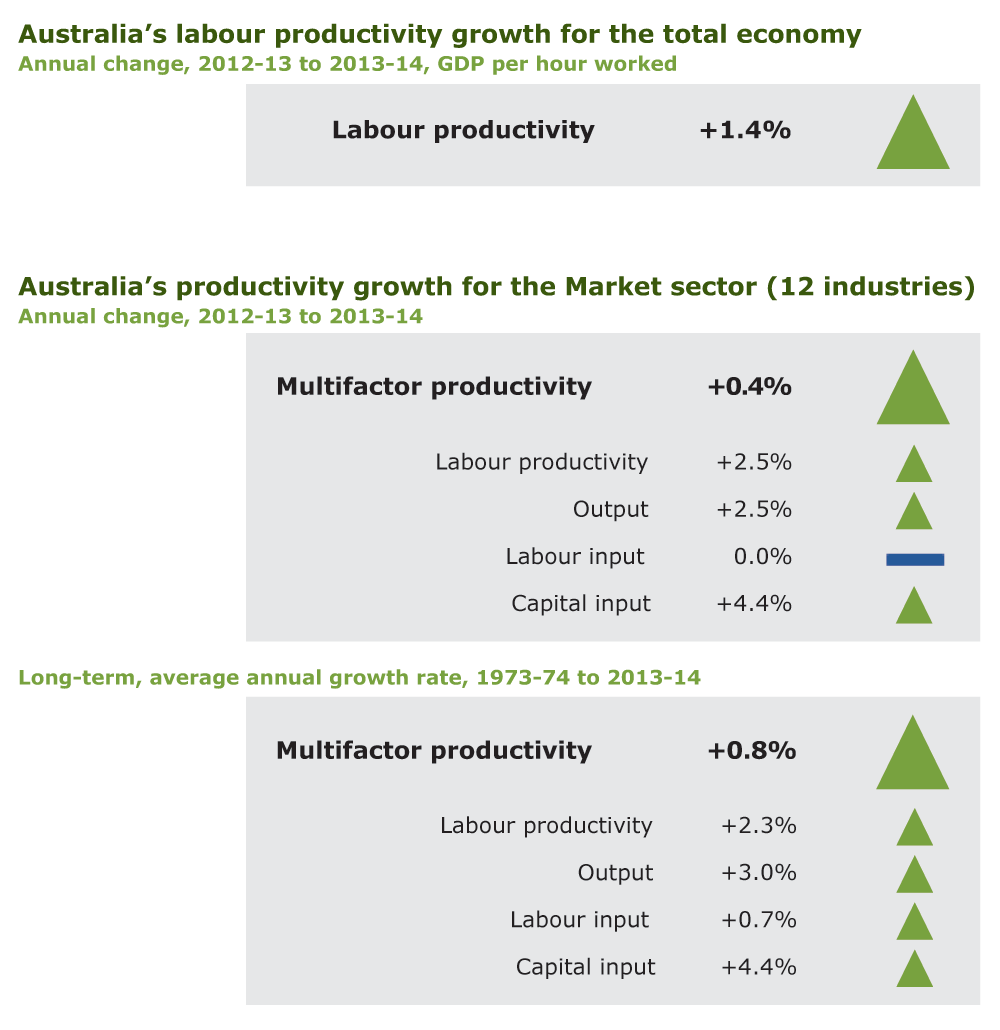
Australia's labour productivity growth for the total economy (Text version of above image)
Annual change, 2012-13 to 2013-14, GDP per hour worked
Labour productivity +1.4%
Australia's productivity growth for the Market sector (12 industries)
Annual change, 2012-13 to 2013-14
Multifactor productivity +0.4%
Labour productivity +2.5%
Output +2.5%
Labour input +0.0%
Capital input +4.4%
Long-term, average annual growth rate, 1973-74 to 2013-14
Multifactor productivity +0.8%
Labour productivity +2.3%
Output +3.0%
Labour input +0.7%
Capital input +4.4%
Data sources: ABS (Australian System of National Accounts, 2013-14, Cat. no. 5204.0, November 2014); ABS (Estimates of Industry Multifactor Productivity, 2013-14, Cat. no. 5260.0.55.002, December 2014).
For more detailed productivity statistics and commentary see Chapter 1.
Australia's Productivity Performance
The Productivity Commission today released the 2015 edition of the PC Productivity Update.
In 2013-14, measured productivity presented some slightly better news: labour productivity for the whole economy increased by 1.4 per cent and, in the market sector, by 2.5 per cent; multifactor productivity increased, albeit moderately, for the third consecutive year (0.4 per cent).
However, as the Update shows, productivity growth is uneven among industries and some were again negative in 2013-14. Furthermore, the productivity growth witnessed in 2013-14 remained well below what is required to maintain our historical growth in living standards. Challenges created by Australia's ageing population, lower workforce participation, as well shifts in the structure of Australian industry and possible further declines in the terms of trade suggest that current levels of productivity growth are less than desirable.
This edition of the Update also:
- emphasises the importance of efficient investment in public infrastructure
- unpacks the productivity performance within the Mining and Financial and insurance services industries.
Infrastructure investment remains an area in which governments at all levels are not addressing fundamental processes needed to ensure that the right projects are selected and that funding or pricing mechanisms connect those investments directly with the preferences of consumers.
The latest sectoral statistics suggest that Mining is coming out of the 'investment stage' and lifting production - providing the early signs of a productivity recovery but with some way to go. The activities of coal and iron ore mining are moving ahead of other mining activities, including LNG.
The Financial and insurance services has long been a strong source of productivity growth, particularly in multi-factor productivity. But its performance has varied significantly in recent years. The Update provides early comment seeking to explain this variability, much of which can be attributed to big swings in the Insurance, superannuation and auxiliary services component.
Download the infographic
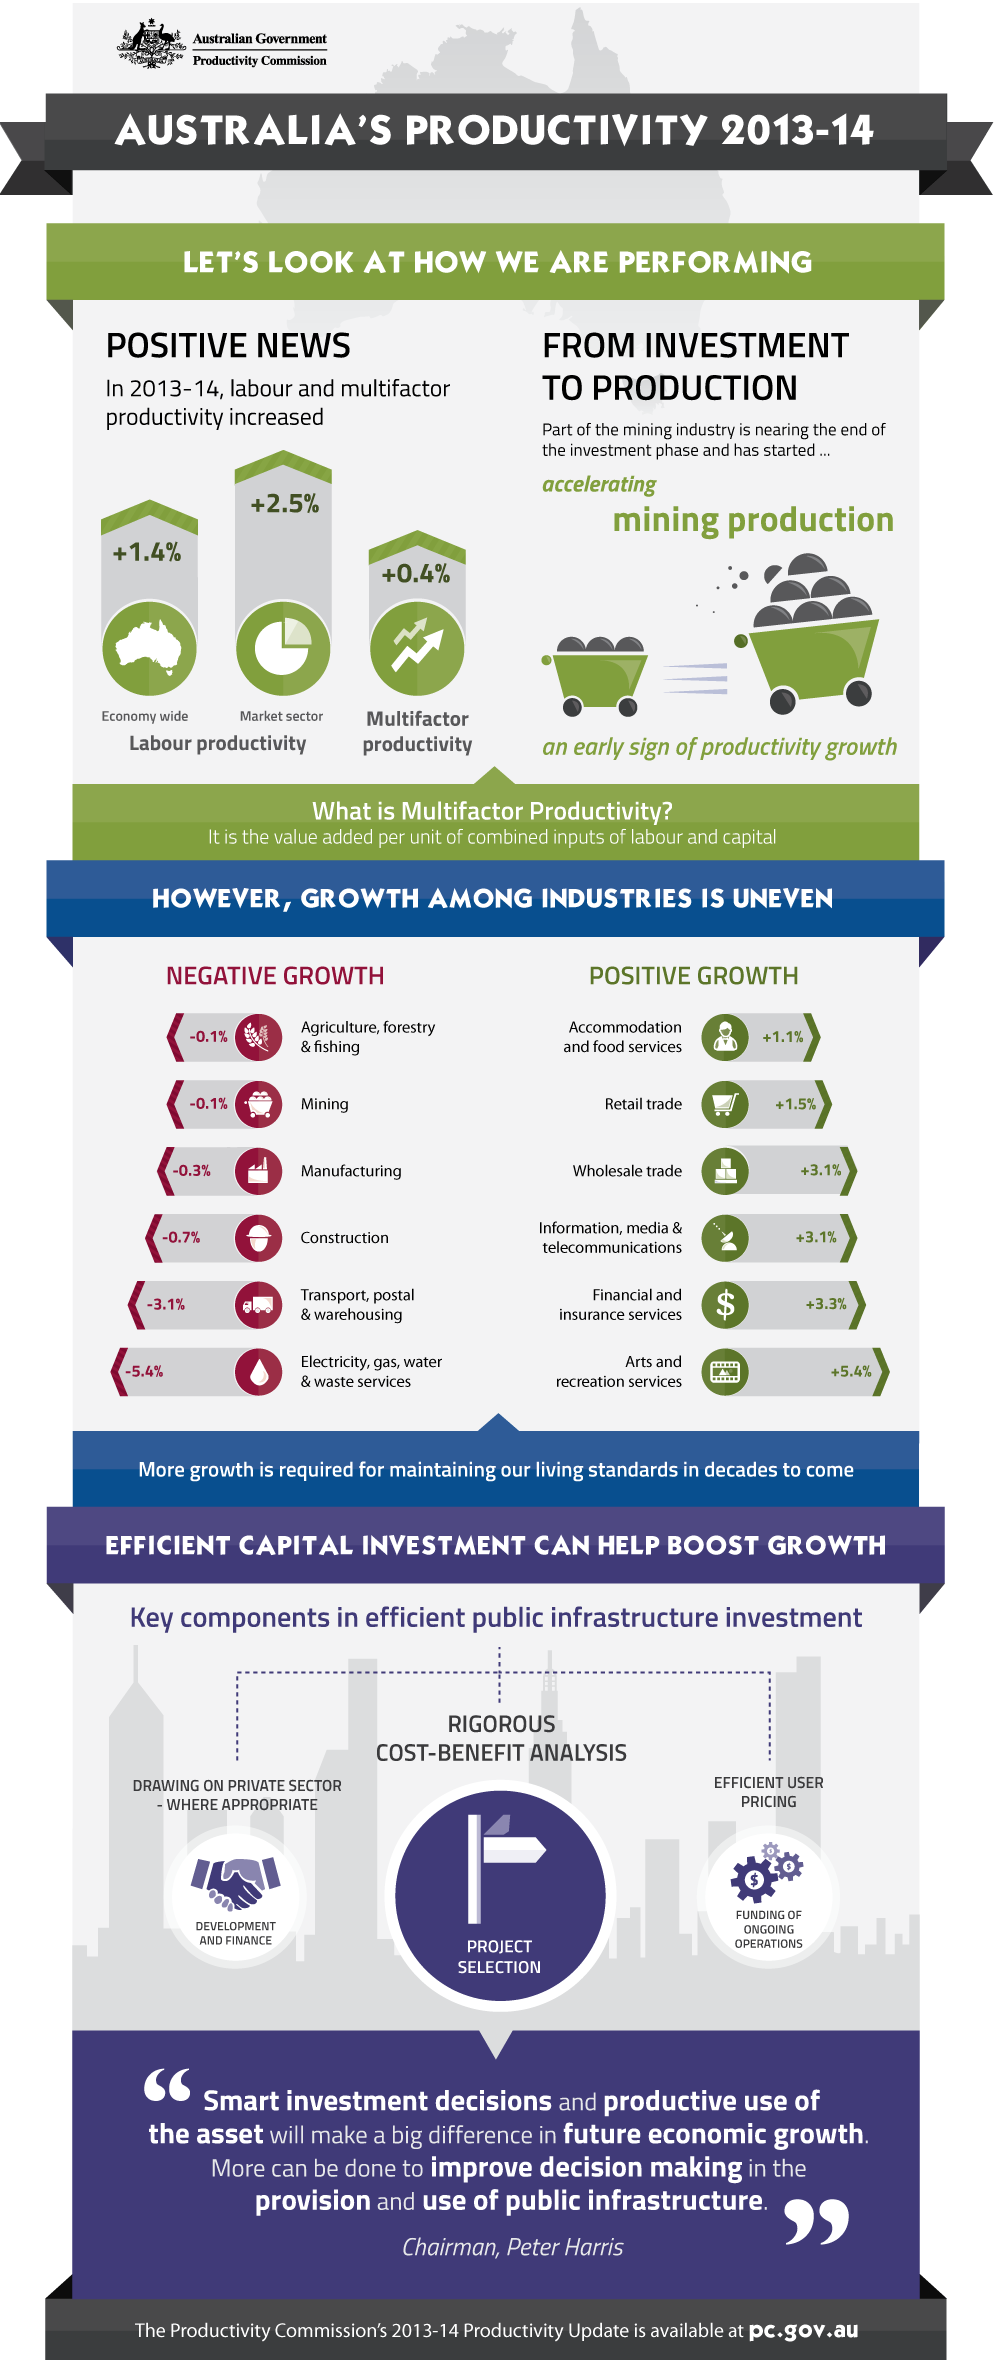
Australia's Productivity 2013-14 (Text version of the infographic)
Let's look at how we are performing
Positive news
In 2013-14, labour and multifactor productivity increased.
- Economy wide labour productivity up 1.4%
- Market sector labour productivity up 2.5%
- Multifactor productivity up 0.4%
From investment to production
Part of the mining industry is nearing the end of the investment phase and has started accelerating mining production. An early sign of productivity growth.
What is Multifactor Productivity?
It is the value added per unit of combined inputs of labour and capital.
However, Growth among industries is uneven
| Agriculture, forestry and fishing | -0.1 |
|---|---|
| Mining | -0.1 |
| Manufacturing | -0.3 |
| Construction | -0.7 |
| Transport, postal and warehousing | -3.1 |
| Electricity, gas, water and waste services | -5.4 |
| Accommodation and food services | +1.1 |
|---|---|
| Retail trade | +1.5 |
| Wholesale trade | +3.1 |
| Information, media and telecommunications | +3.1 |
| Financial and insurance services | +3.3 |
| Arts and recreation services | +5.4 |
More growth is required for maintaining our living standards in decades to come.
Efficient capital investment can help boost growth
Key components in efficient public infrastructure investment
- Project selection: Rigorous cost-benefit analysis
- Development and finance: Drawing on private sector - where appropriate
- Funding of ongoing operations: Efficient user pricing.
'Smart investment decisions and productive use of the asset will make a big difference in future economic growth. More can be done to improve decision making in the provision and use of public infrastructure.' Chairman Peter Harris.
More detail in the Update.