Report on Government Services 2015
Chapter 9, Volume D
Fire and ambulance services
The Fire and ambulance services chapter (chapter 9) of the Report on Government Services reports on the performance of governments in providing emergency management services provided in the event of fire and out of hospital medical emergency events.
Download the chapter
- Chapter 9 Fire and ambulance services, attachment tables, and data quality information (PDF - 3591 Kb)
- Chapter 9 Attachment tables (XLSX - 1258 Kb)
- Key Facts
- Indicator Framework
- Indicator Results
In this tab
Fire events
A fire event is an incident that is reported to a fire service organisation and requires a response. Fire events include (but are not limited to): structure fires (that is, fires inside a building or structure), regardless of whether there is damage to the structure; landscape fires, including bushfires and grass fires, regardless of the size of the area burnt; and other fires, including vehicle and other mobile property fires, and outside rubbish fires.
Nationally, fire service organisations attended a total of 384 017 emergency incidents in 2013-14, of which 101 867 were fire event incidents.
Performance reporting for fire events includes information on fire service organisations as the primary agencies involved in providing emergency management services for fire events.
Nationally in 2013-14, the total expenditure of fire service organisations was $3.7 billion, or $158 per person in the population.
Nationally, 19 198 full time equivalent (FTE) paid personnel were employed by fire service organisations in 2013-14, of which 77.1 per cent were paid firefighters. A large number of volunteer firefighters (223 727 people) also participated in the delivery of fire services in 2013-14.
The objective of government involvement in fire events is to build fire resilient communities that work together to understand and manage the fire risks that they confront.
Emergency management services provide highly effective, efficient and accessible services that:
- reduce the adverse effects of fire events on the community (including people, property, infrastructure, economy and environment)
- contribute to the management of fire risks to the community
- enhance public safety.
Ambulance events
Ambulance events are incidents that result in demand for ambulance services. Ambulance services include preparing for, providing and enhancing: emergency and non-emergency pre-hospital and out-of-hospital patient care and transport; inter-hospital patient transport; specialised rescue services; ambulance services to multi-casualty events; and capacity building for emergencies. Nationally, in 2013-14, there were 3.1 million incidents resulting in 4.2 million ambulance service responses to attend to 3.2 million patients.
Performance reporting for ambulance events includes information on ambulance service organisations as the primary agencies involved in providing services for ambulance events. Recurrent expenditure across Australia was approximately $2.7 billion (or $114 per person) in 2013-14. Nationally, there were 15 503 full time equivalent paid personnel, 5972 volunteers and 2456 community first responders in ambulance service organisations in 2013-14. (Community first responders are trained volunteers that provide an emergency response (with no transport capacity) and first aid care before ambulance arrival.)
The objectives of government involvement in ambulance service to provide pre-hospital and out-of-hospital care and patient transport services, that:
- are high quality, timely, and meet clients' needs through delivery of coordinated and responsive health care
- are equitable and accessible
- are effectively, efficiently and sustainably delivered
- reduce the adverse effects of emergency events on the community by providing specialised medical care in emergency situations.
In this tab
Fire events
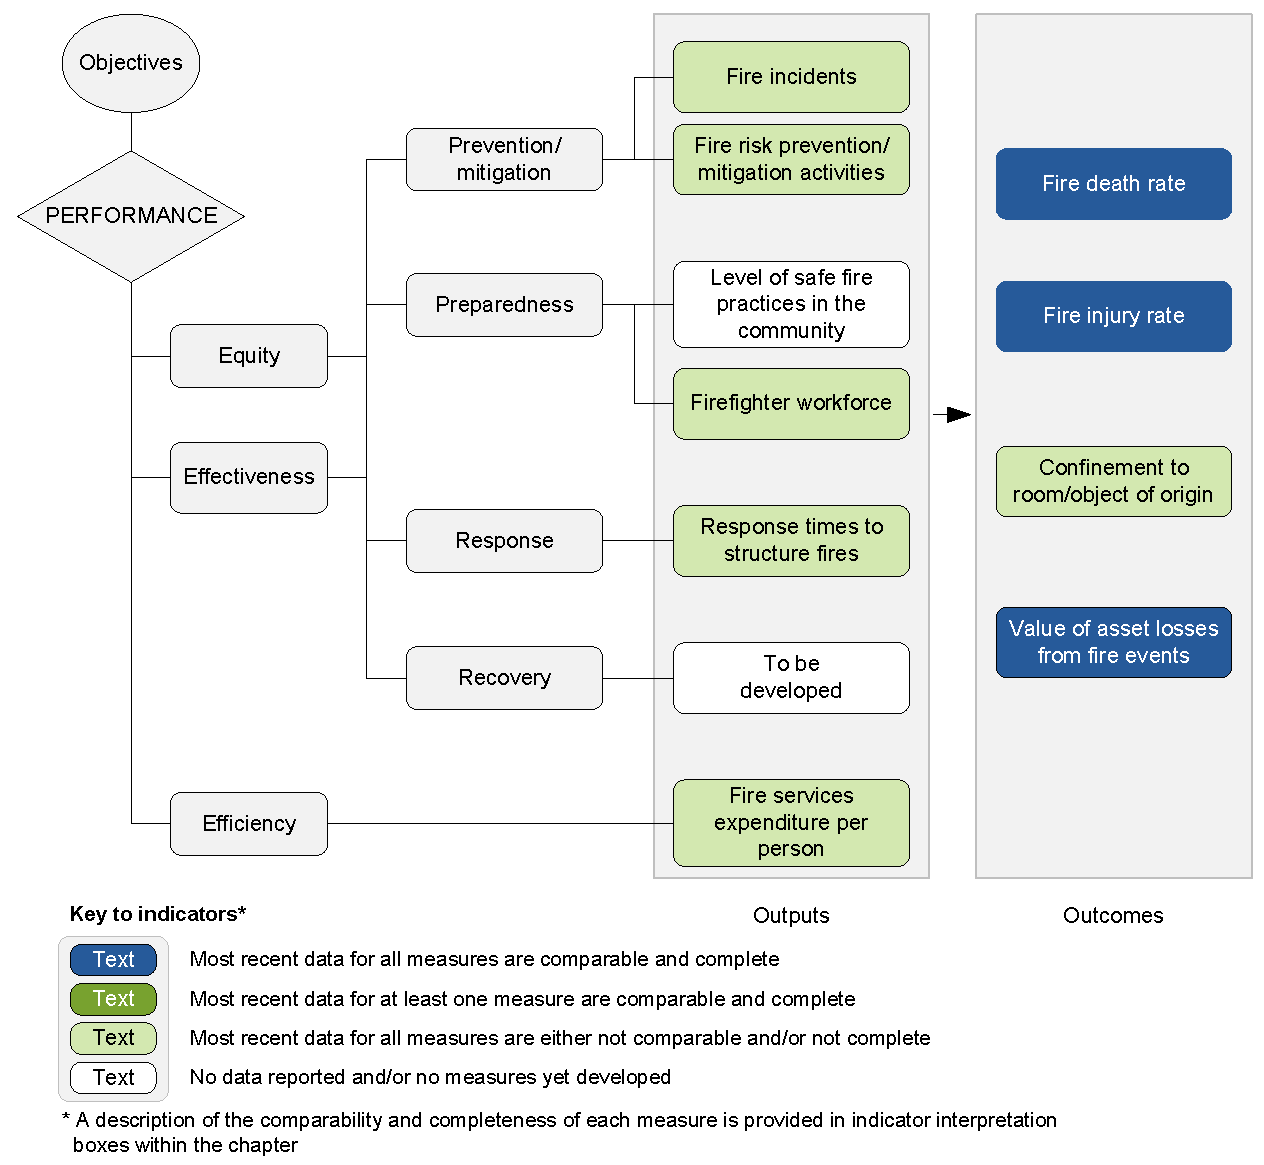
The performance indicator framework provides information on equity, efficiency and effectiveness, and distinguishes the outputs and outcomes of emergency services for fire events. The performance indicator framework shows which data are complete and comparable in the 2015 Report.
Ambulance events
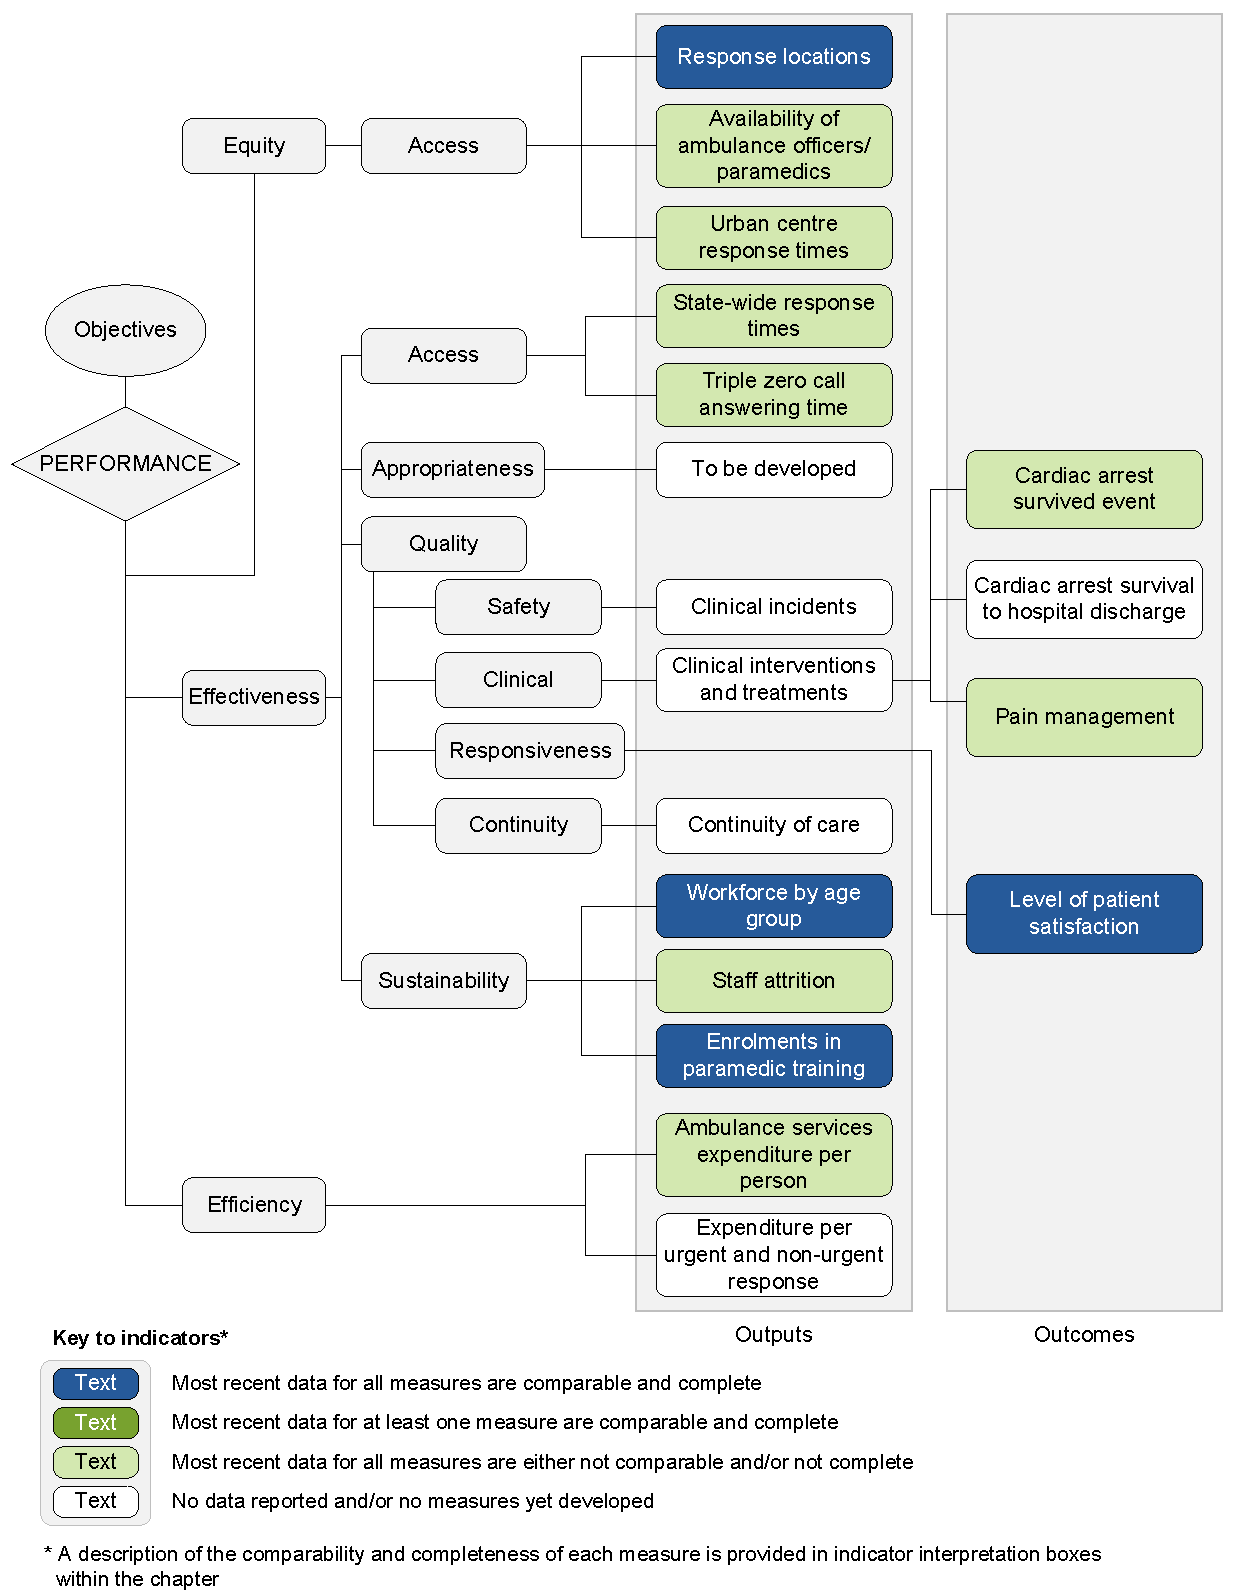
The performance indicator framework provides information on equity, efficiency and effectiveness, and distinguishes the outputs and outcomes of ambulance services. The performance indicator framework shows which data are complete and comparable in the 2015 Report.
In this tab
Fire events
An overview of the Fire events performance indicator results are presented. Information to assist the interpretation of these data can be found in the indicator interpretation boxes in the Fire and ambulance services chapter and attachment tables.
Equity and Effectiveness — Prevention/mitigation indicators
Fire incidents
Most recent data for this measure are complete but are not comparable (chapter 9).
| NSW | Vic | Qld | WA | SA | Tas | ACT | NT | Aust | |
|---|---|---|---|---|---|---|---|---|---|
| No. | 457 | 374 | 442 | 431 | 444 | 728 | 228 | 946 | 437 |
Fire risk prevention/mitigation activities
Most recent data for this measure are complete but are not comparable (chapter 9).
| NSW | Vic | Qld | WA | SA | Tas | ACT | NT | Aust | |
|---|---|---|---|---|---|---|---|---|---|
| No. | 96.2 | 121.1 | 45.0 | 62.8 | 73.8 | 125.7 | 85.9 | 58.0 | 86.9 |
Most recent data for this measure are incomplete but are not comparable (chapter 9).
| NSW | Vic | Qld | WA | SA | Tas | ACT | NT | Aust | |
|---|---|---|---|---|---|---|---|---|---|
| % | 94.1 | 97.2 | 96.6 | 94.0 | na | na | na | na | na |
Equity and Effectiveness — Preparedness
Firefighter workforce
Most recent data for this measure are complete but are not comparable (chapter 9).
| NSW | Vic | Qld | WA | SA | Tas | ACT | NT | Aust | |
|---|---|---|---|---|---|---|---|---|---|
| No. | 52.8 | 95.5 | 52.1 | 43.9 | 53.1 | 57.4 | 93.5 | 95.2 | 63.5 |
Equity and Effectiveness — Response
Response times to structure fires
Most recent data for this measure are incomplete and are not comparable (chapter 9).
| NSW | Vic | Qld | WA | SA | Tas | ACT | NT | Aust | |
|---|---|---|---|---|---|---|---|---|---|
| Min. | 15.4 | 10.9 | 12.4 | 14.1 | na | 19.6 | 10.4 | 18.0 | na |
Source: Attachment table 9A.26.
Most recent data for this measure are comparable and complete (chapter 9).
| NSW | Vic | Qld | WA | SA | Tas | ACT | NT | Aust | |
|---|---|---|---|---|---|---|---|---|---|
| Min. | 14.4 | 9.5 | 11.5 | 12.8 | 14.0 | 17.9 | 8.9 | 10.8 | na |
Source: Attachment table 9A.27.
Efficiency indicators
Fire services expenditure per person
Most recent data for this measure are complete but are not comparable (chapter 9).
| NSW | Vic | Qld | WA | SA | Tas | ACT | NT | Aust | |
|---|---|---|---|---|---|---|---|---|---|
| $ | 144.33 | 219.30 | 120.34 | 141.74 | 131.11 | 154.27 | 197.94 | 169.98 | 158.23 |
Outcome indicators
Fire death rate
Most recent data for this measure are comparable and complete (chapter 9).
| NSW | Vic | Qld | WA | SA | Tas | ACT | NT | Aust | |
|---|---|---|---|---|---|---|---|---|---|
| No. | 4.4 | 3.7 | 3.3 | 7.8 | 6.0 | 7.8 | – | 42.6 | 4.3 |
Source: Attachment table 9A.6.
Fire injury rate
Most recent data for this measure are comparable and complete (chapter 9).
| NSW | Vic | Qld | WA | SA | Tas | ACT | NT | Aust | |
|---|---|---|---|---|---|---|---|---|---|
| No. | 15.8 | 11.3 | 21.9 | 22.2 | 24.8 | 16.2 | 9.5 | 92.5 | 18.0 |
Confinement to room/object of origin
Most recent data for this measure are complete but are not comparable (chapter 9).
| NSW | Vic | Qld | WA | SA | Tas | ACT | NT | Aust | |
|---|---|---|---|---|---|---|---|---|---|
| % | 63.2 | 73.5 | 69.0 | 66.1 | 66.1 | 59.9 | 80.3 | 81.8 | na |
Source: Attachment table 9A.9.
| NSW | Vic | Qld | WA | SA | Tas | ACT | NT | Aust | |
|---|---|---|---|---|---|---|---|---|---|
| % | 76.9 | 94.9 | 84.0 | 74.6 | 72.6 | 71.6 | 89.2 | 81.8 | na |
Source: Attachment table 9A.11.
Value of property losses from fire events
Most recent data for this measure are comparable and complete (chapter 9).
| NSW | Vic | Qld | WA | SA | Tas | ACT | NT | Aust | |
|---|---|---|---|---|---|---|---|---|---|
| $ | 20.29 | 23.45 | 13.61 | 10.88 | 14.15 | 52.54 | 11.36 | 12.17 | 18.74 |
Ambulance events
An overview of the Ambulance events performance indicator results are presented. Information to assist the interpretation of these data can be found in the indicator interpretation boxes in the Fire and ambulance services chapter and attachment tables.
Equity — Access indicators
Response locations
Most recent data for this measure are comparable and complete (chapter 9).
| NSW | Vic | Qld | WA | SA | Tas | ACT | NT | Aust | |
|---|---|---|---|---|---|---|---|---|---|
| No. | 3.3 | 4.5 | 5.6 | 7.4 | 6.6 | 9.5 | 2.1 | 3.7 | 4.9 |
Availability of ambulance officers/paramedics
Most recent data for this measure are complete but are not comparable (chapter 9).
| NSW | Vic | Qld | WA | SA | Tas | ACT | NT | Aust | |
|---|---|---|---|---|---|---|---|---|---|
| No. | 42.7 | 50.5 | 59.6 | 28.7 | 45.8 | 49.6 | 40.7 | 36.7 | 46.8 |
Urban centre response times
Most recent data for this measure are complete but are not comparable (chapter 9).
| NSW | Vic | Qld | WA | SA | Tas | ACT | NT | Aust | |
|---|---|---|---|---|---|---|---|---|---|
| Min. | 19.8 | 19.2 | 14.7 | 13.9 | 14.5 | 16.8 | 12.9 | 17.4 | na |
Source: Attachment table 9A.44.
Effectiveness — Access indicators
State-wide response times
Most recent data for this measure are complete but are not comparable (chapter 9).
| NSW | Vic | Qld | WA | SA | Tas | ACT | NT | Aust | |
|---|---|---|---|---|---|---|---|---|---|
| Min. | 22.2 | 22.4 | 16.3 | 16.1 | 16.6 | 23.7 | 12.9 | 17.1 | na |
Source: Attachment table 9A.44.
Triple zero call answering time
Most recent data for this measure are complete but are not comparable (chapter 9).
| NSW | Vic | Qld | WA | SA | Tas | ACT | NT | Aust | |
|---|---|---|---|---|---|---|---|---|---|
| % | 88.5 | 92.1 | 90.7 | 94.1 | 91.3 | 96.2 | 96.0 | 9.0 | 89.4 |
Effectiveness — Sustainability indicators
Workforce by age group
Most recent data for this measure are complete but are not comparable (chapter 9).
| NSW | Vic | Qld | WA | SA | Tas | ACT | NT | Aust | |
|---|---|---|---|---|---|---|---|---|---|
| % | 77.4 | 78.1 | 79.2 | 85.7 | 77.2 | 70.8 | 79.9 | 84.3 | 78.6 |
Staff attrition
Most recent data for this measure are complete but are not comparable (chapter 9).
| NSW | Vic | Qld | WA | SA | Tas | ACT | NT | Aust | |
|---|---|---|---|---|---|---|---|---|---|
| % | 3.9 | 4.2 | 3.9 | 2.2 | 1.7 | 2.5 | 1.6 | – | 3.6 |
Source: Attachment table 9A.36.
Enrolments in paramedic training
Most recent data for this measure are comparable and complete (chapter 9).
| NSW | Vic | Qld | WA | SA | Tas | ACT | NT | Aust | |
|---|---|---|---|---|---|---|---|---|---|
| No. | 99.4 | 356.1 | 385.5 | 266.6 | 249.6 | 194.9 | 281.7 | .. | 253.8 |
Source: Attachment table 9A.37.
Efficiency indicators
Ambulance services expenditure per person
Most recent data for this measure are complete but are not comparable (chapter 9).
| NSW | Vic | Qld | WA | SA | Tas | ACT | NT | Aust | |
|---|---|---|---|---|---|---|---|---|---|
| $ | 109.78 | 114.63 | 124.21 | 83.81 | 143.95 | 127.60 | 113.80 | 106.12 | 113.90 |
Outcome indicators
Cardiac arrest survived event
Most recent data for this measure are complete but are not comparable (chapter 9).
| NSW | Vic | Qld | WA | SA | Tas | ACT | NT | Aust | |
|---|---|---|---|---|---|---|---|---|---|
| % | 29.7 | 29.4 | 26.1 | 23.2 | 18.8 | 33.8 | 29.6 | 28.6 | 28.1 |
Pain management
Most recent data for this measure are complete but are not comparable (chapter 9).
| NSW | Vic | Qld | WA | SA | Tas | ACT | NT | Aust | |
|---|---|---|---|---|---|---|---|---|---|
| % | 86.8 | 90.8 | 89.0 | 83.3 | 75.5 | 87.2 | 88.5 | na | 87.7 |
Source: Attachment table 9A.42.
Level of patient satisfaction
Most recent data for this measure are comparable and complete (chapter 9).
| NSW | Vic | Qld | WA | SA | Tas | ACT | NT | Aust | |
|---|---|---|---|---|---|---|---|---|---|
| % | 96 ±1.8 | 97 ±1.6 | 99 ±0.9 | 99 ±1.0 | 98 ±1.2 | 98 ±1.0 | 98 ±1.4 | 97 ±3.0 | 98 ±0.5 |
Some results reported here include 95 per cent confidence intervals (for example, 80 per cent ± 2.7 per cent).