Report on Government Services 2015
Chapter 10, Volume E
Primary and community health
The Primary and community health chapter (chapter 10) of the Report on Government Services reports on primary and community healthcare services, with a particular focus on general practice, primary healthcare services for Aboriginal and Torres Strait Islander people, public dental services, drug and alcohol treatment, maternal and child health, the Pharmaceutical Benefits Scheme (PBS) and a range of other community health services.
The primary and community health sector is the part of the healthcare system most frequently used by Australians. It is important in preventative healthcare as well as in the detection and management of illness and injury — through direct service provision and through referral to acute (hospital) or other healthcare services, as appropriate.
Download the chapter
- Chapter 10 Primary and community health, attachment tables, and data quality information (PDF - 3616 Kb)
- Chapter 10 Attachment tables (XLSX - 1468 Kb)
- Key Facts
- Indicator Framework
- Indicator Results
Total expenditure by all governments on primary and community health, including public health, was around $30.2 billion in 2012-13.
Australian Government expenditure on general practice in Australia was $7.9 billion in 2013-14. Of this, $7.3 billion, or $299 per person, comprised fee-for-service expenditure.
Australian Government expenditure on the PBS was around $7.3 billion, or $313 per person, in 2013-14.
Primary and community health services aim to support and improve the health of Australians by:
- providing a universally accessible point of entry to the healthcare system
- promoting health and preventing illness
- providing timely and high quality healthcare that meets individual needs, throughout the lifespan — directly, and/or by facilitating access to the appropriate service(s)
- coordinating service provision to ensure continuity of care where more than one service type, and/or ongoing service provision, is required to meet individuals’ healthcare needs
- ensuring that primary and community health service interventions are based on best practice evidence and delivered in an equitable and efficient manner.
The performance indicator framework provides information on equity, efficiency and effectiveness, and distinguishes the outputs and outcomes of health services. The performance indicator framework shows which data are complete and comparable in the 2015 Report.
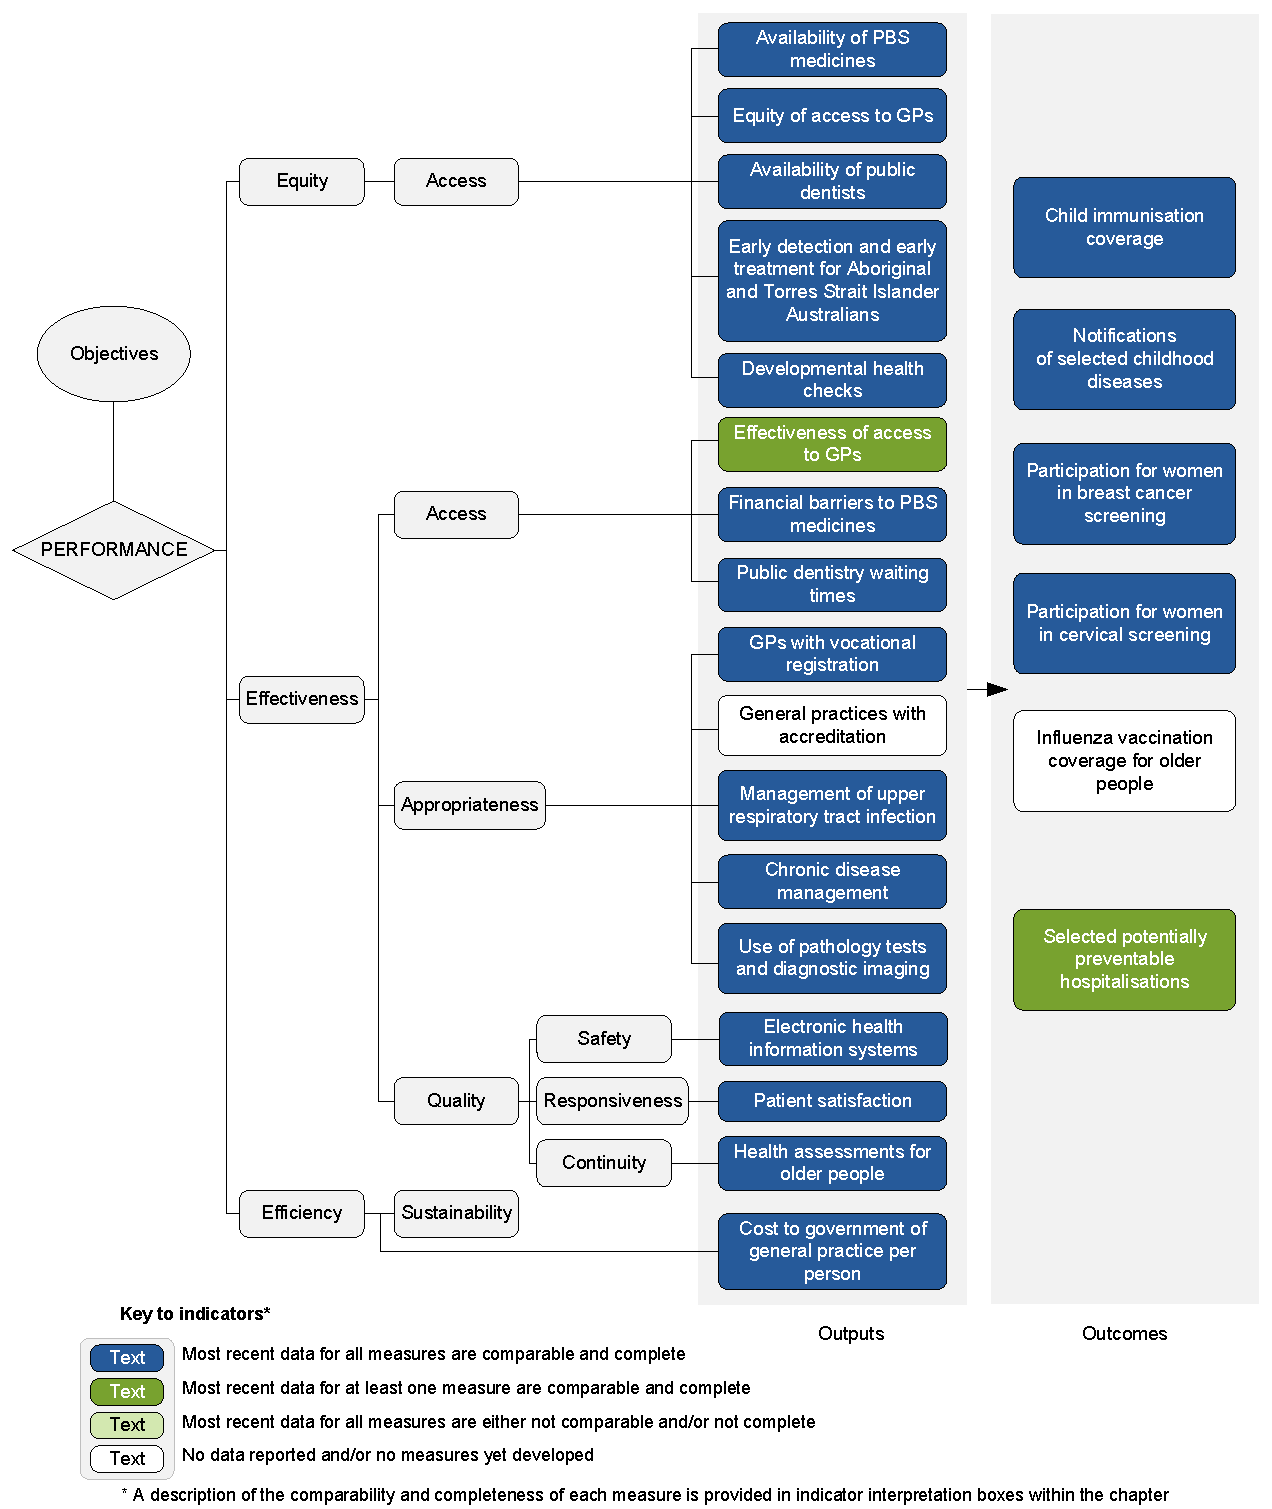
An overview of the Primary and community health performance indicator results are presented. Information to assist the interpretation of these data can be found in the indicator interpretation boxes in the Primary and community health chapter and attachment tables.
Equity — Access indicators
Availability of Pharmaceutical Benefits Scheme (PBS) medicines
Most recent data for this indicator are comparable and complete, subject to caveats (chapter 10).
| NSW | Vic | Qld | WA | SA | Tas | ACT | NT | Aust | |
|---|---|---|---|---|---|---|---|---|---|
| % | 89.7 | 89.9 | 89.1 | 85.6 | 90.8 | 92.2 | 79.2 | 79.7 | 89.3 |
Equity of access to general practitioners (GPs)
Most recent data for this indicator are comparable and complete, subject to caveats (chapter 10).
| NSW | Vic | Qld | WA | SA | Tas | ACT | NT | Aust | |
|---|---|---|---|---|---|---|---|---|---|
| Major cities, rate | 109.1 | 101.7 | 107.4 | 78.6 | 107.6 | .. | 72.5 | .. | 102.2 |
| Outer regional, rate | 84.3 | 96.7 | 97.9 | 84.0 | 102.1 | 82.8 | .. | 78.9 | 91.4 |
Source: Attachment tables 10A.11-10A.32.
| NSW | Vic | Qld | WA | SA | Tas | ACT | NT | Aust | |
|---|---|---|---|---|---|---|---|---|---|
| Rate | 72.1 | 66.1 | 69.4 | 49.6 | 60.0 | 66.4 | 61.0 | 62.7 | 66.3 |
| NSW | Vic | Qld | WA | SA | Tas | ACT | NT | Aust | |
|---|---|---|---|---|---|---|---|---|---|
| Rate | 140.8 | 135.9 | 136.3 | 102.9 | 148.1 | 119.1 | 83.2 | 81.0 | 132.9 |
Availability of public dentists
Most recent data for this indicator are comparable and complete, subject to caveats (chapter 10).
| NSW | Vic | Qld | WA | SA | Tas | ACT | NT | Aust | |
|---|---|---|---|---|---|---|---|---|---|
| Rate | 6.6 | 6.2 | 8.5 | 7.2 | 8.3 | 5.9 | 5.0 | 10.0 | 7.1 |
Early detection and early treatment for Aboriginal and Torres Strait Islander Australians
Most recent data for this indicator are comparable and complete, subject to caveats (chapter 10).
| NSW | Vic | Qld | WA | SA | Tas | ACT | NT | Aust | |
|---|---|---|---|---|---|---|---|---|---|
| % | 28.1 | 17.4 | 37.5 | 32.7 | 20.8 | 12.9 | 20.4 | 39.8 | 30.4 |
Developmental health checks
Most recent data for this indicator are comparable and complete, subject to caveats (chapter 10).
| NSW | Vic | Qld | WA | SA | Tas | ACT | NT | Aust | |
|---|---|---|---|---|---|---|---|---|---|
| % | 64.8 | 27.5 | 78.1 | 49.7 | 52.5 | 56.8 | 41.4 | 69.9 | 55.6 |
Effectiveness — Access indicators
Effectiveness of access to GPs
Most recent data for this indicator are comparable and complete (subject to caveats) for some but not all measures (chapter 10).
| NSW | Vic | Qld | WA | SA | Tas | ACT | NT | Aust | |
|---|---|---|---|---|---|---|---|---|---|
| % | 87.9 | 83.2 | 83.1 | 75.7 | 82.2 | 77.7 | 57.2 | 82.8 | 83.6 |
| NSW | Vic | Qld | WA | SA | Tas | ACT | NT | Aust | |
|---|---|---|---|---|---|---|---|---|---|
| % | 64.7 | 63.4 | 65.4 | 65.2 | 64.7 | 51.8 | 58.3 | 78.4 | 64.2 |
| NSW | Vic | Qld | WA | SA | Tas | ACT | NT | Aust | |
|---|---|---|---|---|---|---|---|---|---|
| % | 3.5 | 5.0 | 5.8 | 6.2 | 4.5 | 6.9 | 6.9 | 5.6 | 4.9 |
| NSW | Vic | Qld | WA | SA | Tas | ACT | NT | Aust | |
|---|---|---|---|---|---|---|---|---|---|
| '000 | 709.3 | 572.4 | 381.4 | 272.9 | 113.4 | 61.2 | 50.5 | 39.3 | 2200.4 |
Financial barriers to PBS medicines
Most recent data for this indicator are comparable and complete, subject to caveats (chapter 10).
| NSW | Vic | Qld | WA | SA | Tas | ACT | NT | Aust | |
|---|---|---|---|---|---|---|---|---|---|
| % | 7.0 | 6.3 | 9.9 | 8.4 | 7.5 | 8.0 | 6.7 | 6.2 | 7.6 |
Public dentistry waiting times
Most recent data for this indicator are comparable and complete, subject to caveats (chapter 10).
| NSW | Vic | Qld | WA | SA | Tas | ACT | NT | Aust | |
|---|---|---|---|---|---|---|---|---|---|
| % | 27.6 | 17.8 | 27.2 | 19.7 | 18.4 | 26.2 | 32.5 | 24.4 | 23.4 |
Effectiveness — Appropriateness indicators
GPs with vocational registration
Most recent data for this indicator are comparable and complete, subject to caveats (chapter 10).
| NSW | Vic | Qld | WA | SA | Tas | ACT | NT | Aust | |
|---|---|---|---|---|---|---|---|---|---|
| % | 90.6 | 85.5 | 88.0 | 89.5 | 89.5 | 90.8 | 91.8 | 69.8 | 88.5 |
Management of upper respiratory tract infections
Most recent data for this indicator are comparable and complete, subject to caveats (chapter 10).
| NSW | Vic | Qld | WA | SA | Tas | ACT | NT | Aust | |
|---|---|---|---|---|---|---|---|---|---|
| Rate | 319.1 | 324.8 | 292.3 | 187.8 | 310.0 | 314.9 | 175.5 | 92.2 | 295.2 |
| NSW | Vic | Qld | WA | SA | Tas | ACT | NT | Aust | |
|---|---|---|---|---|---|---|---|---|---|
| % | 33.0 | 27.4 | 33.1 | 25.6 | 26.7 | 26.3 | 25.7 | 20.9 | 30.5 |
Chronic disease management
Most recent data for this indicator are comparable and complete, subject to caveats (chapter 10).
| NSW | Vic | Qld | WA | SA | Tas | ACT | NT | Aust | |
|---|---|---|---|---|---|---|---|---|---|
| % | 48.6 | 42.1 | 54.3 | 47.8 | 35.4 | 36.4 | 57.7 | 72.7 | 47.3 |
| NSW | Vic | Qld | WA | SA | Tas | ACT | NT | Aust | |
|---|---|---|---|---|---|---|---|---|---|
| % | 26.6 | 25.3 | 18.4 | 24.5 | 29.3 | 22.6 | 24.3 | 33.7 | 24.6 |
Use of pathology tests and diagnostic imaging
Most recent data for this indicator are comparable and complete, subject to caveats (chapter 10).
| NSW | Vic | Qld | WA | SA | Tas | ACT | NT | Aust | |
|---|---|---|---|---|---|---|---|---|---|
| $ per person | 72.9 | 58.2 | 69.8 | 51.5 | 53.4 | 53.6 | 51.1 | 42.9 | 63.8 |
Effectiveness — Quality — Safety indicators
Electronic health information systems
Most recent data for this indicator are comparable and complete, subject to caveats (chapter 10).
| NSW | Vic | Qld | WA | SA | Tas | ACT | NT | Aust | |
|---|---|---|---|---|---|---|---|---|---|
| % | 85.7 | 89.0 | 86.0 | 83.0 | 86.7 | 86.0 | 84.5 | 78.2 | 86.3 |
Effectiveness — Quality — Responsiveness indicators
Patient satisfaction
Most recent data for this indicator are comparable and complete, subject to caveats (chapter 10).
| NSW | Vic | Qld | WA | SA | Tas | ACT | NT | Aust | |
|---|---|---|---|---|---|---|---|---|---|
| GP (%) | 91.2 | 91.3 | 89.8 | 88.6 | 90.9 | 91.3 | 89.1 | 84.8 | 90.6 |
| Dental
Practitioner (%) |
94.8 | 94.5 | 92.9 | 96.5 | 96.5 | 93.7 | 95.4 | 94.5 | 94.6 |
Effectiveness — Quality — Continuity indicators
Health assessments for older people
Most recent data for this indicator are comparable and complete, subject to caveats (chapter 10).
| NSW | Vic | Qld | WA | SA | Tas | ACT | NT | Aust | |
|---|---|---|---|---|---|---|---|---|---|
| % | 30.52 | 28.84 | 35.69 | 30.75 | 30.20 | 34.28 | 23.21 | 31.60 | 31.06 |
Efficiency indicators
Cost to government of general practice per person
Most recent data for this indicator are comparable and complete, subject to caveats (chapter 10).
| NSW | Vic | Qld | WA | SA | Tas | ACT | NT | Aust | |
|---|---|---|---|---|---|---|---|---|---|
| $ per person | 314.8 | 301.2 | 314.2 | 238.6 | 295.6 | 272.5 | 230.7 | 241.4 | 298.6 |
Outcome indicators
Child immunisation coverage
Most recent data for this indicator are comparable and complete, subject to caveats (chapter 10).
| NSW | Vic | Qld | WA | SA | Tas | ACT | NT | Aust | |
|---|---|---|---|---|---|---|---|---|---|
| % | 92.2 | 92.5 | 92.3 | 89.8 | 91.0 | 92.7 | 92.7 | 91.4 | 92.0 |
Notifications of selected childhood diseases
Most recent data for this indicator are comparable and complete, subject to caveats (chapter 10).
| NSW | Vic | Qld | WA | SA | Tas | ACT | NT | Aust | |
|---|---|---|---|---|---|---|---|---|---|
| Rate | 2.1 | 2.5 | 2.2 | 2.1 | 3.4 | – | – | 33.4 | 2.6 |
Source: Attachment tables 10A.77-10A.94.
Participation for women in breast cancer screening
Most recent data for this indicator are comparable and complete, subject to caveats (chapter 10).
| NSW | Vic | Qld | WA | SA | Tas | ACT | NT | Aust | |
|---|---|---|---|---|---|---|---|---|---|
| Rate | 50.9 | 54.6 | 57.3 | 56.8 | 53.0 | 57.8 | 54.4 | 41.0 | 54.3 |
Participation for women in cervical screening
Most recent data for this indicator are comparable and complete, subject to caveats (chapter 10).
| NSW | Vic | Qld | WA | SA | Tas | ACT | NT | Aust | |
|---|---|---|---|---|---|---|---|---|---|
| Rate | 57.4 | 61.6 | 56.4 | 55.9 | 59.0 | 57.4 | 58.0 | 55.1 | 58.2 |
Selected potentially preventable hospitalisations
Most recent data for this indicator are comparable and complete, subject to caveats, except for the measure potentially preventable hospitalisations for diabetes (chapter 10).
Separations for selected potentially preventable hospitalisations, 2012-13, per 1000 people.
| NSW | Vic | Qld | WA | SA | Tas | ACT | NT | Aust | |
|---|---|---|---|---|---|---|---|---|---|
| Rate | 0.7 | 0.8 | 1.1 | 1.0 | 1.1 | 1.0 | 0.8 | 3.7 | 0.9 |
| NSW | Vic | Qld | WA | SA | Tas | ACT | NT | Aust | |
|---|---|---|---|---|---|---|---|---|---|
| Rate | 10.8 | 10.2 | 13.8 | 13.6 | 13.6 | 9.9 | 9.3 | 20.5 | 11.8 |
| NSW | Vic | Qld | WA | SA | Tas | ACT | NT | Aust | |
|---|---|---|---|---|---|---|---|---|---|
| Rate | 10.4 | 10.8 | 12.9 | 11.3 | 11.9 | 10.1 | 8.3 | 22.1 | 11.3 |