Report on Government Services 2016
Chapter 13, Volume F
Aged care services
The Aged care services chapter (chapter 13) reports on the performance of government funded services for older people, including assessment, residential care and community based services.
Download the chapter
- Chapter 13 Aged care services, attachment tables, and data quality information (PDF - 4726 Kb)
- Chapter 13 Attachment tables (XLSX - 1367 Kb)
- Key Facts
- Indicator Framework
- Indicator Results
- Indigenous Data
This chapter focuses on government funded care and support services for older people and their carers, which are provided at home and in residential care facilities.
Total government expenditure reported on aged care services in 2014-15 was $15.8 billion. This included expenditure of $4.1 billion on home care and support services and $10.8 billion on residential care services.
Home care and support services expenditure included expenditure of $2.3 billion on Home and Community Care (HACC) for older people (aged 65 years or over and Aboriginal and Torres Strait Islander Australians aged 50-64 years — except in Victoria and WA where it is for all people), with the Australian Government contributing $1.9 billion and the Victorian and WA governments contributing $385.5 million. Australian Government expenditure on Home Care levels 1-4 was a further $1.3 billion in 2014-15.
At June 2015, there were 73 550 operational places (including flexible places) in Home Care levels 1-4 and 195 953 operational places (including flexible places) in residential care services. During 2014-15, there were 86 302 older clients of Home Care levels 1-4 and 812 384 older clients of HACC. There were also 224 115 older clients who received permanent care and 51 411 who received respite care in a residential aged care facility during that period.
The aged care system aims to promote the wellbeing and independence of older people and their carers through the funding and delivery of care services that are: accessible, appropriate to needs, high quality, efficient and person-centred.
The performance indicator framework provides information on equity, efficiency and effectiveness, and distinguishes the outputs and outcomes of government aged care services. The performance indicator framework shows which data are complete and comparable in the 2016 Report.
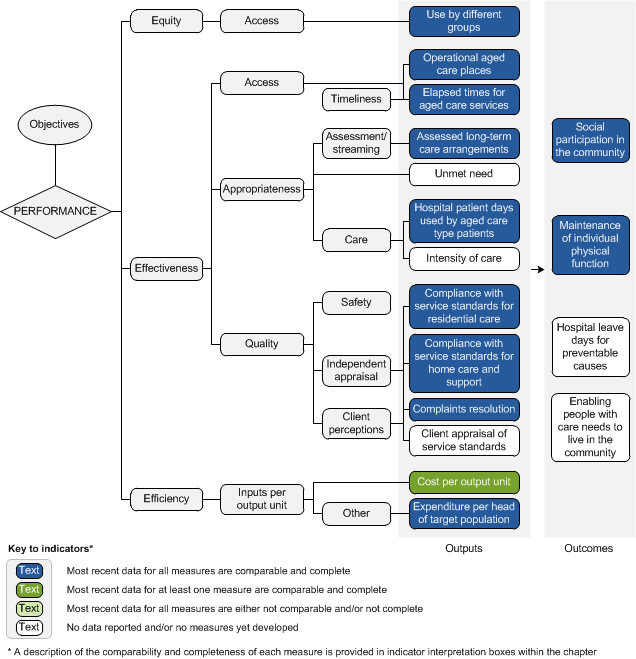
An overview of the Aged care services performance indicator results are presented. Information to assist the interpretation of these data can be found in the indicator interpretation boxes in the Aged care services chapter and attachment tables.
Equity — Access indicators
Use by different groups
Access to aged care services across special needs group — proportion of service clients who are Aboriginal and Torres Strait Islander people, compared with the proportion of the aged care target population who are Aboriginal and Torres Strait Islander people
Aged care target population, June 2015
| NSW | Vic | Qld | WA | SA | Tas | ACT | NT | Aust | |
|---|---|---|---|---|---|---|---|---|---|
| % | 2.9 | 0.8 | 4.0 | 3.9 | 2.0 | 4.5 | 1.7 | 43.2 | 2.9 |
Residential aged care, at 30 June 2015
| NSW | Vic | Qld | WA | SA | Tas | ACT | NT | Aust | |
|---|---|---|---|---|---|---|---|---|---|
| % | 0.7 | 0.3 | 1.6 | 2.2 | 1.2 | 0.6 | 0.4 | 53.8 | 1.1 |
Home care levels 1-2, at 30 June 2015
| NSW | Vic | Qld | WA | SA | Tas | ACT | NT | Aust | |
|---|---|---|---|---|---|---|---|---|---|
| % | 2.6 | 3.2 | 4.1 | 4.7 | 3.0 | 5.3 | 4.8 | 57.8 | 4.3 |
Home care levels 3-4, at 30 June 2015
| NSW | Vic | Qld | WA | SA | Tas | ACT | NT | Aust | |
|---|---|---|---|---|---|---|---|---|---|
| % | 1.4 | 1.5 | 1.3 | 1.6 | 1.0 | 1.2 | 0.6 | 22.6 | 1.6 |
HACC, 2014-15
| NSW | Vic | Qld | WA | SA | Tas | ACT | NT | Aust | |
|---|---|---|---|---|---|---|---|---|---|
| % | 4.0 | 1.0 | 3.2 | 3.2 | 2.2 | 1.9 | 1.0 | 54.7 | 2.9 |
Effectiveness — Access indicators
Operational aged care places
Total operational aged care places per 1000 people aged 70 years or over (excluding transition care), 2014-15
| NSW | Vic | Qld | WA | SA | Tas | ACT | NT | Aust | |
|---|---|---|---|---|---|---|---|---|---|
| No. | 111.2 | 112.3 | 107.5 | 109.1 | 119.1 | 108.7 | 113.6 | 195.5 | 111.5 |
Elapsed times for aged care services
Proportion of people entering residential aged care services who did so within 3 months of ACAT approval, 2014-15
| NSW | Vic | Qld | WA | SA | Tas | ACT | NT | Aust | |
|---|---|---|---|---|---|---|---|---|---|
| No. | 58.8 | 63.4 | 53.0 | 56.2 | 57.4 | 61.7 | 39.7 | 36.1 | 58.4 |
Effectiveness — Appropriateness indicators
Assessed long-term care arrangements
Proportion of clients recommended to remain in the community, 2013-14
| NSW | Vic | Qld | WA | SA | Tas | ACT | NT | Aust | |
|---|---|---|---|---|---|---|---|---|---|
| % | 51.4 | 62.2 | 42.3 | 50.7 | 40.9 | 64.2 | 67.8 | 74.3 | 52.7 |
Hospital patient days used by aged care type patients
Proportion of separations for 'aged care type' public hospitals patients that were 35 days or longer, 2013-14
| NSW | Vic | Qld | WA | SA | Tas | ACT | NT | Aust | |
|---|---|---|---|---|---|---|---|---|---|
| % | 6.7 | 29.7 | 13.0 | 15.5 | 13.7 | 13.7 | 28.7 | 58.5 | 11.5 |
Effectiveness — Quality indicators
Compliance with service standards for residential care
Proportion of all re-accredited residential aged care services that have been granted a re accreditation approval for a period of three years, as at 30 June 2015
| NSW | Vic | Qld | WA | SA | Tas | ACT | NT | Aust | |
|---|---|---|---|---|---|---|---|---|---|
| % | 97.6 | 98.5 | 95.2 | 98.3 | 98.0 | 100.0 | 100.0 | 83.3 | 97.6 |
Compliance with service standards for community care
Proportion of reviews that met all expected outcomes under each of the Standards (NRCP and Home Care services), 30 June 2015
Standard 1 — Effective management
| NSW | Vic | Qld | WA | SA | Tas | ACT | NT | Aust | |
|---|---|---|---|---|---|---|---|---|---|
| % | 82.1 | 93.2 | 82.7 | 80.6 | 100.0 | 86.7 | 100.0 | 76.9 | 86.0 |
Standard 2 — Appropriate access and service delivery
| NSW | Vic | Qld | WA | SA | Tas | ACT | NT | Aust | |
|---|---|---|---|---|---|---|---|---|---|
| % | 83.2 | 98.9 | 89.8 | 83.9 | 100.0 | 90.0 | 100.0 | 38.5 | 88.6 |
Standard 3 — Service user rights and responsibilities
| NSW | Vic | Qld | WA | SA | Tas | ACT | NT | Aust | |
|---|---|---|---|---|---|---|---|---|---|
| % | 95.8 | 100.0 | 99.0 | 90.3 | 100.0 | 100.0 | 100.0 | 84.6 | 97.4 |
Complaints resolution
Number of complaints received by the Complaints Scheme per 1000 permanent care recipients, 2014-15
| NSW | Vic | Qld | WA | SA | Tas | ACT | NT | Aust | |
|---|---|---|---|---|---|---|---|---|---|
| No. | 21.8 | 23.0 | 22.9 | 15.1 | 19.7 | 24.5 | 11.8 | 37.1 | 21.6 |
Efficiency indicators
Cost per output unit
Australian Government expenditure on aged care assessments, per assessment, 2013-14
| NSW | Vic | Qld | WA | SA | Tas | ACT | NT | Aust | |
|---|---|---|---|---|---|---|---|---|---|
| $ | 542 | 446 | 592 | 595 | 657 | 512 | 475 | 1244 | 537 |
Expenditure per head of target population
Australian Government (DoHA and DVA) real expenditure on residential services per person aged 65 years or over and Aboriginal and Torres Strait Islander Australians aged 50-64 years (including payroll tax), 2014-15
| NSW | Vic | Qld | WA | SA | Tas | ACT | NT | Aust | |
|---|---|---|---|---|---|---|---|---|---|
| $ | 2928 | 3175 | 2812 | 2606 | 3399 | 2788 | 2303 | 1339 | 2951 |
Outcome indicators
Social participation in the community
Proportion of older people aged 65 years or over who did not leave home or did not leave home as often as they would like, 2012 - With profound or severe disability
| NSW | Vic | Qld | WA | SA | Tas | ACT | NT | Aust | |
|---|---|---|---|---|---|---|---|---|---|
| % | 49.3±4.7 | 44.9±5.7 | 49.8±6.9 | 39.2±9.7 | 45.2±9.1 | 40.6±9.0 | 42.6±11.2 | 56.3±23.3 | 46.8±2.5 |
Proportion of older people aged 65 years or over who did not leave home or did not leave home as often as they would like, 2012 - Without disability.
| NSW | Vic | Qld | WA | SA | Tas | ACT | NT | Aust | |
|---|---|---|---|---|---|---|---|---|---|
| % | 5.2±1.5 | 6.6±1.8 | 9.2±2.3 | 4.7±2.1 | 4.5±1.7 | 10.4±3.7 | 4.4±3.3 | 6.3±5.4 | 6.4±0.7 |
Maintenance of individual physical function
Improvement in Transition Care Program (TCP) client's level of functioning, reflected in the movement from the average Modified Barthel Index (MBI) score on entry to the average MBI score on exit, 2014-15.
Average MBI on entry
| NSW | Vic | Qld | WA | SA | Tas | ACT | NT | Aust | |
|---|---|---|---|---|---|---|---|---|---|
| No. | 80 | 64 | 73 | 58 | 68 | 66 | 86 | 84 | 71 |
Average MBI on exit
| NSW | Vic | Qld | WA | SA | Tas | ACT | NT | Aust | |
|---|---|---|---|---|---|---|---|---|---|
| No. | 91 | 72 | 85 | 67 | 85 | 84 | 93 | 93 | 82 |
Performance indicator data for Aboriginal and Torres Strait Islander people in this chapter are available in the attachment tables listed below. Contextual data and further supporting information can be found in the chapter.
| Table number | Table title |
|---|---|
| Table 13A.2 | Aged care target population, by remoteness areas |
| Table 13A.3 | People receiving aged care services, 2014-15 |
| Table 13A.24 | Aboriginal and Torres Strait Islander aged care recipients of all ages per 1000 Aboriginal and Torres Strait Islander Australians aged 50 years or over and as a proportion of all recipients, 30 June |
| Table 13A.30 | Older HACC client characteristics |
| Table 13A.33 | Aged care assessments |
| Table 13A.38 | Elapsed times for aged care services, by Indigenous status |
| Table 13A.42 | Hospital patient days used by those eligible and waiting for residential aged care |