Report on Government Services 2016
Chapter 9, Volume D
Fire and ambulance services
The Fire and ambulance services chapter (chapter 9) reports on the performance of governments in providing emergency management services provided in the event of fire and out of hospital medical emergency events.
Please note: An errata was released with this chapter. The files below have been updated to reflect the changes.
Download the chapter
- Chapter 9 Fire and ambulance services, attachment tables, and data quality information (PDF - 3868 Kb)
- Chapter 9 Attachment tables (XLSX - 1393 Kb)
- Key Facts
- Indicator Framework
- Indicator Results
In this tab
Fire events
Performance reporting for fire events includes information on fire service organisations, which are one of the primary agencies involved in providing emergency management services for fire events. Nationally in 2014-15:
- fire service organisations attended a total of 385 118 emergency incidents, of which 97 545 were fire event incidents
- total expenditure of fire service organisations was $3.7 billion, or $156 per person in the population
- 18 853 full time equivalent (FTE) paid personnel were employed by fire service organisations, of which 75.8 per cent were paid firefighters. A large number of volunteer firefighters (226 052 people) also participated in the delivery of fire services.
The objective of government involvement in fire events is to build fire resilient communities that work together to understand and manage the fire risks that they confront.
Emergency management services provide highly effective, efficient and accessible services that:
- reduce the adverse effects of fire events on the community (including people, property, infrastructure, economy and environment)
- contribute to the management of fire risks to the community
- enhance public safety.
Ambulance events
Performance reporting for ambulance events includes information on ambulance service organisations, which are the primary agencies involved in providing services for out-of-hospital medical emergency events. Nationally in 2014-15:
- there were 3.4 million incidents resulting in 4.2 million ambulance service responses to attend to 3.2 million patients
- recurrent expenditure across Australia was approximately $2.8 billion (or $119 per person)
- there were 15 976 full time equivalent paid personnel, 6211 volunteers and 1122 community first responders in ambulance service organisations. (Community first responders are trained volunteers that provide an emergency response (with no transport capacity) and first aid care before ambulance arrival.)
The objectives of government involvement in ambulance service to provide pre hospital and out of hospital care and patient transport services, that:
- are high quality, timely, and meet clients' needs through delivery of coordinated and responsive health care
- are equitable and accessible
- are effectively, efficiently and sustainably delivered
- reduce the adverse effects of emergency events on the community by providing specialised medical care in emergency situations.
In this tab
Fire events
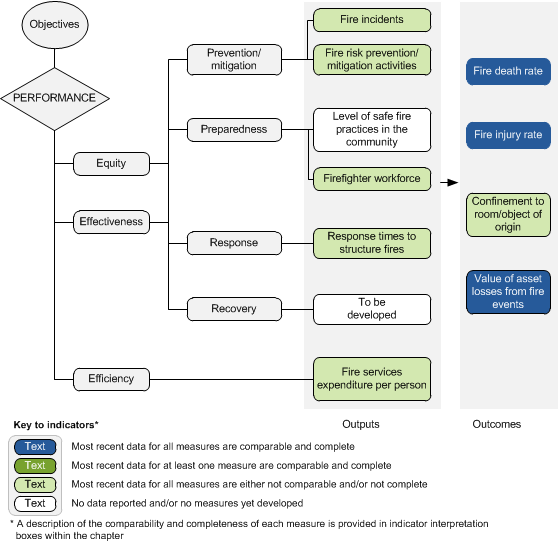
The performance indicator framework provides information on equity, efficiency and effectiveness, and distinguishes the outputs and outcomes of emergency services for fire events. The performance indicator framework shows which data are complete and comparable in the 2016 Report.
Ambulance events
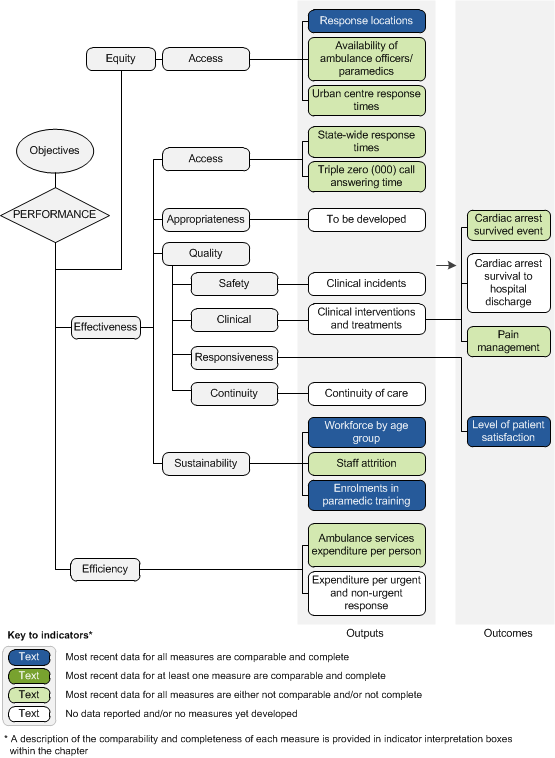
The performance indicator framework provides information on equity, efficiency and effectiveness, and distinguishes the outputs and outcomes of ambulance services. The performance indicator framework shows which data are complete and comparable in the 2016 Report.
In this tab
Fire events
An overview of the Fire events performance indicator results are presented. Information to assist the interpretation of these data can be found in the indicator interpretation boxes in the Fire and ambulance services chapter and attachment tables.
Equity and effectiveness — prevention/mitigation indicators
Fire incidents
Fire incidents attended by fire service organisations per 100 000 people, 2014-15
| NSW | Vic | Qld | WA | SA | Tas | ACT | NT | Aust | |
|---|---|---|---|---|---|---|---|---|---|
| No. | 408 | 373 | 400 | 443 | 422 | 669 | 220 | 1154 | 413 |
Accidental residential structure fires per 100 000 households, 2014-15
| NSW | Vic | Qld | WA | SA | Tas | ACT | NT | Aust | |
|---|---|---|---|---|---|---|---|---|---|
| No. | 95.2 | 113.4 | 46.9 | 60.2 | 73.6 | 112.9 | 89.1 | 51.4 | 84.5 |
Level of safe fire practices in the community
Estimated percentage of households with a smoke alarm/detector, 2014-15
| NSW | Vic | Qld | WA | SA | Tas | ACT | NT | Aust | |
|---|---|---|---|---|---|---|---|---|---|
| % | 94.4 | 97.2 | 94.9 | na | na | na | na | 80.0 | na |
Equity and effectiveness — preparedness
Firefighter workforce
Number of firefighting personnel (FTE) per 100 000 people, 2014-15
| NSW | Vic | Qld | WA | SA | Tas | ACT | NT | Aust | |
|---|---|---|---|---|---|---|---|---|---|
| Mo. | 54.4 | 80.4 | 52.9 | 42.7 | 52.3 | 59.4 | 90.5 | 115.9 | 60.5 |
Equity and effectiveness — response
Response times to structure fires
State-wide response times to structure fires, 2014-15 — including call taking time, 90th percentile, 2014-15
| NSW | Vic | Qld | WA | SA | Tas | ACT | NT | Aust | |
|---|---|---|---|---|---|---|---|---|---|
| min. | 14.1 | 10.9 | 12.3 | 15.2 | 11.7 | 17.7 | 11.0 | 23.2 | na |
State-wide response times to structure fires — excluding call taking time, 90th percentile, 2014-15
| NSW | Vic | Qld | WA | SA | Tas | ACT | NT | Aust | |
|---|---|---|---|---|---|---|---|---|---|
| min. | 13.2 | 9.5 | 11.6 | 13.6 | 14.0 | 16.3 | 9.0 | 15.1 | na |
Efficiency indicators
Fire services expenditure per person
Fire service organisations' expenditure per person, 2014-15
| NSW | Vic | Qld | WA | SA | Tas | ACT | NT | Aust | |
|---|---|---|---|---|---|---|---|---|---|
| $ | 131.63 | 214.31 | 129.96 | 145.61 | 134.85 | 157.24 | 211.64 | 220.13 | 156.42 |
Outcome indicators
Fire death rate
Fire death rate, per million people, 2013
| NSW | Vic | Qld | WA | SA | Tas | ACT | NT | Aust | |
|---|---|---|---|---|---|---|---|---|---|
| no. | 4.5 | 4.0 | 4.9 | 2.8 | 4.8 | — | 2.6 | 4.2 | 4.3 |
Fire injury rate
Rate of hospital admissions due to fire injury, per 100 000 people, 2013-14
| NSW | Vic | Qld | WA | SA | Tas | ACT | NT | Aust | |
|---|---|---|---|---|---|---|---|---|---|
| no. | 15.1 | 12.0 | 19.2 | 19.3 | 28.6 | 15.4 | 9.6 | 78.3 | 17.2 |
Confinement to room/object of origin
Proportion of building fires confined to room of origin, all ignition types, 2014-15
| NSW | Vic | Qld | WA | SA | Tas | ACT | NT | Aust | |
|---|---|---|---|---|---|---|---|---|---|
| % | 68.3 | 71.8 | 69.5 | 65.9 | 66.2 | 60.4 | 73.4 | 94.0 | na |
Proportion of building and other structure fires confined to room of origin, all ignition types, 2014-15
| NSW | Vic | Qld | WA | SA | Tas | ACT | NT | Aust | |
|---|---|---|---|---|---|---|---|---|---|
| % | 80.4 | 78.8 | 83.9 | 73.6 | 72.7 | 72.2 | 85.7 | 94.0 | na |
Value of property losses from fire events
Value of fire event household insurance claims per person, 2014-15
| NSW | Vic | Qld | WA | SA | Tas | ACT | NT | Aust | |
|---|---|---|---|---|---|---|---|---|---|
| $ | 17.44 | 20.21 | 21.52 | 13.27 | 31.41 | 63.11 | 12.21 | 15.73 | 20.38 |
Ambulance events
An overview of the Ambulance events performance indicator results are presented. Information to assist the interpretation of these data can be found in the indicator interpretation boxes in the Fire and ambulance services chapter and attachment tables.
Equity — Access indicators
Response locations
Paid, mixed and volunteer locations per 100 000 people, 2014-15
| NSW | Vic | Qld | WA | SA | Tas | ACT | NT | Aust | |
|---|---|---|---|---|---|---|---|---|---|
| No. | 3.2 | 4.5 | 5.6 | 7.6 | 6.6 | 9.7 | 2.1 | 3.7 | 4.9 |
Availability of ambulance officers/paramedics
Number of full time equivalent ambulance officers/paramedics per 100 000 people, 2014-15
| NSW | Vic | Qld | WA | SA | Tas | ACT | NT | Aust | |
|---|---|---|---|---|---|---|---|---|---|
| No. | 42.1 | 50.0 | 61.5 | 28.8 | 45.0 | 47.7 | 36.0 | 37.7 | 46.7 |
Urban centre response times
Capital city centre response times, 90th percentile, 2014-15
| NSW | Vic | Qld | WA | SA | Tas | ACT | NT | Aust | |
|---|---|---|---|---|---|---|---|---|---|
| min. | 21.2 | 18.3 | 15.1 | 14.3 | 14.7 | 17.5 | 12.5 | 18.2 | na |
Effectiveness — Access indicators
State-wide response times
State-wide response times, 90th percentile, 2014-15
| NSW | Vic | Qld | WA | SA | Tas | ACT | NT | Aust | |
|---|---|---|---|---|---|---|---|---|---|
| min. | 22.9 | 22.1 | 16.4 | 16.8 | 16.8 | 24.0 | 12.5 | 17.5 | na |
Triple zero call answering time
Proportion of calls from the emergency call service answered by ambulance service communication centre staff in a time equal to or less than 10 seconds, 2014-15
| NSW | Vic | Qld | WA | SA | Tas | ACT | NT | Aust | |
|---|---|---|---|---|---|---|---|---|---|
| % | 86.1 | 93.8 | 91.2 | 94.4 | 92.3 | 96.8 | 95.8 | 93.4 | 89.5 |
Effectiveness — Sustainability indicators
Workforce by age group
Operational workforce under 50 years of age, 2014-15
| NSW | Vic | Qld | WA | SA | Tas | ACT | NT | Aust | |
|---|---|---|---|---|---|---|---|---|---|
| % | 75.6 | 77.3 | 80.0 | 79.8 | 75.5 | 74.5 | 80.3 | 85.0 | 75.2 |
Staff attrition
Staff attrition, 2014-15
| NSW | Vic | Qld | WA | SA | Tas | ACT | NT | Aust | |
|---|---|---|---|---|---|---|---|---|---|
| % | 4.0 | 4.3 | 2.6 | 3.3 | 2.6 | 6.2 | 2.8 | na | 3.6 |
Paramedics in training
Enrolments in accredited paramedic training courses, per million people, 2014
| NSW | Vic | Qld | WA | SA | Tas | ACT | NT | Aust | |
|---|---|---|---|---|---|---|---|---|---|
| No. | 106.9 | 381.6 | 419.1 | 295.7 | 207.0 | 174.8 | 414.5 | -- | 271.3 |
Efficiency indicators
Expenditure per person
Ambulance services expenditure per person, 2014-15
| NSW | Vic | Qld | WA | SA | Tas | ACT | NT | Aust | |
|---|---|---|---|---|---|---|---|---|---|
| $ | 115.47 | 123.26 | 129.84 | 86.41 | 145.65 | 127.27 | 114.94 | 108.90 | 119.45 |
Outcome indicators
Cardiac arrest survived event
Adult cardiac arrest survival rate — where resuscitation attempted (excluding paramedic witnessed), 2014-15
| NSW | Vic | Qld | WA | SA | Tas | ACT | NT | Aust | |
|---|---|---|---|---|---|---|---|---|---|
| % | 31.1 | 29.8 | 25.0 | 24.5 | 23.4 | 29.1 | 36.9 | 26.1 | 28.4 |
Pain management
Proportion of patients who report a clinically meaningful pain reduction, 2014-15
| NSW | Vic | Qld | WA | SA | Tas | ACT | NT | Aust | |
|---|---|---|---|---|---|---|---|---|---|
| % | 86.4 | 90.3 | 88.7 | 82.3 | 64.6 | 88.3 | 93.4 | 86.7 | 86.5 |
Level of patient satisfaction
Overall satisfaction rate, 2015 c
| NSW | Vic | Qld | WA | SA | Tas | ACT | NT | Aust | |
|---|---|---|---|---|---|---|---|---|---|
| % | 99 ± 1.1 | 97 ± 1.4 | 98 ± 1.3 | 97 ± 1.7 | 98 ± 1.3 | 98 ± 1.3 | 98 ± 1.3 | 97 ± 2.6 | 98 ± 0.5 |
Legend
a Caveats for these data are available in chapter 9 and attachment 9A. Refer to the indicator interpretation boxes in chapter 9 for information to assist with the interpretation of data presented in this table.
b Some data are derived from detailed data in chapter 9 and attachment 9A.
c The percentages reported for this indicator include 95 per cent confidence intervals.
na Not available.
.. Not applicable.
Source: Chapter 9 and attachment 9A Source: Chapter 9 and attachment 9A