Report on Government Services 2016
Chapter 18, Volume G
Homelessness services
The Homelessness services chapter (chapter 18) reports on the performance of governments in providing specialist homelessness services, and the people accessing these services.
The National Affordable Housing Agreement (NAHA) and the National Partnership Agreement on Homelessness (NPAH) provide the framework for Australian Government and State and Territory governments to work together to reduce homelessness and improve housing outcomes for Australians.
Download the chapter
- Chapter 18 Homelessness services, attachment tables, and data quality information (PDF - 2173 Kb)
- Chapter 18 Attachment tables (XLSX - 596 Kb)
- Key Facts
- Indicator Framework
- Indicator Results
- Indigenous Data
In 2014-15, the Australian and State and Territory government recurrent expenditure on specialist homelessness services was $707 million. Most of this expenditure (97.6 per cent) was funding provided to agencies to deliver services for people who are homeless or at risk of homelessness.
Nationally in 2014-15, an estimated 255 657 people were provided support by specialist homelessness services agencies. Specialist homelessness agencies provide a number of services to clients in a single support period — across a range of support areas — including general services (provided to 90.7 per cent of clients), accommodation (33.3 per cent), assistance to sustain housing (27.8 per cent) and domestic violence services (23.1 per cent).
The overall aim of specialist homelessness services is to provide transitional supported accommodation and a range of related support services, to help people who are homeless or at imminent risk of homelessness to achieve the maximum possible degree of self reliance and independence. Within this aim, the goals are to:
- resolve crises
- re-establish family links where appropriate
- re-establish the capacity of clients to live independently, achieve sustainable housing and social inclusion
- provide homelessness services in an equitable and efficient manner.
The performance indicator framework provides information on equity, efficiency and effectiveness, and distinguishes the outputs and outcomes of homelessness services. The performance indicator framework shows which data are complete and comparable in the 2016 Report.
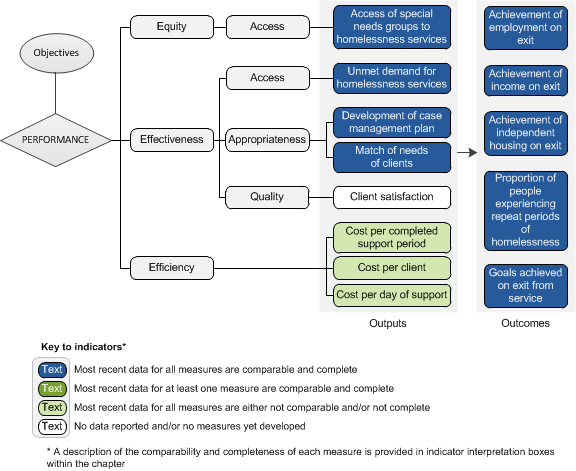
An overview of the Homelessness services performance indicator results are presented. Information to assist the interpretation of these data can be found in the indicator interpretation boxes in the Homelessness services chapter and attachment tables.
Equity — Access indicators
Access of special needs groups to homelessness services
Aboriginal and Torres Strait Islander people, and their representation in the population
Representation among clients whose accommodation needs were met, 2014-15
| NSW | Vic | Qld | WA | SA | Tas | ACT | NT | Aust | |
|---|---|---|---|---|---|---|---|---|---|
| % | 26.6 | 11.9 | 34.1 | 48.5 | 31.3 | 15.2 | 21.0 | 76.2 | 28.1 |
Representation among clients whose need for services other than accommodation were met, 2014-15
| NSW | Vic | Qld | WA | SA | Tas | ACT | NT | Aust | |
|---|---|---|---|---|---|---|---|---|---|
| % | 22.2 | 5.5 | 28.3 | 22.3 | 19.8 | 13.0 | 11.5 | 67.9 | 15.4 |
Representation in the population, June 2015
| NSW | Vic | Qld | WA | SA | Tas | ACT | NT | Aust | |
|---|---|---|---|---|---|---|---|---|---|
| % | 2.9 | 0.9 | 4.3 | 3.6 | 2.4 | 5.0 | 1.7 | 29.5 | 3.0 |
People born in non-main English-speaking countries
Representation among clients whose accommodation needs were met, 2014-15
| NSW | Vic | Qld | WA | SA | Tas | ACT | NT | Aust | |
|---|---|---|---|---|---|---|---|---|---|
| % | 10.5 | 15.2 | 7.6 | 8.8 | 5.9 | 4.2 | 17.2 | 3.3 | 10.5 |
Representation among clients whose need for services other than accommodation were met, 2014-15
| NSW | Vic | Qld | WA | SA | Tas | ACT | NT | Aust | |
|---|---|---|---|---|---|---|---|---|---|
| % | 7.3 | 12.5 | 6.7 | 10.0 | 5.7 | 4.9 | 17.5 | 2.3 | 9.8 |
Representation in the population, 2011
| NSW | Vic | Qld | WA | SA | Tas | ACT | NT | Aust | |
|---|---|---|---|---|---|---|---|---|---|
| % | 17.9 | 18.9 | 9.2 | 13.7 | 12.3 | 4.9 | 16.3 | 9.5 | 15.1 |
People with disability, and their representation in the population
Representation among clients whose accommodation needs were met, 2014-15
| NSW | Vic | Qld | WA | SA | Tas | ACT | NT | Aust | |
|---|---|---|---|---|---|---|---|---|---|
| % | 4.1 | 5.8 | 3.0 | 3.9 | 2.7 | 5.0 | 4.0 | 2.8 | 4.1 |
Representation among clients whose need for services other than accommodation were met, 2014-15
| NSW | Vic | Qld | WA | SA | Tas | ACT | NT | Aust | |
|---|---|---|---|---|---|---|---|---|---|
| % | 2.9 | 2.8 | 2.9 | 7.0 | 1.8 | 4.2 | 2.7 | 3.3 | 3.0 |
Representation in the population, 2013
| NSW | Vic | Qld | WA | SA | Tas | ACT | NT | Aust | |
|---|---|---|---|---|---|---|---|---|---|
| % | 6.4 | 6.4 | 5.5 | 4.9 | 6.9 | 7.7 | 5.2 | 3.8 | 6.1 |
Effectiveness — Access indicators
Unmet demand for homelessness services
Proportion of clients with unmet need for accomodation, 2014-15
| NSW | Vic | Qld | WA | SA | Tas | ACT | NT | Aust | |
|---|---|---|---|---|---|---|---|---|---|
| % | 22.9 | 31.8 | 27.4 | 16.3 | 19.1 | 19.7 | 33.9 | 9.9 | 25.9 |
Proportion of clients with unmet need for services other than accomodation, 2014-15
| NSW | Vic | Qld | WA | SA | Tas | ACT | NT | Aust | |
|---|---|---|---|---|---|---|---|---|---|
| % | 1.6 | 2.9 | 0.9 | 0.1 | - | 1.7 | 0.6 | 0.8 | 1.8 |
Effectiveness — Appropriateness indicators
Development of case management plan
Proportion of clients with a case management plan (closed support periods), 2014-15
| NSW | Vic | Qld | WA | SA | Tas | ACT | NT | Aust | |
|---|---|---|---|---|---|---|---|---|---|
| % | 51.8 | 39.7 | 86.1 | 45.3 | 33.6 | 41.9 | 59.4 | 69.1 | 49.3 |
Match of needs of clients
Proportion of clients seeking accommodation and accommodation related assistance that were directly provided, or directly provided and referred, with a service (closed support periods), 2014-15
| NSW | Vic | Qld | WA | SA | Tas | ACT | NT | Aust | |
|---|---|---|---|---|---|---|---|---|---|
| % | 52.9 | 47.8 | 57.2 | 71.9 | 79.2 | 45.3 | 47.5 | 88.2 | 56.0 |
Efficiency indicators
Cost per completed support period
Recurrent cost per completed support period, 2014-15
| NSW | Vic | Qld | WA | SA | Tas | ACT | NT | Aust | |
|---|---|---|---|---|---|---|---|---|---|
| $ | 3068 | 1184 | 2326 | 2362 | 1771 | 2534 | 3844 | 1289 | 1864 |
Cost per client
Recurrent cost per client accessing homelessness services, 2014-15
| NSW | Vic | Qld | WA | SA | Tas | ACT | NT | Aust | |
|---|---|---|---|---|---|---|---|---|---|
| $ | 3759 | 2048 | 2792 | 3073 | 2799 | 4030 | 4144 | 1533 | 2766 |
Cost per day of support
Recurrent cost per day of support for clients, 2014-15
| NSW | Vic | Qld | WA | SA | Tas | ACT | NT | Aust | |
|---|---|---|---|---|---|---|---|---|---|
| $ | 45.98 | 29.20 | 41.22 | 44.82 | 30.38 | 54.30 | 25.48 | 18.32 | 35.95 |
Outcome indicators
Achievement of employment on exit
Proportion of clients who needed employment and/or training assistance who were employed after support (closed support periods), 2014-15
| NSW | Vic | Qld | WA | SA | Tas | ACT | NT | Aust | |
|---|---|---|---|---|---|---|---|---|---|
| % | 20.6 | 16.9 | 17.2 | 19.8 | 22.7 | 16.5 | 23.7 | 17.0 | 19.1 |
Achievement of income on exit
Proportion of clients who needed income assistance who had an income source after support (closed support periods), 2014-15
| NSW | Vic | Qld | WA | SA | Tas | ACT | NT | Aust | |
|---|---|---|---|---|---|---|---|---|---|
| % | 92.8 | 93.5 | 93.1 | 94.4 | 88.3 | 91.5 | 94.9 | 93.6 | 92.9 |
Achievement of independent housing on exit
Proportion of clients who needed assistance to obtain or maintain independent housing who obtained or maintained independent housing after support (closed support periods), 2014-15
| NSW | Vic | Qld | WA | SA | Tas | ACT | NT | Aust | |
|---|---|---|---|---|---|---|---|---|---|
| % | 63.0 | 62.0 | 65.1 | 56.5 | 63.5 | 68.9 | 65.7 | 66.4 | 63.5 |
Proportion of people experiencing repeat periods of homelessness
Proportion of clients experiencing homelessness who had repeat periods of homelessness, 2014-15 (%)
| NSW | Vic | Qld | WA | SA | Tas | ACT | NT | Aust | |
|---|---|---|---|---|---|---|---|---|---|
| % | 6.9 | 6.0 | 5.5 | 6.2 | 5.5 | 6.7 | 7.3 | 5.4 | 5.7 |
Goals achieved on exit from service
Proportion of closed support periods with individual case management plan where half or more or all case management goals were achieved, 2014-15 (%)
| NSW | Vic | Qld | WA | SA | Tas | ACT | NT | Aust | |
|---|---|---|---|---|---|---|---|---|---|
| % | 59.2 | 72.0 | 80.7 | 54.6 | 81.0 | 56.0 | 68.4 | 63.9 | 70.7 |
Performance indicator data for Aboriginal and Torres Strait Islander people in this chapter are available in the attachment tables listed below. Contextual data and further supporting information can be found in the chapter.
| Table number | Table title |
|---|---|
| Table 18A.5 | Proportion of clients — with accommodation and services other than accommodation needs that were met — who were Aboriginal and Torres Strait Islander clients |
| Table 18A.8 | Aboriginal and Torres Strait Islander people, people born in non-main English speaking countries (MESC) and people with disability, as a proportion of all clients who accessed specialist homelessness services and in the population |
| Table 18A.12 | Proportion of Aboriginal and Torres Strait Islander clients with a case management plan (closed support periods) |
| Table 18A.13 | Support needs of clients, summary |
| Table 18A.15 | Support needs of clients, by service assistance type, Aboriginal and Torres Strait Islander clients (closed support periods) |
| Table 18A.22 | Proportion of Aboriginal and Torres Strait Islander clients who needed employment and/or training assistance and who were employed after support (closed support periods) |
| Table 18A.25 | Proportion of Aboriginal and Torres Strait Islander clients who needed income assistance and who had an income source after support (closed support periods) |
| Table 18A.27 | Proportion of Aboriginal and Torres Strait Islander clients who needed assistance to obtain or maintain independent housing (closed support periods), type of tenure before and after support |
| Table 18A.30 | Proportion of Aboriginal and Torres Strait Islander clients who needed assistance to obtain or maintain independent housing and who achieved independent housing after support, and did not present again with a need for accommodation within the reporting period, by tenure type after support (closed support periods) |
| Table 18A.32 | Proportion of Aboriginal and Torres Strait Islander clients experiencing homelessness who had repeat periods of homelessness |