Report on Government Services 2017
Volume B, Chapter 3
Early childhood education and care
This chapter reports on the performance of early childhood education and care (ECEC) services, which comprise child care and preschool services.
Download the chapter
- Chapter 3 Early childhood education and care and attachment tables (PDF - 3691 Kb)
- Chapter 3 Attachment tables (XLSX - 1113 Kb)
- Key Facts
- Indicator Framework
- Indicator Results
- Indigenous Data
There were 1 220 549 children aged 12 years or younger attending Australian Government Child Care Benefit approved child care services in the March quarter 2016, an increase of 2.7 per cent from 2015.
In 2015, 304 153 children aged 4 and 5 years, or about 100 per cent of 4 year old children, were enrolled in a preschool program in the year before full time schooling, an increase from 95.1 per cent in 2014.
In 2015, 87.0 per cent of 4 year old Aboriginal and Torres Strait Islander children were enrolled in a preschool program in the year before full time schooling, an increase from 75.4 per cent in 2014.
At 30 June 2016, 70.4 per cent of National Quality Framework approved services with a quality rating were rated as meeting the National Quality Standard or higher (exceeding the National Quality Standard or excellent).
Total Australian, State and Territory government recurrent and capital expenditure on early childhood education and care was $9.1 billion in 2015‑16 — a real increase of $315.6 million (3.6 per cent) from 2014‑15.
In 2015, 22.0 per cent of children in their first year of full time schooling were developmentally vulnerable on one or more domains. Children who had received some ECEC were less likely to be developmentally vulnerable than children who had not.
ECEC services aim to meet the education, care and development needs of children, and meet the needs of families including enabling increased workforce participation, by providing universal access to early childhood education services for eligible children and accessible child care services that:
- are high quality, affordable, flexible and can be implemented across a range of settings
- are delivered in a safe, nurturing and inclusive environment
- target improved access for, and participation by, Aboriginal and Torres Strait Islander, vulnerable and disadvantaged children.
Governments aim for ECEC services to meet these objectives in an equitable and efficient manner.
The performance indicator framework provides information on equity, efficiency and effectiveness, and distinguishes the outputs and outcomes of ECEC services. The performance indicator framework shows which data are complete and comparable in the 2017 Report.
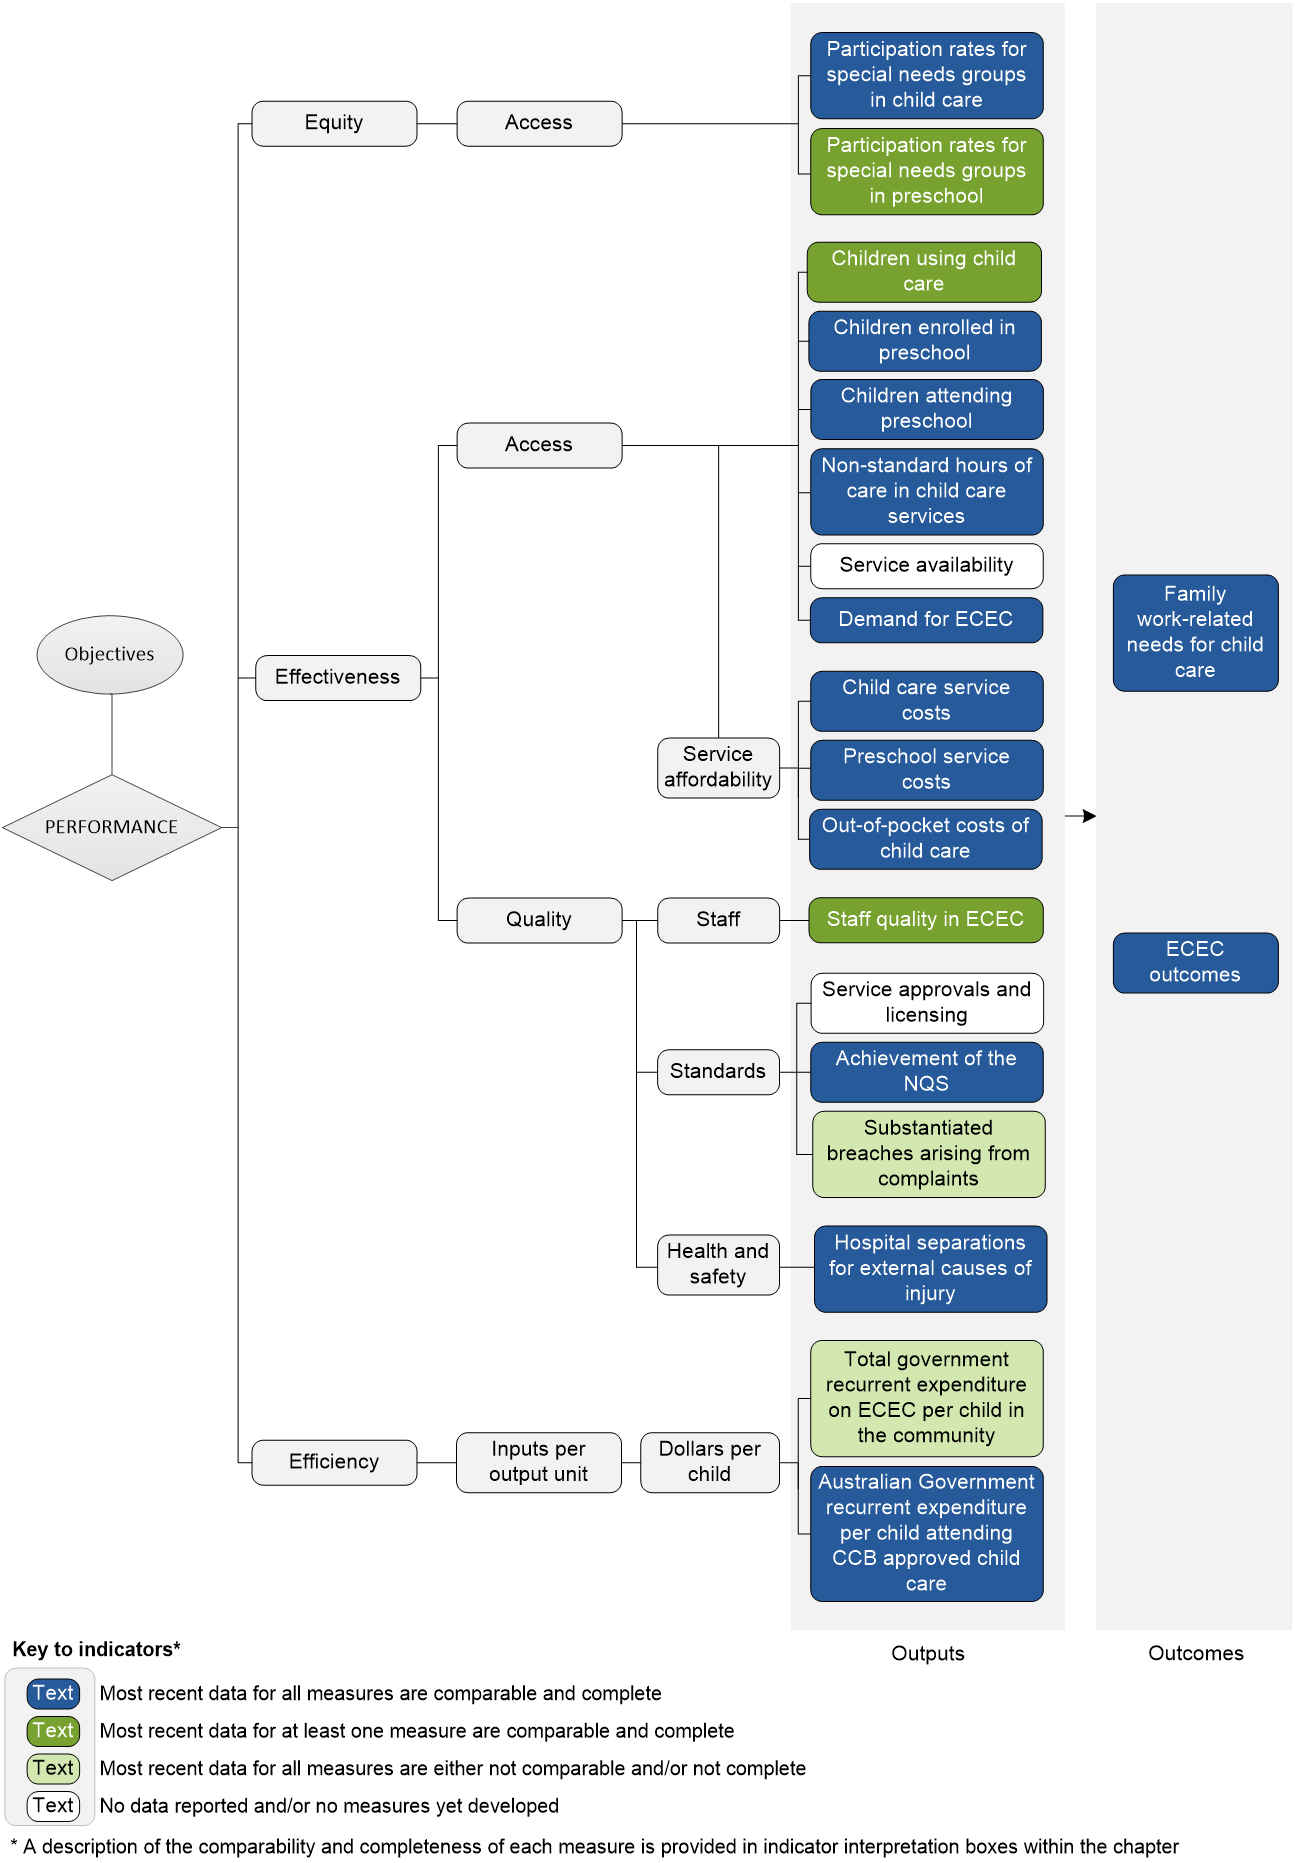
An overview of the Early childhood education and care (ECEC) performance indicator results are presented. Information to assist the interpretation of these data can be found in the indicator interpretation boxes in the ECEC chapter and attachment tables.
Equity — Access indicators
Participation rates for special needs groups in child care
Proportion of 0-12 year olds attending Australian Government Child Care Benefit (CCB) approved child care who are Aboriginal and Torres Strait Islander children, 2016. Compared to community proportion, 2015
| NSW | Vic | Qld | WA | SA | Tas | ACT | NT | Aust | |
|---|---|---|---|---|---|---|---|---|---|
| % | 2.6 | 0.9 | 3.7 | 2.4 | 1.7 | 5.5 | 1.3 | 9.8 | 2.4 |
| % | 5.4 | 1.6 | 7.9 | 6.2 | 4.5 | 9.6 | 2.8 | 41.3 | 5.5 |
Proportion of 0-12 year olds attending Australian Government CCB approved child care who are from low-income families, 2016. Compared to community proportion, 2013-14
| NSW | Vic | Qld | WA | SA | Tas | ACT | NT | Aust | |
|---|---|---|---|---|---|---|---|---|---|
| % | 23.5 | 25.0 | 26.2 | 19.8 | 21.5 | 25.8 | 9.6 | 12.1 | 23.7 |
| % | 17.8 | 17.6 | 16.6 | 11.9 | 18.5 | 24.8 | 6.1 | 9.0 | 16.8 |
Proportion of 0–12 year olds attending Australian Government CCB approved child care with disability, 2016. Compared to community proportion, 2015.
| NSW | Vic | Qld | WA | SA | Tas | ACT | NT | Aust | |
|---|---|---|---|---|---|---|---|---|---|
| % | 4.3 | 3.6 | 3.1 | 2.8 | 4.1 | 4.7 | 2.6 | 3.4 | 3.7 |
| % | 7.2 | 6.6 | 7.8 | 5.4 | 9.6 | 9.7 | 6.2 | 5.5 | 7.2 |
Participation rates for special needs groups in preschool
Proportion of 3–5 year olds enrolled in a preschool program who are Aboriginal and Torres Strait Islander children, 2015. Compared to community proportion, 2015
| NSW | Vic | Qld | WA | SA | Tas | ACT | NT | Aust | |
|---|---|---|---|---|---|---|---|---|---|
| % | 4.7 | 1.5 | 6.2 | 5.7 | 6.6 | 7.7 | 3.0 | 34.6 | 4.8 |
| % | 5.2 | 1.6 | 7.9 | 5.9 | 4.5 | 9.4 | 2.8 | 38.0 | 5.4 |
Proportion of 3–5 year olds enrolled in a preschool program who are from regional areas, 2015. Compared to community proportion, 2015
| NSW | Vic | Qld | WA | SA | Tas | ACT | NT | Aust | |
|---|---|---|---|---|---|---|---|---|---|
| % | 27.1 | 23.0 | 33.3 | 16.9 | 22.2 | 98.4 | 3.3 | 54.9 | 27.2 |
| % | 24.3 | 23.1 | 35.3 | 17.2 | 23.0 | 98.3 | 1.2 | 52.8 | 26.9 |
Proportion of 3–5 year olds enrolled in a preschool program who are from remote areas, 2015. Compared to community proportion, 2015
| NSW | Vic | Qld | WA | SA | Tas | ACT | NT | Aust | |
|---|---|---|---|---|---|---|---|---|---|
| % | 0.7 | – | 2.8 | 6.4 | 3.9 | 1.5 | .. | 44.6 | 2.3 |
| % | 0.6 | 0.1 | 3.5 | 6.5 | 3.8 | 1.7 | .. | 47.2 | 2.5 |
Effectiveness — Access indicators
Children using child care
Proportion of 0–12 year olds attending Australian Government CCB approved child care, 2016
| NSW | Vic | Qld | WA | SA | Tas | ACT | NT | Aust | |
|---|---|---|---|---|---|---|---|---|---|
| % | 32.8 | 30.9 | 33.9 | 21.4 | 32.1 | 27.6 | 41.9 | 19.8 | 31.0 |
Children enrolled in preschool
Proportion of 4 year old children who are enrolled in a preschool program in the year before full time schooling, 2015
| NSW | Vic | Qld | WA | SA | Tas | ACT | NT | Aust | |
|---|---|---|---|---|---|---|---|---|---|
| % | 85.5 | 112.1 | 103.1 | 102.3 | 110.2 | 117.7 | 123.1 | 100.6 | 100.6 |
Proportion of 4 year old Aboriginal and Torres Strait Islander children who are enrolled in a preschool program in the year before full time schooling, 2015
| NSW | Vic | Qld | WA | SA | Tas | ACT | NT | Aust | |
|---|---|---|---|---|---|---|---|---|---|
| % | 74.6 | 99.6 | 81.4 | 106.9 | 113.1 | 97.2 | 134.5 | 86.1 | 87.0 |
Children attending preschool
Proportion of 4 year old children who are attending a preschool program in the year before full time schooling, 2015
| NSW | Vic | Qld | WA | SA | Tas | ACT | NT | Aust | |
|---|---|---|---|---|---|---|---|---|---|
| % | 82.8 | 105.9 | 98.8 | 98.2 | 108.3 | 115.5 | 120.2 | 86.7 | 96.5 |
Non-standard hours of care in child care services
Proportion of Australian Government CCB approved child care services providing non-standard hours of care, 2016
| NSW | Vic | Qld | WA | SA | Tas | ACT | NT | Aust | |
|---|---|---|---|---|---|---|---|---|---|
| % | 15.4 | 21.4 | 51.5 | 26.4 | 23.8 | 14.5 | 4.7 | 13.9 | 26.0 |
Demand for ECEC
Proportion of children aged 0–12 years for whom additional formal child care or preschool was currently required, 2014
| NSW | Vic | Qld | WA | SA | Tas | ACT | NT | Aust | |
|---|---|---|---|---|---|---|---|---|---|
| % | 10.9 ± 1.7 | 9.5 ± 1.6 | 8.4 ± 2.0 | 10.1 ± 2.4 | 10.5 ± 2.5 | 11.0 ± 3.6 | 13.4 ± 3.4 | 11.8 ± 4.4 | 10.0 ± 0.8 |
Source: Attachment table 3A.69
Proportion of children aged 0–12 years in families for whom additional formal child care was currently required for work-related reasons, 2014
| NSW | Vic | Qld | WA | SA | Tas | ACT | NT | Aust | |
|---|---|---|---|---|---|---|---|---|---|
| % | 4.0 ± 1.2 | 2.7 ± 0.9 | 3.1 ± 1.5 | 3.0 ± 1.3 | 3.5 ± 1.6 | 5.0 ± 2.9 | np | 4.7 ± 3.1 | 3.6 ± 0.6 |
Source: Attachment table 3A.67
Effectiveness — Access — Service affordability indicators
Child care service costs
Median weekly cost for 50 hours of Australian Government CCB approved long day care (LDC) and family day care (FDC), 2016
| NSW | Vic | Qld | WA | SA | Tas | ACT | NT | Aust | |
|---|---|---|---|---|---|---|---|---|---|
| $ LDC | 450 | 448 | 385 | 436 | 420 | 401 | 525 | 415 | 425 |
| $ FDC | 370 | 385 | 389 | 411 | 363 | 407 | 459 | 481 | 383 |
Preschool service costs
Median per hour preschool program cost after subsidies per child enrolled aged 4 and 5 years, 2015
| NSW | Vic | Qld | WA | SA | Tas | ACT | NT | Aust | |
|---|---|---|---|---|---|---|---|---|---|
| $ | 3.70 | 2.30 | 2.20 | – | – | – | – | – | 2.30 |
Out-of-pocket costs of child care
Proportion of weekly disposable income that families with $75 000 gross annual income spend on one child for 50 hours long day care, after child subsidies, 2016
| NSW | Vic | Qld | WA | SA | Tas | ACT | NT | Aust | |
|---|---|---|---|---|---|---|---|---|---|
| % | 12.1 | 11.9 | 8.9 | 11.7 | 10.3 | 9.5 | 14.5 | 10.5 | 11.1 |
Source: Attachment table 3A.71
Proportion of weekly disposable income that families with $75 000 gross annual income spend on one child for 30 hours long day care, after child subsidies, 2016
| NSW | Vic | Qld | WA | SA | Tas | ACT | NT | Aust | |
|---|---|---|---|---|---|---|---|---|---|
| % | 7.3 | 7.2 | 5.3 | 7.0 | 6.2 | 5.7 | 8.7 | 6.3 | 6.6 |
Source: Attachment table 3A.73
Effectiveness — Quality — Staff indicators
Staff quality in ECEC
Proportion of paid primary contact staff employed by CCB approved child care services with a relevant formal qualification at or above Certificate III level, 2016
| NSW | Vic | Qld | WA | SA | Tas | ACT | NT | Aust | |
|---|---|---|---|---|---|---|---|---|---|
| % | 75.8 | 89.8 | 78.1 | 78.5 | 79.9 | 83.3 | 61.8 | 62.9 | 79.7 |
Effectiveness — Quality — Standards indicators
Achievement of the National Quality Standard
Proportion of National Quality Framework (NQF) approved services with a quality rating who met or exceeded the National Quality Standard overall, 30 June 2016
| NSW | Vic | Qld | WA | SA | Tas | ACT | NT | Aust | |
|---|---|---|---|---|---|---|---|---|---|
| % | 63.6 | 80.2 | 75.0 | 61.2 | 67.3 | 71.9 | 57.2 | 39.4 | 70.4 |
Substantiated breaches arising from complaints
Number of substantiated breaches arising from complaints per 100 NQF approved services, 2015-16
| NSW | Vic | Qld | WA | SA | Tas | ACT | NT | Aust | |
|---|---|---|---|---|---|---|---|---|---|
| No. | 25 | 10 | 17 | 16 | 3 | 3 | 14 | 10 | 16 |
Effectiveness — Quality — Health and safety indicators
Hospital separations for external causes of injury
Proportion of hospital separations for children aged 0–4 years resulting from an external cause of injury occurring in 'school', 2014-15
| NSW | Vic | Qld | WA | SA | Tas | ACT | NT | Aust | |
|---|---|---|---|---|---|---|---|---|---|
| % | 3.0 | 2.6 | 3.0 | 2.6 | 3.1 | 2.3 | 3.5 | 1.8 | 2.9 |
Efficiency — Inputs per output unit — Dollars per child indicators
Total government recurrent expenditure on ECEC per child in the community
Australian Government and State and Territory government recurrent expenditure on ECEC per child aged 0–12 years in the community, 2015-16
| NSW | Vic | Qld | WA | SA | Tas | ACT | NT | Aust | |
|---|---|---|---|---|---|---|---|---|---|
| $ | 2 187 | 2 244 | 2 385 | 2 017 | 2 741 | 2 478 | 2 925 | 2 973 | 2 288 |
Australian Government recurrent expenditure per child attending CCB approved child care
Australian Government recurrent expenditure per child aged 0–12 years attending CCB approved child care, 2015-16
| NSW | Vic | Qld | WA | SA | Tas | ACT | NT | Aust | |
|---|---|---|---|---|---|---|---|---|---|
| % | 5 925 | 6 047 | 6 183 | 6 008 | 6 339 | 6 742 | 5 485 | 9 357 | 6 096 |
Outcome indicators
Family work-related needs for child care
Proportion of people aged 15 years or over not in the labour force due to caring for children whose main reason is child care service-related, 2015
| NSW | Vic | Qld | WA | SA | Tas | ACT | NT | Aust | |
|---|---|---|---|---|---|---|---|---|---|
| Cost or too expensive (%) | 36.6 ± 9.8 | 27.0 ± 8.5 | 38.2 ± 11.6 | 37.5 ± 9.4 | 36.3 ± 10.2 | 27.5 ± 19.8 | np | 53.8 ± 29.5 | 34.0 ± 4.9 |
| No child care in locality or not at all (%) | np | np | np | – | – | – | – | – | 4.1 ± 2.2 |
| Booked out or no places available (%) | np | 6.0 ± 5.6 | – | – | – | – | np | – | 3.6 ± 1.8 |
ECEC outcomes
Proportion of children who have had ECEC experience that are developmentally vulnerable on one or more domains of the AEDC, 2015
| NSW | Vic | Qld | WA | SA | Tas | ACT | NT | Aust | |
|---|---|---|---|---|---|---|---|---|---|
| % | 18.0 | 18.2 | 22.7 | 20.3 | 22.5 | 20.2 | 21.2 | 34.5 | 19.9 |
Notes
These data and caveats for these data are available in chapter 3 and attachment 3A.
Some percentages reported in these tables include 95 per cent confidence intervals (for example, 80 per cent ± 2.7 per cent).
.. Not applicable. – Nil or rounded to zero. np Not published.
Performance indicator data for Aboriginal and Torres Strait Islander people in this chapter are available in the attachment tables listed below. Contextual data and further supporting information can be found in the chapter.
| Table number | Table title |
|---|---|
| Table 3A.13 | Proportion of children aged 0–5 and 6–12 years attending Australian Government CCB approved child care services who are from special needs groups, compared with their representation in the community |
| Table 3A.14 | Proportion of children aged 0–12 years attending Australian Government CCB approved child care services who are from special needs groups, compared with their representation in the community |
| Table 3A.15 | Proportion of children aged 0–12 years attending State and Territory government (only) funded child care services who are from special needs groups, compared with their representation in the community |
| Table 3A.16 | Proportion of children aged 3–5 years enrolled in a preschool program who are from special needs groups, compared with their representation in the community, 2015 |
| Table 3A.27 | Aboriginal and Torres Strait Islander children aged 4 and 5 years enrolled in a preschool program in the YBFS, by remoteness area, national only |
| Table 3A.28 | Aboriginal and Torres Strait Islander children enrolled in a preschool program |
| Table 3A.29 | Aboriginal and Torres Strait Islander children aged 4 and 5 years enrolled in a preschool program in the YBFS, by weekly hours, 2015 |
| Table 3A.35 | Aboriginal and Torres Strait Islander children aged 4 and 5 years attending a preschool program in the YBFS, by remoteness area, national only |
| Table 3A.36 | Aboriginal and Torres Strait Islander children attending a preschool program |
| Table 3A.37 | Proportion of enrolled children aged 4 and 5 years attending a preschool program in the YBFS, by Indigenous status |