Report on Government Services 2018
Part B, Chapter 4
School education
This chapter focuses on performance information for government-funded school education in Australia.
Download the chapter
- Chapter 4 School education and attachment tables (PDF - 4859 Kb)
- Chapter 4 School education (Word - 364 Kb)
- Chapter 4 Attachment tables (XLSX - 1362 Kb)
- Key Facts
- Indicator Framework
- Indicator Results
- Indigenous Data
Nationally in 2016:
- there were 3.8 million full time equivalent students enrolled in school
- the majority of students (65.3 per cent of full time equivalent students) were enrolled in a government school. The majority of schools were government owned and managed.
- Aboriginal and Torres Strait Islander students accounted for 7.0 per cent of full time students at government schools and 2.5 per cent of full time students in non-government schools.
Recurrent expenditure by Australian, State and Territory governments on school education in 2015‑16 was $55.7 billion, of which $42.4 billion was spent on government schools.
Australian schooling aims for all young Australians to become successful learners, confident and creative individuals, and active and informed citizens positioning them to live fulfilling, productive and responsible lives. It aims for students to excel by international standards, while reducing educational disadvantage.
To meet this vision, the school education system aims to:
- engage all students and promote student participation
- deliver high quality teaching with a world-class curriculum.
Governments aim for school education services to meet these objectives in an equitable and efficient manner.
The performance indicator framework provides information on equity, efficiency and effectiveness, and distinguishes the outputs and outcomes of school education. The performance indicator framework shows which data are complete and comparable in the 2018 Report.
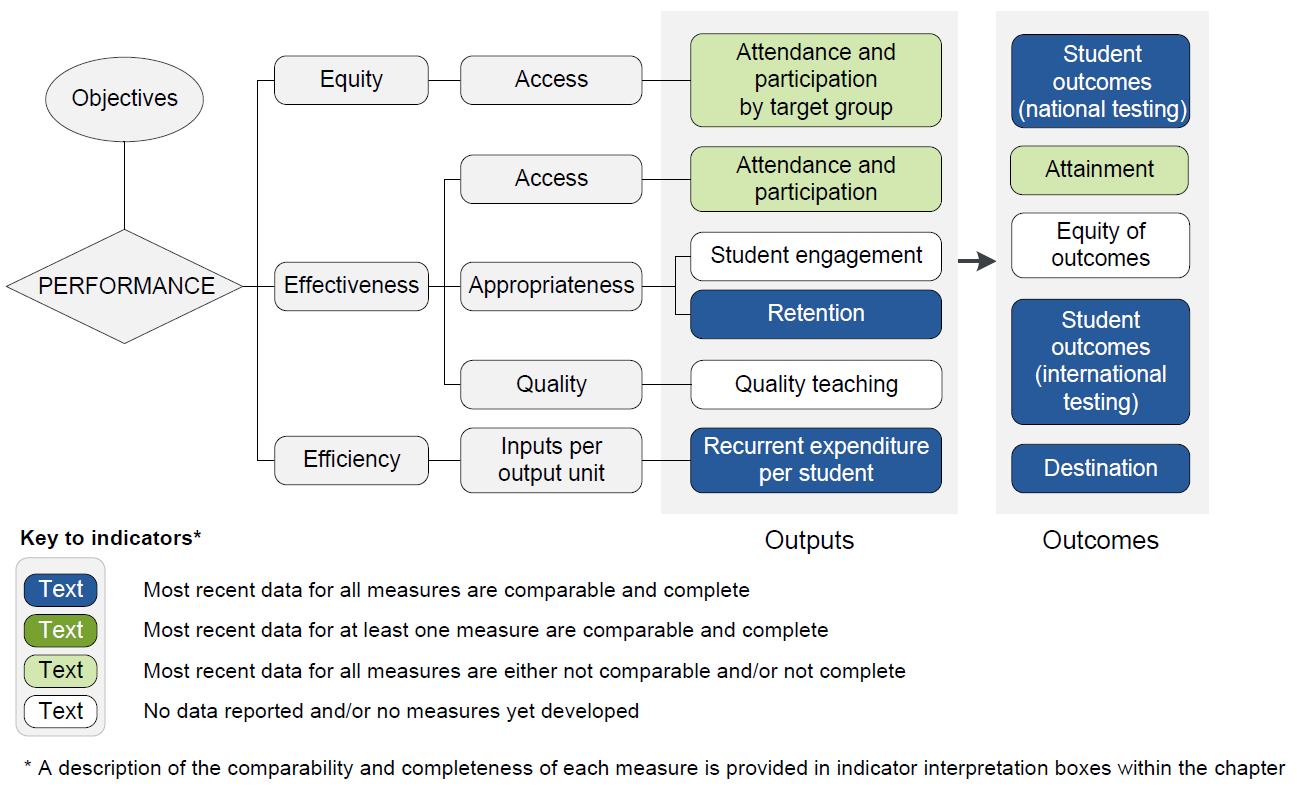
An overview of the School education performance indicator results are presented. Information to assist the interpretation of these data can be found in the indicator interpretation boxes in the School education chapter and attachment tables.
Equity — Access indicators
Attendance and participation by target group
Years 7–10 attendance rate, all schools — comparison of the attendance rate of Aboriginal and Torres Strait Islander students with the attendance rate of non–Indigenous students, 2017 (per cent)
| NSW | Vic | Qld | WA | SA | Tas | ACT | NT | Aust | |
|---|---|---|---|---|---|---|---|---|---|
| Aboriginal and Torres Strait Islander students | 82.0 | 83.7 | 82.3 | 69.0 | 77.1 | 83.1 | 80.8 | 58.6 | 78.3 |
| Non-Indigenous students | 91.6 | 92.3 | 91.8 | 91.6 | 91.2 | 89.9 | 90.4 | 89.8 | 91.7 |
Effectiveness — Access indicators
Attendance and participation
Years 7–10 attendance rate, all students, 2017 (per cent)
| NSW | Vic | Qld | WA | SA | Tas | ACT | NT | Aust | |
|---|---|---|---|---|---|---|---|---|---|
| Government schools | 89.9 | 91.2 | 89.6 | 87.9 | 89.2 | 87.5 | 89.0 | 73.8 | 89.6 |
| Non–government schools | 92.7 | 93.4 | 93.4 | 93.2 | 92.7 | 92.4 | 91.5 | 81.4 | 92.9 |
| All schools | 91.1 | 92.2 | 91.0 | 90.1 | 90.5 | 89.3 | 90.2 | 76.6 | 91.0 |
Effectiveness — Appropriateness indicators
Retention
Apparent retention rate, year 10–12, the number of full time school students in year 10 that continue to year 12, 2016 (per cent)
| NSW | Vic | Qld | WA | SA | Tas | ACT | NT | Aust | |
|---|---|---|---|---|---|---|---|---|---|
| Government schools | 72.0 | 81.7 | 82.7 | 78.3 | 95.3 | 73.4 | 105.9 | 65.1 | 79.5 |
| Non–government schools | 85.0 | 89.5 | 94.8 | 83.7 | 93.3 | 66.1 | 77.6 | 62.4 | 87.9 |
| All schools | 77.2 | 85.0 | 87.3 | 80.5 | 94.5 | 70.8 | 92.2 | 64.2 | 82.9 |
Efficiency — Inputs per output unit indicators
Recurrent expenditure per student
Most recent data for these measures are comparable and complete, subject to caveats
Government expenditure per FTE student, government schools, 2015-16 — includes user cost of capital
| NSW | Vic | Qld | WA | SA | Tas | ACT | NT | Aust | |
|---|---|---|---|---|---|---|---|---|---|
| $ | 17 627 | 15 656 | 16 867 | 19 404 | 16 990 | 17 320 | 20 960 | 24 664 | 17 275 |
Government expenditure per FTE student, non‑government schools, 2015-16
| NSW | Vic | Qld | WA | SA | Tas | ACT | NT | Aust | |
|---|---|---|---|---|---|---|---|---|---|
| $ | 10 122 | 9 490 | 10 512 | 10 775 | 9 731 | 11 084 | 8 935 | 18 874 | 10 147 |
Outcome indicators
Student outcomes (national testing)
Most recent data for these measures are comparable and complete, subject to caveats
NAPLAN Reading — proportion of students achieving at or above national minimum standard, 2017 (per cent)
| NSW | Vic | Qld | WA | SA | Tas | ACT | NT | Aust | |
|---|---|---|---|---|---|---|---|---|---|
| All students — Year 3 | 95.5 ± 0.3 | 95.8 ± 0.4 | 95.5 ± 0.4 | 93.9 ± 0.6 | 93.1 ± 0.8 | 94.4 ± 0.9 | 95.6 ± 1.1 | 71.9 ± 6.1 | 94.9 ± 0.2 |
| All students — Year 9 | 93.2 ± 0.6 | 92.0 ± 0.7 | 90.8 ± 0.8 | 92.7 ± 1.1 | 89.1 ± 2.2 | 88.7 ± 2.0 | 93.9 ± 1.6 | 65.6 ± 9.9 | 91.7 ± 0.4 |
| Aboriginal and Torres Strait Islander students — Year 3 | 88.0 ± 1.4 | 88.7 ± 2.6 | 86.1 ± 1.7 | 75.0 ± 3.2 | 75.5 ± 3.9 | 89.1 ± 2.9 | 87.1 ± 6.9 | 43.3 ± 7.4 | 81.6 ± 1.3 |
| Aboriginal and Torres Strait Islander students — Year 9 | 79.4 ± 1.6 | 80.6 ± 3.1 | 71.6 ± 2.7 | 63.9 ± 4.2 | 65.8 ± 5.4 | 77.3 ± 4.7 | 83.8 ± 8.6 | 31.3 ± 9.8 | 70.6 ± 1.7 |
NAPLAN Numeracy — proportion of students achieving at or above national minimum standard, 2017 (per cent)
| NSW | Vic | Qld | WA | SA | Tas | ACT | NT | Aust | |
|---|---|---|---|---|---|---|---|---|---|
| All students — Year 3 | 96.0 ± 0.3 | 96.0 ± 0.4 | 95.7 ± 0.4 | 95.1 ± 0.5 | 93.0 ± 0.8 | 96.2 ± 0.8 | 96.7 ± 1.0 | 76.3 ± 5.8 | 95.4 ± 0.2 |
| All students — Year 9 | 96.4 ± 0.4 | 95.5 ± 0.6 | 96.0 ± 0.5 | 96.4 ± 0.7 | 94.3 ± 1.9 | 95.4 ± 1.2 | 96.2 ± 1.3 | 81.2 ± 6.7 | 95.8 ± 0.3 |
| Aboriginal and Torres Strait Islander students — Year 3 | 88.6 ± 1.3 | 89.7 ± 2.2 | 84.3 ± 2.2 | 77.4 ± 3.3 | 72.8 ± 4.0 | 93.4 ± 2.7 | 87.3 ± 6.3 | 49.7 ± 7.3 | 82.2 ± 1.3 |
| Aboriginal and Torres Strait Islander students — Year 9 | 88.1 ± 1.3 | 86.8 ± 2.9 | 86.5 ± 2.2 | 80.4 ± 3.9 | 80.0 ± 4.0 | 91.4 ± 3.3 | 89.5 ± 5.8 | 60.6 ± 8.6 | 84.0 ± 1.4 |
NAP Science literacy — proportion of all students achieving at or above the proficient standard, 2015 (per cent)
| NSW | Vic | Qld | WA | SA | Tas | ACT | NT | Aust | |
|---|---|---|---|---|---|---|---|---|---|
| Year 6 | 57.2 ± 3.6 | 53.6 ± 3.8 | 54.3 ± 4.6 | 57.7 ± 3.3 | 50.7 ± 3.9 | 59.1 ± 4.7 | 60.5 ± 5.1 | 31.8 ± 5.6 | 55.1 ± 1.8 |
NAP Civics and citizenship literacy — proportion of all students achieving at or above the proficient standard, 2016 (per cent)
| NSW | Vic | Qld | WA | SA | Tas | ACT | NT | Aust | |
|---|---|---|---|---|---|---|---|---|---|
| Year 6 | 56.3 ± 5.8 | 55.9 ± 5.3 | 52.2 ± 4.4 | 52.4 ± 5.3 | 55.2 ± 6.3 | 52.9 ± 5.6 | 59.5 ± 6.2 | 34.2 ± 8.0 | 54.5 ± 2.4 |
| Year 10 | 42.6 ± 4.9 | 38.9 ± 6.1 | 31.8 ± 6.3 | 43.3 ± 6.8 | 33.6 ± 5.5 | 30.2 ± 5.6 | 46.4 ± 5.1 | 23.1 ± 9.6 | 38.3 ± 2.7 |
Attainment
Year 12 certificate attainment rate, all students, 2016
| NSW | Vic | Qld | WA | SA | Tas | ACT | NT | Aust | |
|---|---|---|---|---|---|---|---|---|---|
| % | 73 | 80 | 72 | 77 | 92 | 60 | 79 | 50 | 76 |
Student outcomes (international testing)
Most recent data for these measures are comparable and complete, subject to caveats
Programme for International Student Assessment (PISA) — proportion of Australian 15 year old students who achieved at or above the national proficient standard, 2015 (per cent)
| NSW | Vic | Qld | WA | SA | Tas | ACT | NT | Aust | |
|---|---|---|---|---|---|---|---|---|---|
| Reading literacy | 59.5 ± 2.5 | 63.0 ± 3.3 | 59.7 ± 3.1 | 62.8 ± 3.3 | 60.5 ± 3.7 | 48.5 ± 4.1 | 65.1 ± 4.5 | 48.2 ± 7.3 | 60.6 ± 1.4 |
| Mathematical literacy | 54.8 ± 2.8 | 57.7 ± 3.4 | 52.8 ± 3.5 | 60.0 ± 4.1 | 53.5 ± 4.3 | 44.4 ± 4.3 | 61.3 ± 4.2 | 47.4 ± 6.8 | 55.4 ± 1.6 |
| Scientific literacy | 59.2 ± 2.3 | 62.8 ± 2.8 | 59.6 ± 2.9 | 65.5 ± 3.0 | 60.4 ± 3.9 | 48.3 ± 3.5 | 67.9 ± 3.6 | 50.8 ± 5.4 | 60.8 ± 1.2 |
Source: Attachment tables 4A.49–51
Trends in International Mathematics and Science Study (TIMSS) — proportion of students who achieved at or above the intermediate international benchmark, 2015 (per cent)
| NSW | Vic | Qld | WA | SA | Tas | ACT | NT | Aust | |
|---|---|---|---|---|---|---|---|---|---|
| Mathematical achievement — Year 4 | 69.9 ± 5.9 | 74.1 ± 4.3 | 68.8 ± 5.6 | 66.8 ± 7.0 | 69.5 ± 8.0 | 68.0 ± 10.2 | 82.3 ± 6.8 | 48.7 ± 13.8 | 70.2 ± 2.6 |
| Mathematical achievement — Year 8 | 62.7 ± 6.8 | 69.8 ± 4.1 | 62.3 ± 6.1 | 64.6 ± 5.3 | 61.9 ± 6.9 | 60.6 ± 7.3 | 69.9 ± 4.2 | 39.7 ± 10.2 | 64.4 ± 3.1 |
| Scientific achievement — Year 4 | 75.1 ± 5.5 | 77.7 ± 4.6 | 75.6 ± 4.9 | 70.0 ± 7.2 | 76.8 ± 7.2 | 75.7 ± 9.5 | 84.7 ± 5.6 | 57.8 ± 14.4 | 75.4 ± 2.7 |
| Scientific achievement — Year 8 | 68.4 ± 6.1 | 71.2 ± 3.2 | 67.3 ± 5.6 | 70.3 ± 4.9 | 66.9 ± 6.5 | 65.6 ± 7.9 | 75.8 ± 4.5 | 46.7 ± 12.4 | 68.8 ± 2.6 |
Progress in International Reading Literacy Study (PIRLS) — proportion of students who achieved at or above the intermediate international benchmark, 2016 (per cent)
| NSW | Vic | Qld | WA | SA | Tas | ACT | NT | Aust | |
|---|---|---|---|---|---|---|---|---|---|
| Year 4 | 80.4 ± 4.4 | 86.0 ± 3.1 | 78.3 ± 4.4 | 81.0 ± 4.3 | 74.5 ± 5.0 | 77.7 ± 6.2 | 82.0 ± 3.7 | 74.7 ± 11.1 | 80.9 ± 2.0 |
Destination
Proportion of school leavers aged 15–24 years who left school in 2016 and who in 2017 were fully engaged in further education, training and/or employment
| NSW | Vic | Qld | WA | SA | Tas | ACT | NT | Aust | |
|---|---|---|---|---|---|---|---|---|---|
| % | 80.6 ± 5.4 | 75.5 ± 3.6 | 63.5 ± 11.6 | 61.6 ± 11.5 | 64.4 ± 13.8 | 51.9 ± 21.4 | 73.3 ± 20.8 | 63.2 ± 32.5* | 69.3 ± 4.5 |
Notes
FTE = Full time equivalent. NAPLAN = National Assessment Program - Literacy and Numeracy.
These data and caveats for these data are available in chapter 4 and attachment 4A.
Some percentages reported in these tables include 95 per cent confidence intervals (for example, 80 per cent ± 2.7 per cent). Confidence intervals for the Student outcomes (national testing) indicator are calculated by ACARA and take into account sampling and measurement error. See definitions of key terms (section 4.4) for more information.
* Indicates the estimate or proportion has a relative standard error between 25 per cent and 50 per cent and should therefore be used with caution.
Performance indicator data for Aboriginal and Torres Strait Islander people in this chapter are available in the attachment tables listed below. Contextual data and further supporting information can be found in the chapter.
| Table number | Table title |
|---|---|
| Attendance and Participation | |
| Table 4A.18 | Student attendance rates, government schools, by Indigenous status (per cent) |
| Table 4A.19 | Student attendance rates, non-government schools, by Indigenous status (per cent) |
| Table 4A.20 | Student attendance rates, all schools, by Indigenous status (per cent) |
| Table 4A.21 | Student attendance rates, by Indigenous status and remoteness, 2017 (per cent) |
| Table 4A.22 | Student attendance level, government schools, by Indigenous status (per cent) |
| Table 4A.23 | Student attendance level, non-government schools, by Indigenous status (per cent) |
| Table 4A.24 | Student attendance level, by Indigenous status and remoteness, 2017 (per cent) |
| Retention | |
| Table 4A.25 | Apparent retention rates of full time secondary students, all schools (per cent) |
| Table 4A.26 | Apparent retention rates of full time secondary students, government schools (per cent) |
| Table 4A.27 | Apparent retention rates of full time secondary students, non-government schools (per cent) |
| NAPLAN reading | |
| Table 4A.28 | NAPLAN reading: Proportion of students who achieved at or above the national minimum standard, by Indigenous status and geolocation (per cent) |
| Table 4A.29 | NAPLAN reading: Mean scores, by Indigenous status and geolocation (score points) |
| NAPLAN writing | |
| Table 4A.32 | NAPLAN writing: Proportion of students who achieved at or above the national minimum standard, by Indigenous status and geolocation (per cent) |
| Table 4A.33 | NAPLAN writing: Mean scores, by Indigenous status and geolocation, 2017 (score points) |
| NAPLAN numeracy | |
| Table 4A.36 | NAPLAN numeracy: Proportion of students who achieved at or above the national minimum standard, by Indigenous status and geolocation (per cent) |
| Table 4A.37 | NAPLAN numeracy: Mean scores, by Indigenous status and geolocation, 2017 (score points) |
| NAP | |
| Table 4A.42 | National Assessment Program, proportion of Year 6 students at or above proficient standard in science achievement performance, by equity group, Australia |
| Table 4A.45 | National Assessment Program, proportion of students at or above proficient standard in civics and citizenship achievement performance, by equity group, Australia |
| Table 4A.48 | National Assessment Program, information and communication technologies: proportion of students attaining the proficient standard, by equity group, Australia |