Report on Government Services 2018
Part C, Chapter 7
Courts
The focus of this chapter is the court administration functions of Australian and State and Territory courts.
Data are reported for the Federal Court, the Family Court of Australia and the Federal Circuit Court, the criminal and civil jurisdictions of the supreme courts (including probate registries), district/county courts, magistrates' courts (including children's courts), coroners' courts and the Family Court of WA.
Download the chapter
- Chapter 7 Courts and attachment tables (PDF - 2851 Kb)
- Chapter 7 Courts (Word - 589 Kb)
- Chapter 7 Attachment tables (XLSX - 844 Kb)
- Key Facts
- Indicator Framework
- Indicator Results
In 2016-17, in the criminal jurisdiction of the supreme, district/county, magistrates’ and children’s courts, approximately 825 202 cases were lodged, and 864 923 cases were finalised.
In the civil jurisdiction of these same courts approximately 436 333 cases were lodged and 440 523 cases finalised.
In the Australian courts, approximately 121 961 cases were lodged, and 117 027 cases finalised.
Total court administration recurrent expenditure less income (excluding fines) by the court authorities covered in this chapter was approximately $1.4 billion in 2016-17, comprising $1.2 billion for the State and Territory courts and $214.6 million for the Australian courts.
Courts aim to safeguard and maintain the rule of law and ensure equal justice for all. Court services support the courts and aim to encourage public confidence and trust in the courts by enabling them to:
- be open and accessible
- be affordable
- process matters in a high quality, expeditious and timely manner.
Governments aim for court services to meet these objectives in an equitable and efficient manner.
The performance indicator framework provides information on equity, efficiency and effectiveness, and distinguishes the outputs and outcomes of courts. The performance indicator framework shows which data are complete and comparable in the 2018 Report.
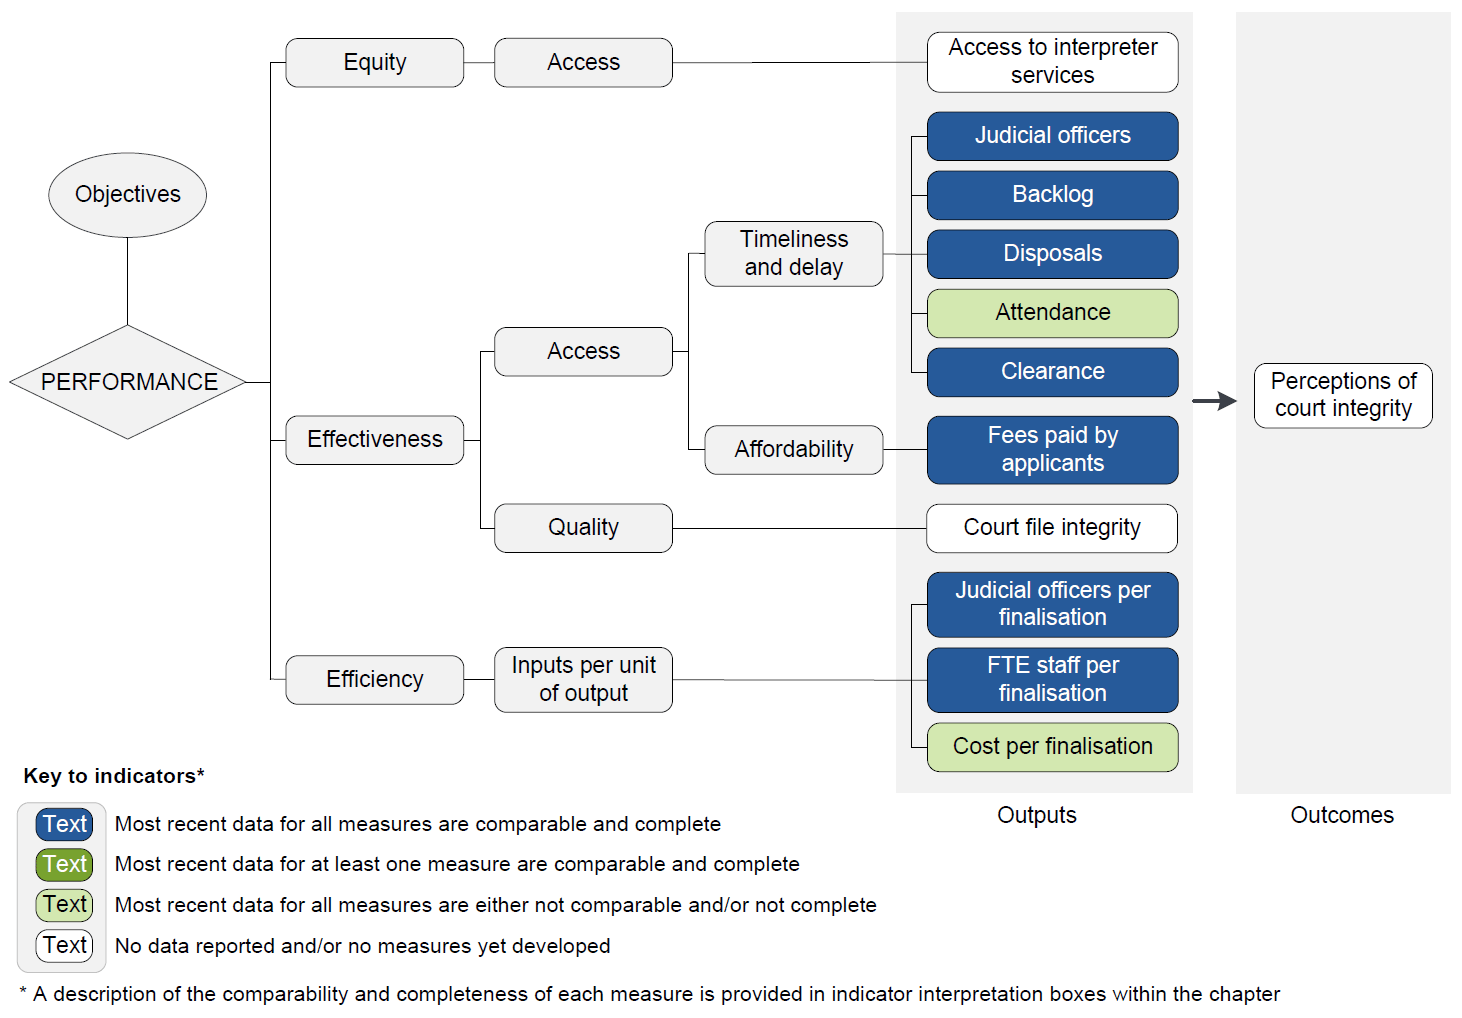
An overview of the Courts performance indicator results are presented. Information to assist the interpretation of these data can be found in the indicator interpretation boxes in the Courts chapter and attachment tables.
Effectiveness — Access — Timeliness and delay indicators
Judicial officers
Number of FTE judicial officers, per 100 000 people, 2016-17
| NSW | Vic | Qld | WA | SA | Tas | ACT | NT | Aus Gov | Aust | |
|---|---|---|---|---|---|---|---|---|---|---|
| Supreme/Federal | 0.7 | 0.9 | 0.5 | 0.9 | 0.8 | 1.4 | 1.6 | 3.4 | 0.2 | 1.0 |
| District/County | 0.9 | 1.0 | 0.7 | 1.1 | 1.1 | .. | .. | .. | .. | 0.9 |
| Magistrates’ | 1.4 | 1.8 | 1.8 | 1.8 | 1.9 | 2.0 | 1.7 | 5.8 | .. | 1.7 |
| Children’s | 0.4 | 0.2 | 0.1 | 0.2 | 0.2 | 0.3 | 0.2 | 0.7 | .. | 0.2 |
| Family | .. | .. | .. | 0.6 | .. | .. | .. | .. | 0.1 | 0.2 |
| Federal Circuit | .. | .. | .. | .. | .. | .. | .. | .. | 0.3 | 0.3 |
| Coroners’ | 0.1 | 0.1 | 0.2 | 0.2 | 0.1 | 0.5 | – | 0.6 | .. | 0.1 |
| Total | 3.5 | 4.1 | 3.3 | 4.7 | 4.2 | 4.2 | 3.6 | 10.6 | 0.6 | 4.4 |
Backlog
Percentage of criminal lodgments pending completion at 30 June 2017 (per cent)
| NSW | Vic | Qld | WA | SA | Tas | ACT | NT | Aus Gov | Aust | |
|---|---|---|---|---|---|---|---|---|---|---|
| Supreme (appeal) >12 months | 0.7 | 2.4 | 12.2 | 10.4 | 10.7 | 17.6 | 24.7 | 25.0 | .. | .. |
| Supreme (appeal) >24 months | – | 0.5 | 2.5 | 3.6 | 6.6 | – | 3.7 | – | .. | .. |
| Supreme (non-appeal) >12 months | 31.9 | 25.6 | 10.7 | 10.0 | 12.8 | 29.0 | 14.7 | 10.5 | .. | .. |
| Supreme (non-appeal) >24 months | 9.2 | 15.1 | 2.5 | 3.7 | – | 8.9 | 3.0 | 1.3 | .. | .. |
| District (appeal) >12 months | 1.7 | 3.9 | 20.9 | .. | .. | .. | .. | .. | .. | .. |
| District (appeal) >24 months | 0.2 | 0.6 | 8.3 | .. | .. | .. | .. | .. | .. | .. |
| District (non-appeal) >12 months | 22.3 | 15.1 | 14.0 | 10.4 | 28.8 | .. | .. | .. | .. | .. |
| District (non-appeal) >24 months | 5.4 | 2.6 | 4.3 | 1.2 | 9.8 | .. | .. | .. | .. | .. |
| Magistrates' >6 months | 14.0 | 26.0 | 36.8 | 34.7 | 28.6 | 34.6 | 16.6 | 20.9 | .. | .. |
| Magistrates' >12 months | 1.7 | 9.5 | 16.7 | 11.9 | 9.2 | 12.6 | 5.3 | 7.2 | .. | .. |
| Children's >6 months | 16.7 | 14.3 | 24.1 | 16.7 | 11.8 | 16.3 | 22.6 | 20.1 | .. | .. |
| Children's >12 months | 1.6 | 3.8 | 9.5 | 4.7 | 5.1 | 5.4 | 6.6 | 8.0 | .. | .. |
Percentage of civil lodgments pending completion at 30 June 2017 (per cent)
| NSW | Vic | Qld | WA | SA | Tas | ACT | NT | Aus Gov | Aust | |
|---|---|---|---|---|---|---|---|---|---|---|
| Supreme (appeal) >12 months | 8.7 | 12.8 | 1.4 | 26.6 | 25.2 | 18.3 | 29.7 | 18.8 | 12.4 | .. |
| Supreme (appeal) >24 months | 1.6 | 3.0 | 0.7 | 6.4 | 3.9 | 5.6 | 16.2 | 1.4 | 2.1 | .. |
| Supreme (non-appeal) >12 months | 32.7 | 36.5 | 23.7 | 34.4 | 31.8 | 36.2 | 27.8 | 28.4 | 36.9 | .. |
| Supreme (non-appeal) >24 months | 13.2 | 19.1 | 7.0 | 12.0 | 13.2 | 9.8 | 8.9 | 7.8 | 20.9 | .. |
| District (appeal) >12 months | 8.3 | 20.0 | 27.0 | 15.6 | 36.1 | .. | .. | .. | .. | .. |
| District (appeal) >24 months | – | – | 17.5 | 1.3 | 2.8 | .. | .. | .. | .. | .. |
| District (non-appeal) >12 months | 17.5 | 37.9 | 21.5 | 37.9 | 42.8 | .. | .. | .. | .. | .. |
| District (non-appeal) >24 months | 3.7 | 18.6 | 4.1 | 13.6 | 21.2 | .. | .. | .. | .. | .. |
| Magistrates' >6 months | 20.6 | 34.2 | 38.2 | 37.3 | 43.2 | 41.0 | 34.1 | 45.6 | .. | .. |
| Magistrates' >12 months | 1.0 | 24.8 | 8.2 | 8.3 | 11.5 | 12.4 | 9.4 | 18.1 | .. | .. |
| Children's >6 months | 35.6 | 24.0 | 40.4 | 48.5 | 9.8 | 20.3 | 30.2 | 18.0 | .. | .. |
| Children's >12 months | 14.6 | 10.5 | 14.8 | 16.6 | 0.5 | 10.2 | 11.3 | 3.1 | .. | .. |
| Family (appeal) >12 months | .. | .. | .. | – | .. | .. | .. | .. | 19.2 | .. |
| Family (appeal) >24 months | .. | .. | .. | – | .. | .. | .. | .. | 2.9 | .. |
| Family (non-appeal) >12 months | .. | .. | .. | 32.5 | .. | .. | .. | .. | 32.3 | .. |
| Family (non-appeal) >24 months | .. | .. | .. | 10.1 | .. | .. | .. | .. | 14.4 | .. |
| Federal Circuit >6 months | .. | .. | .. | .. | .. | .. | .. | .. | 39.4 | .. |
| Federal Circuit >12 months | .. | .. | .. | .. | .. | .. | .. | .. | 18.2 | .. |
| Coroners >12 months | 23.5 | 28.2 | 36.9 | 16.6 | 37.0 | 38.9 | 42.1 | 31.6 | .. | .. |
| Coroners >24 months | 9.9 | 10.5 | 16.6 | 6.4 | 13.1 | 15.5 | 20.7 | 23.3 | .. | .. |
Source: Attachment table 7A.18
Disposals
Percentage of criminal cases finalised during the year which took longer than 6, 12 or 24 months to finalise, 2016-17
| NSW | Vic | Qld | WA | SA | Tas | ACT | NT | Aus Gov | Aust | |
|---|---|---|---|---|---|---|---|---|---|---|
| Supreme (appeal) >12 mths | 3.4 | 12.4 | 11.7 | 24.3 | 6.9 | 37.8 | 22.3 | 50.0 | .. | .. |
| Supreme (appeal) >24 mths | – | 1.1 | 1.0 | 2.4 | – | 10.8 | 2.1 | – | .. | .. |
| Supreme (non-appeal) >12 mths | 51.5 | 30.0 | 8.0 | 7.3 | 32.6 | 37.5 | 29.6 | 9.1 | .. | .. |
| Supreme (non-appeal) >24 mths | 9.9 | 0.8 | 1.2 | 1.7 | 2.3 | 11.7 | 4.2 | 2.7 | .. | .. |
| District (appeal) >12 mths | 11.8 | 2.4 | 16.8 | .. | .. | .. | .. | .. | .. | .. |
| District (appeal) >24 mths | 2.0 | 0.1 | 6.7 | .. | .. | .. | .. | .. | .. | .. |
| District (non-appeal) >12 mths | 73.0 | 17.4 | 7.6 | 13.5 | 22.8 | .. | .. | .. | .. | .. |
| District (non-appeal) >24 mths | 40.2 | 3.3 | 2.0 | 1.1 | 7.4 | .. | .. | .. | .. | .. |
| Magistrates' >6 mths | 12.3 | 25.5 | 17.1 | 17.1 | 30.1 | 40.8 | 24.0 | 16.0 | .. | .. |
| Magistrates' >12 mths | 1.7 | 9.3 | 6.7 | 7.2 | 12.6 | 15.2 | 7.8 | 5.9 | .. | .. |
| Children's >6 mths | 19.5 | 7.8 | 14.0 | 27.4 | 19.1 | 26.7 | 14.7 | 25.5 | .. | .. |
| Children's >12 mths | 2.9 | 2.2 | 4.7 | 7.4 | 6.6 | 8.5 | 4.6 | 6.7 | .. | .. |
Percentage of civil cases finalised during the year which took longer than 6, 12 or 24 months to finalise, 2016-17
| NSW | Vic | Qld | WA | SA | Tas | ACT | NT | Aus Gov | Aust | |
|---|---|---|---|---|---|---|---|---|---|---|
| Supreme (appeal) >12 mths | 15.5 | 21.8 | 12.2 | 28.0 | 37.0 | 29.6 | 50.0 | 8.3 | 12.7 | .. |
| Supreme (appeal) >24 mths | 2.5 | 1.1 | 2.4 | 4.2 | 3.7 | 18.3 | 26.0 | 2.8 | 1.0 | .. |
| Supreme (non-appeal) >12 mths | 20.2 | 25.9 | 49.6 | 36.8 | 22.6 | 62.9 | 44.6 | 29.5 | 12.5 | .. |
| Supreme (non-appeal) >24 mths | 7.8 | 10.1 | 7.4 | 10.6 | 7.4 | 15.0 | 14.0 | 10.1 | 6.2 | .. |
| District (appeal) >12 mths | 9.4 | 3.1 | 12.2 | 16.5 | 16.7 | .. | .. | .. | .. | .. |
| District (appeal) >24 mths | – | 1.5 | 4.1 | 4.6 | 1.9 | .. | .. | .. | .. | .. |
| District (non-appeal) >12 mths | 37.8 | 48.0 | 58.0 | 30.7 | 52.0 | .. | .. | .. | .. | .. |
| District (non-appeal) >24 mths | 8.7 | 10.3 | 5.5 | 10.5 | 28.1 | .. | .. | .. | .. | .. |
| Magistrates' >6 mths | 38.7 | 4.6 | 31.5 | 24.0 | 46.3 | 46.7 | 15.8 | 17.5 | .. | .. |
| Magistrates' >12 mths | 2.7 | 1.6 | 25.3 | 19.6 | 33.3 | 13.0 | 6.6 | 1.8 | .. | .. |
| Children's >6 mths | 39.2 | 19.1 | 21.2 | 35.1 | 2.3 | 15.3 | 30.3 | 16.7 | .. | .. |
| Children's >12 mths | 8.8 | 5.7 | 7.3 | 20.2 | 0.2 | 3.4 | 11.1 | 0.4 | .. | .. |
| Family (appeal) >12 months | .. | .. | .. | – | .. | .. | .. | .. | 24.7 | .. |
| Family (appeal) >24 months | .. | .. | .. | – | .. | .. | .. | .. | 5.6 | .. |
| Family (non-appeal) >12 months | .. | .. | .. | 21.8 | .. | .. | .. | .. | 6.5 | .. |
| Family (non-appeal) >24 months | .. | .. | .. | 6.0 | .. | .. | .. | .. | 2.7 | .. |
| Federal Circuit >6 months | .. | .. | .. | .. | .. | .. | .. | .. | 23.5 | .. |
| Federal Circuit >12 months | .. | .. | .. | .. | .. | .. | .. | .. | 10.0 | .. |
| Coroners >12 months | 10.1 | 19.7 | 9.0 | 39.5 | 31.7 | 59.6 | 7.9 | 27.3 | 10.1 | .. |
| Coroners >24 months | 2.0 | 6.1 | 2.7 | 4.7 | 4.5 | 17.5 | 4.3 | 6.9 | 2.0 | .. |
Attendance
Average number of attendances per finalisation, criminal courts, 2016‑17
| NSW | Vic | Qld | WA | SA | Tas | ACT | NT | Aus Gov | Aust | |
|---|---|---|---|---|---|---|---|---|---|---|
| Supreme | na | na | 2.9 | 3.2 | 4.2 | 5.4 | 5.9 | 6.7 | .. | .. |
| District/County | 3.1 | 4.4 | 4.0 | 4.0 | 6.1 | .. | .. | .. | .. | .. |
| Magistrates' | 2.7 | 2.6 | 3.5 | 2.7 | 4.2 | 4.2 | 4.1 | 3.3 | .. | .. |
| Children's | 3.9 | 2.0 | 4.0 | 4.1 | 4.3 | 4.9 | 4.7 | 5.3 | .. | .. |
Average number of attendances per finalisation, civil courts, 2016‑17
| NSW | Vic | Qld | WA | SA | Tas | ACT | NT | Aus Gov | Aust | |
|---|---|---|---|---|---|---|---|---|---|---|
| Supreme/Federal | na | na | 1.2 | 1.9 | 3.1 | 1.6 | 5.4 | 6.0 | 3.0 | .. |
| District/County | 3.3 | 0.6 | 0.3 | 1.1 | 2.8 | .. | .. | .. | .. | .. |
| Magistrates' | 0.9 | 1.2 | 1.2 | 0.8 | 1.1 | 1.2 | 2.1 | 1.3 | .. | .. |
| Children's | 4.8 | 1.8 | 3.6 | 5.0 | 2.8 | 4.8 | 8.7 | 4.3 | .. | .. |
| Family | .. | .. | .. | 2.2 | .. | .. | .. | .. | 2.0 | .. |
| Federal Circuit | .. | .. | .. | .. | .. | .. | .. | .. | 2.0 | .. |
| Coroners | 6.8 | 1.5 | 4.8 | 2.7 | 1.3 | 3.1 | 7.1 | 1.0 | .. | .. |
Clearance
Finalisations divided by lodgments (multiplied by 100 to provide percentage), all matters, 2016‑17
| NSW | Vic | Qld | WA | SA | Tas | ACT | NT | Aus Gov | Aust | |
|---|---|---|---|---|---|---|---|---|---|---|
| Supreme/Federal | 102.4 | 105.3 | 91.4 | 90.9 | 94.8 | 95.7 | 107.4 | 99.0 | 98.9 | .. |
| District/County | 100.6 | 98.5 | 98.1 | 94.2 | 101.6 | .. | .. | .. | .. | .. |
| Magistrates' | 102.5 | 111.1 | 100.1 | 103.5 | 103.1 | 95.3 | 79.9 | 109.4 | .. | .. |
| Children’s | 102.0 | 107.2 | 96.4 | 109.2 | 108.3 | 90.5 | 99.1 | 98.0 | .. | .. |
| Family | .. | .. | .. | 92.3 | .. | .. | .. | .. | 97.8 | .. |
| Federal Circuit | .. | .. | .. | .. | .. | .. | .. | .. | 95.4 | .. |
| Coroners | 94.5 | 100.6 | 89.7 | 99.9 | 72.9 | 100.5 | 102.0 | 118.5 | .. |
Effectiveness — Access — Affordability indicators
Fees paid by applicants
Average civil court fees collected per lodgment, 2016-17 (dollars)
| NSW | Vic | Qld | WA | SA | Tas | ACT | NT | Aus Gov | Aust | |
|---|---|---|---|---|---|---|---|---|---|---|
| Supreme/Federal | 3 818 | 2 110 | 2 282 | 2 646 | 2 941 | 710 | 3 092 | 2 525 | 2 661 | 2 780 |
| District/County | 1 899 | 1 889 | 1 059 | 1 213 | 1 055 | .. | .. | .. | .. | 1 535 |
| Magistrates' (only) | 217 | 227 | 122 | 155 | 134 | 86 | 271 | 18 | .. | 185 |
| Family | .. | .. | .. | 384 | .. | .. | .. | .. | 260 | 314 |
| Federal Circuit | .. | .. | .. | .. | .. | .. | .. | .. | 611 | 611 |
| Probate ‑ Supreme | 1 450 | 383 | 660 | 347 | 1 611 | 687 | 1 322 | 1 215 | .. | 922 |
Efficiency indicators
Judicial officers per finalisation
Full time equivalent judicial officers divided by total finalisations (multiplied by 100), 2016-17
| NSW | Vic | Qld | WA | SA | Tas | ACT | NT | Aus Gov | Aust | |
|---|---|---|---|---|---|---|---|---|---|---|
| Supreme/Federal | 0.70 | 0.89 | 0.44 | 0.70 | 0.95 | 0.55 | 0.64 | 1.06 | 0.79 | 0.72 |
| District/County | 0.36 | 0.55 | 0.29 | 0.37 | 0.48 | .. | .. | .. | .. | 0.40 |
| Magistrates' | 0.03 | 0.04 | 0.03 | 0.03 | 0.05 | 0.05 | 0.08 | 0.07 | .. | 0.04 |
| Children's | 0.14 | 0.05 | 0.04 | 0.05 | 0.07 | 0.10 | 0.20 | 0.07 | .. | 0.07 |
| Family | .. | .. | .. | 0.10 | .. | .. | .. | .. | 0.16 | 0.13 |
| Federal Circuit | .. | .. | .. | .. | .. | .. | .. | .. | 0.07 | 0.07 |
| Coroners | 0.09 | 0.14 | 0.16 | 0.16 | 0.11 | 0.48 | 0.05 | 0.45 | .. | 0.14 |
| Total | 0.07 | 0.07 | 0.05 | 0.06 | 0.08 | 0.08 | 0.13 | 0.11 | 0.12 | 0.07 |
Full time equivalent staff (FTE) per finalisation
Full time equivalent staff divided by total finalisations (multiplied by 100), 2016-17
| NSW | Vic | Qld | WA | SA | Tas | ACT | NT | Aus Gov | Aust | |
|---|---|---|---|---|---|---|---|---|---|---|
| Criminal courts | 0.6 | 0.4 | 0.3 | 0.4 | 0.7 | 0.5 | 1.1 | 0.5 | .. | 0.5 |
| Civil courts | 0.6 | 0.6 | 0.4 | 0.6 | 0.6 | 0.5 | 1.3 | 0.6 | 5.4 | 0.6 |
| Family courts | .. | .. | .. | 0.9 | .. | .. | .. | .. | 1.0 | 1.0 |
| Federal Circuit | .. | .. | .. | .. | .. | .. | .. | .. | 0.6 | 0.6 |
| Coroners | 0.7 | 1.3 | 1.2 | 1.3 | 1.2 | 1.0 | 1.5 | 1.5 | .. | 1.1 |
| Total | 0.6 | 0.5 | 0.3 | 0.5 | 0.7 | 0.5 | 1.2 | 0.6 | 0.9 | 0.5 |
Cost per finalisation
Total recurrent expenditure (minus income) divided by total finalisations, criminal, 2016-17 (dollars)
| NSW | Vic | Qld | WA | SA | Tas | ACT | NT | Aus Gov | Aust | |
|---|---|---|---|---|---|---|---|---|---|---|
| Supreme | 40 666 | 61 600 | 7 152 | 25 348 | 32 294 | 16 601 | 29 261 | 23 980 | .. | 21 058 |
| District/County | 6 846 | 16 496 | 7 160 | 16 885 | 9 657 | .. | .. | .. | .. | 9 703 |
| Magistrates' | 562 | 547 | 438 | 639 | 828 | 494 | 1 348 | 994 | .. | 563 |
| Children's | 881 | 230 | 810 | 553 | 546 | 682 | 2 473 | 863 | .. | 574 |
Total recurrent expenditure (minus income) divided by total finalisations, civil, 2016-17 (dollars)
| NSW | Vic | Qld | WA | SA | Tas | ACT | NT | Aus Gov | Aust | |
|---|---|---|---|---|---|---|---|---|---|---|
| Supreme/Federal | 4 264 | 7 681 | 5 223 | 12 085 | 4 790 | 4 567 | 5 550 | 17 164 | 14 125 | 7 978 |
| District/County | 2 602 | 3 721 | 1 629 | 2 256 | 3 009 | .. | .. | .. | .. | 2 661 |
| Magistrates' | 228 | 319 | 304 | 453 | 202 | 261 | 1 289 | 903 | .. | 314 |
| Children's | 868 | 2 455 | 793 | 1 699 | 1 354 | 639 | 4 598 | 1 188 | .. | 1 460 |
| Family | .. | .. | .. | 1 649 | .. | .. | .. | .. | 2 273 | 2 011 |
| Federal Circuit | .. | .. | .. | .. | .. | .. | .. | .. | 971 | 971 |
| Coroners | 1 123 | 2 105 | 2 052 | 2 774 | 1 781 | 2 156 | 2 985 | 2 873 | .. | 1 904 |
Notes
These data and caveats for these data are available in Chapter 7 and Attachment 7A.
na Not available. .. Not applicable. – Nil or rounded to zero.