Report on Government Services 2019
Part G, Section 19: Presentation revised on 27 June 2019
19 Homelessness services
The presentation of this section has been updated since its release on 22 January 2019. To access material in the original format please refer to the archived copy
This section focuses on specialist homelessness services funded by government under the Council of Australian Governments (COAG) National Affordable Housing Agreement (NAHA) and National Partnership Agreement on Homelessness (NPAH). A new National Housing and Homelessness Agreement came into effect from 1 July 2018. Other non-specialist homelessness services are not included in this Report.
The Indicator Results tab uses data from the data tables to provide information on the performance for each indicator in the Indicator Framework (the same data are also available in CSV format). You can download the specific chart data directly from the visualisations by clicking in the graph area and using the 'download' menu, you can also select 'PDF' to download a PDF version of the charts.
Skip to Homelessness services data tables and supporting material
- Context
- Indicator Framework
- Indicator Results
- Indigenous Data
Objectives for specialist homelessness services
The specialist homelessness services system aims to support people who are homeless or at risk of homelessness to achieve sustainable housing, social inclusion and greater economic participation — re-establishing their capacity to live independently — through the delivery of transitional supported accommodation and a range of related support services that:
- are accessible
- identify and address individuals’ needs as appropriate
- are of high quality, provided by qualified staff in a safe environment.
Governments aim for specialist homelessness services to meet these objectives in an equitable and efficient manner.
Service overview
Government and non-government specialist homelessness service providers deliver a range of services to clients — including supported accommodation, counselling, advocacy, links to housing, health, education and employment services, outreach support, brokerage and meals services, and financial and employment assistance.
Accessing homelessness services in Australia
Systems for the assessment, intake, referral and ongoing case management of specialist homelessness services clients vary across states and territories, ranging from agency-based to centralised management models. This variation may affect data for specific performance indicators. Three broad summary categories are identified here — table 19A.38 summarises the intake and referral systems used in each jurisdiction and identifies the category with which they most closely align.
- Community sector funding and support — Assessment of client needs and intake into services is managed by individual specialist homelessness service providers in line with State or Territory policies. Referral to other service providers is made if clients’ needs are not able to be met by the initial provider. These systems may be supported by a coordinating service that links clients to local specialist homelessness service providers. Coordinating services may also make an initial assessment of clients’ needs (but do not provide homelessness services directly).
- Central information management — Assessment of client needs, intake and referral is managed by any specialist homelessness service provider using State/Territory central information management tools. The central information management system supports the identification of appropriate services for the client and indicates the availability/vacancy of those services across specialist homelessness service providers. Client information may be shared between providers upon referral (with client consent).
- Central intake — Assessment of client needs, intake and referral is managed by one or more ‘central intake’ agencies. Central intake agencies prioritise client access to services and, for specialist homelessness services, only refer clients as services and/or vacancies are available. Central information management tools may be used to share information between central intake agencies and specialist homelessness service providers.
Roles and responsibilities
The NAHA commenced on 1 January 2009. To support the NAHA, a series of one- to three-year NPAHs were negotiated between the Australian Government and each State and Territory government. The NPAH contributes to the NAHA outcome to help ‘people who are homeless or at risk of homelessness achieve sustainable housing and social inclusion’ (COAG 2012, 2015). The NPAH aims to achieve the following outcomes:
- fewer people will become homeless
- fewer people will become homeless more than once
- people at risk of or experiencing homelessness will maintain or improve connections with their families and communities, and maintain or improve their education, training or employment participation
- people at risk of or experiencing homelessness will be supported by quality services, with improved access to sustainable housing (COAG 2015).
As part of broader COAG reforms, the NPAH clarified that State and Territory governments are responsible for day to day delivery of services. It also established an agreed set of desired outcomes for homelessness services, focused on improving the delivery of services to prevent and respond to homelessness.
Government funded specialist homelessness services are jointly funded by the Australian Government and State and Territory governments, via the National Affordable Housing Specific Purpose Payment (for housing and homelessness services) and the NPAH (for housing and support services for people who are homeless or at risk of homelessness — matched equally between the Australian Government and State and Territory governments).
Funding
Direct expenditure on specialist homelessness services is undertaken by State and Territory governments. Recurrent government expenditure on specialist homelessness services for 2017-18 was $905.1 million (or $36.54 per person in the population; table 19A.1) — 96.2 per cent of which was provided to agencies to deliver specialist homelessness services. The remaining 3.8 per cent was attributed to State/Territory government administration costs (table 19A.1).
Size and scope
Population
Data on the prevalence of homelessness are sourced from the Australian Bureau of Statistics (ABS 2018).
Nationally in 2016, approximately 49.8 Australians per 10 000 people in the population were homeless on Census night — an increase of 4.6 per cent from 2011 (table 19A.2).
Under the ABS definition for homelessness, there are six homeless operational groups (rates are provided in table 19A.2). The proportion of the homeless population in each group varies. In 2016, people living in supported accommodation provided by specialist homelessness service providers comprised approximately 18.2 per cent of the homeless population. The majority of homeless people were ‘persons living in severely crowded dwellings’ (43.9 per cent) (see section 19.4 for what constitutes ‘severely crowded’). Similar proportions of homeless people were staying temporarily in other households (15.2 per cent) and in boarding houses (15.0 per cent). Only 7.0 per cent of homeless people were in improvised dwellings, tents or sleepers out and 0.6 per cent were in other temporary lodgings on Census night 2016 (ABS unpublished).
Services
References
ABS 2012, Information Paper: A Statistical Definition of Homelessness, Cat. no. 4922.0, Canberra.
—— 2018, Census of Population and Housing: Estimating homelessness, 2016, Cat. no. 20492.0, Canberra.
COAG (Council of Australian Governments) 2012, National Affordable Housing Agreement, viewed 26 August 2016, www.federalfinancialrelations.gov.au/content/national_agreements.aspx.
—— 2015 National Partnership Agreement On Homelessness — 2015–2017, viewed 18 August 2016
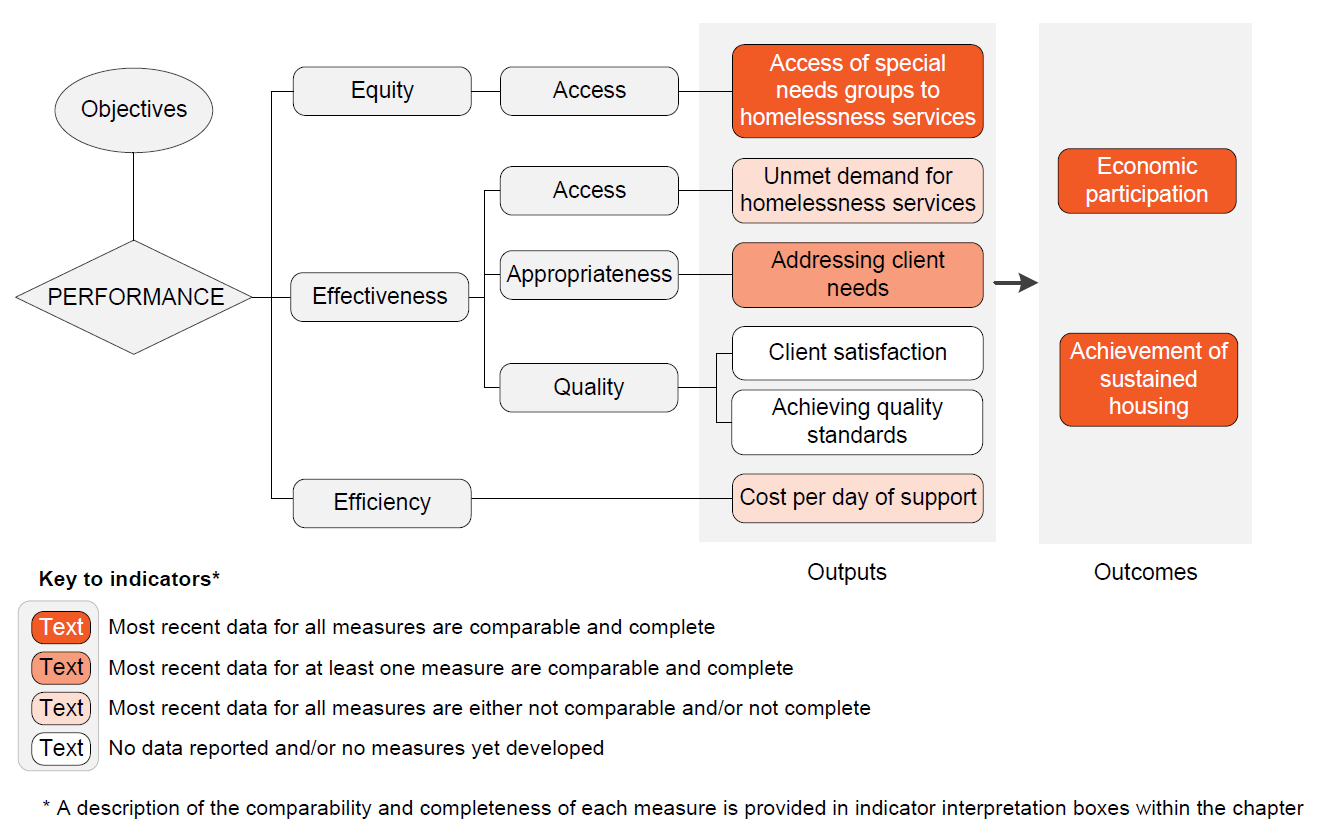
The performance indicator framework provides information on equity, efficiency and effectiveness, and distinguishes the outputs and outcomes of homelessness services.
The performance indicator framework shows which data are complete and comparable. For data that are not considered directly comparable, text includes relevant caveats and supporting commentary. Section 1 discusses data comparability and completeness from a Report-wide perspective. In addition to the service area's Profile information, the Report’s statistical context chapter (Section 2 contains data that may assist in interpreting the performance indicators presented in this section.
Improvements to performance reporting for specialist homelessness services are ongoing and include identifying data sources to fill gaps in reporting for performance indicators and measures, and improving the comparability and completeness of data.
Outputs
Outputs are the actual services delivered (while outcomes are the impact of these services on the status of an individual or group) (see section 1). Output information is also critical for equitable, efficient and effective management of government services.
Outcomes
Outcomes are the impact of services on the status of an individual or group (see section 1).
An overview of the Homelessness services performance indicator results are presented. Different delivery contexts, locations and types of clients can affect the equity, effectiveness and efficiency of homelessness services.
Information to assist the interpretation of these data can be found in the Homelessness services supporting interpretative material and data tables. Web references to the AIHW data quality statements for the specialist homelessness services collection are available in the relevant data table. Data tables are identified by a ‘19A’ prefix (for example, table 19A.1) and all data are available for download as an excel spreadsheet and as a CSV dataset.
Performance indicator data for Aboriginal and Torres Strait Islander people in this section are available in the data tables listed below. Further supporting information can be found in the interpretative material and data tables.
| Table number | Table title |
|---|---|
| Table 19A.4 | Proportion of clients — with accommodation and services other than accommodation needs that were met — who were Aboriginal and Torres Strait Islander clients |
| Table 19A.10 | Proportion of closed support periods with an agreed case management plan, Aboriginal and Torres Strait Islander clients |
| Table 19A.11 | Support needs of clients, summary (closed support periods) |
| Table 19A.13 | Support needs of clients, by service assistance type, Aboriginal and Torres Strait Islander clients (closed support periods) |
| Table 19A.19 | Economic participation, before and after support, clients aged 15 years or over (closed support periods) |
| Table 19A.20 | Labour force status, before and after support (closed support periods), clients aged 15 years or over |
| Table 19A.22 | Labour force status, before and after support, as a proportion of Aboriginal and Torres Strait Islander clients who needed employment and/or training assistance (closed support periods) |
| Table 19A.27 | Income status, before and after support, clients aged 15 years or over (closed support periods) |
| Table 19A.29 | Income status, before and after support, as a proportion of Aboriginal and Torres Strait Islander clients who needed income assistance (closed support periods) |
| Table 19A.30 | Independent housing, before and after support (closed support periods) |
| Table 19A.32 | Housing tenure type, before and after support, as a proportion of Aboriginal and Torres Strait Islander clients who needed assistance to obtain or maintain independent housing (closed support periods) |
| Table 19A.35 | The proportion of Aboriginal and Torres Strait Islander clients who needed assistance to obtain or maintain independent housing and achieved it at the end of support, who did not present again with a need for accommodation assistance in the reporting period |
| Table 19A.36 | Proportion of Aboriginal and Torres Strait Islander clients experiencing homelessness, who had repeat periods of homelessness |
Download supporting material
- 19 Homelessness services interpretative material (PDF - 318 Kb)
- 19 Homelessness services interpretative material (Word - 96 Kb)
- 19 Homelesness data tables (XLSX - 832 Kb)
- 19 Homelessness services dataset (CSV - 924 Kb)
See the interpretative material and corresponding table number in the data tables for detailed definitions, caveats, footnotes and data source(s).
Note: An errata was released for section 19 data tables above.
Errata
The following recurrent cost per completed support period data have changed in table 19A.17:
- Recurrent allocation for 2013-14 for Australia
- Cost per completed support period for 2013-14 for Australia.