Report on Government Services 2021
PART E, SECTION 11: RELEASED ON 28 JANUARY 2021
11 Ambulance services
This section is presented in a new online format. Dynamic data visualisations replace the static chapter format used in previous editions. Machine readable data are also available for download. A guide is available on accessing information in the new format.
Impact of COVID-19 on data for the Ambulance services section
COVID-19 may affect data in this Report in a number of ways. This includes in respect of actual performance (that is, the impact of COVID-19 on service delivery in 2020 which is reflected in the data results), and the collection and processing of data (that is, the ability of data providers to undertake data collection and process results for inclusion in the Report).
For the Ambulance services section, there are no significant changes to the data as a result of COVID-19.
The focus of performance reporting in this section is on ambulance service organisations, which are the primary agencies involved in providing emergency medical care, pre-hospital and out-of-hospital care, and transport services.
The Indicator Results tab uses data from the data tables to provide information on the performance for each indicator in the Indicator Framework. The same data in the data tables are also available in CSV format.
- Context
- Indicator Framework
- Indicator Results
Objectives for ambulance services
Ambulance services aim to promote health and reduce the adverse effects of emergency events on the community. Governments’ involvement in ambulance services is aimed at providing emergency medical care, pre-hospital and out-of-hospital care, and transport services that are:
- accessible and timely
- meet patients' needs through delivery of appropriate health care
- high quality — safe, co-ordinated and responsive health care
- sustainable.
Governments aim for ambulance services to meet these objectives in an equitable and efficient manner.
Service overview
Ambulance services include preparing for, providing and enhancing:
- emergency and non-emergency pre-hospital and out-of-hospital patient care and transport
- inter-hospital patient transport including the movement of critical patients
- specialised rescue services
- the ambulance component of multi-casualty events
- the community’s capacity to respond to emergencies.
Roles and responsibilities
Ambulance service organisations are the primary agencies involved in providing services for ambulance events. State and Territory governments provide ambulance services in most jurisdictions. In WA and the NT, St John Ambulance is under contract to the respective governments as the primary provider of ambulance services.
Across jurisdictions the role of ambulance service organisations serves as an integral part of the health system. The role of paramedics has expanded over the last decade to include the assessment and management of patients with minor illnesses and injuries to avoid transport to hospital.On 1 December 2018, paramedicine became a nationally regulated profession with paramedics joining the National Registration and Accreditation Scheme (Paramedics Australasia, 2021). From this date, paramedics must be registered with the Paramedicine Board of Australia and meet the Board’s registration standards in order to practise in Australia (Paramedicine Board of Australia, 2018).
Funding
Total expenditure on ambulance services was $4.2 billion in 2019-20 (table 11A.10), which was funded from a mix of revenue sources. Total revenue of ambulance service organisations was $4.1 billion in 2019-20, representing an annual average growth rate of 8.0 per cent since 2014-15 (table 11.1).
Jurisdictions have different funding models to provide resourcing to ambulance service organisations. Nationally in 2019-20, State and Territory government grants and indirect government funding formed the greatest source of ambulance service organisations funding (74.4 per cent of total funding), followed by transport fees (from public hospitals, private citizens and insurance (20.3 per cent of total funding), and subscriptions and other income (5.3 per cent) (table 11A.1).
Size and scope
Human resources
Nationally in 2019-20, for ambulance services reported in this section there were:
- 19 778 FTE salaried personnel (82.0 per cent were ambulance operatives)
- 8346 volunteer personnel (90.1 per cent were ambulance operatives)
- 5662 paramedic community first responders. Community first responders are trained volunteers that provide an emergency response (with no transport capacity) and first aid care before ambulance arrival (table 11A.8).
Demand for ambulance services
Nationally in 2019-20, there were:
- 3.9 million incidents reported to ambulance service organisations1 (154.3 incidents per 1000 people)
- 4.9 million responses where an ambulance was sent to an incident (193.8 responses per 1000 people). There can be multiple responses sent to a single incident. There can also be responses to incidents that do not have people requiring treatment and/or transport
- 1223 response locations (5066 first responder locations with an ambulance) and 4073 ambulance general transport and patient transport vehicles
- 3.7 million patients assessed, treated or transported by ambulance service organisations2 (146.9 patients per 1000 people) (figure 11.1)
- 71 air ambulance aircraft available. There are air ambulance (also called aero-medical) services in all jurisdictions, although arrangements vary across jurisdictions (table 11A.2).
Ambulance service organisations prioritise incidents as:
- emergency — immediate response under lights and sirens required (code 1)
- urgent — undelayed response required without lights and sirens (code 2)
- non-emergency — non-urgent response required (codes 3, 4)
- casualty room attendance.
Nationally in 2019-20, 37.6 per cent of the 3.9 million incidents ambulance service organisations attended were prioritised as emergency incidents, followed by 35.7 per cent prioritised as urgent and 26.6 per cent prioritised as non-emergency (table 11A.2). There were 246 casualty room attendance incidents (all of which occurred in Queensland).
- An incident is an event that resulted in a demand for ambulance services to respond. Locate Footnote 1 above
- Patients are counted by the number of episodes. Patients may be the subject of more than one episode per year. Locate Footnote 2 above
References
Paramedics Australasia, 2020, https://paramedics.org/professional-standards (accessed 4 May 2020).
Paramedicine Board of Australia, 2018, Registration standards , https://www.paramedicineboard.gov.au/Registration.aspx (accessed 22 October 2019).
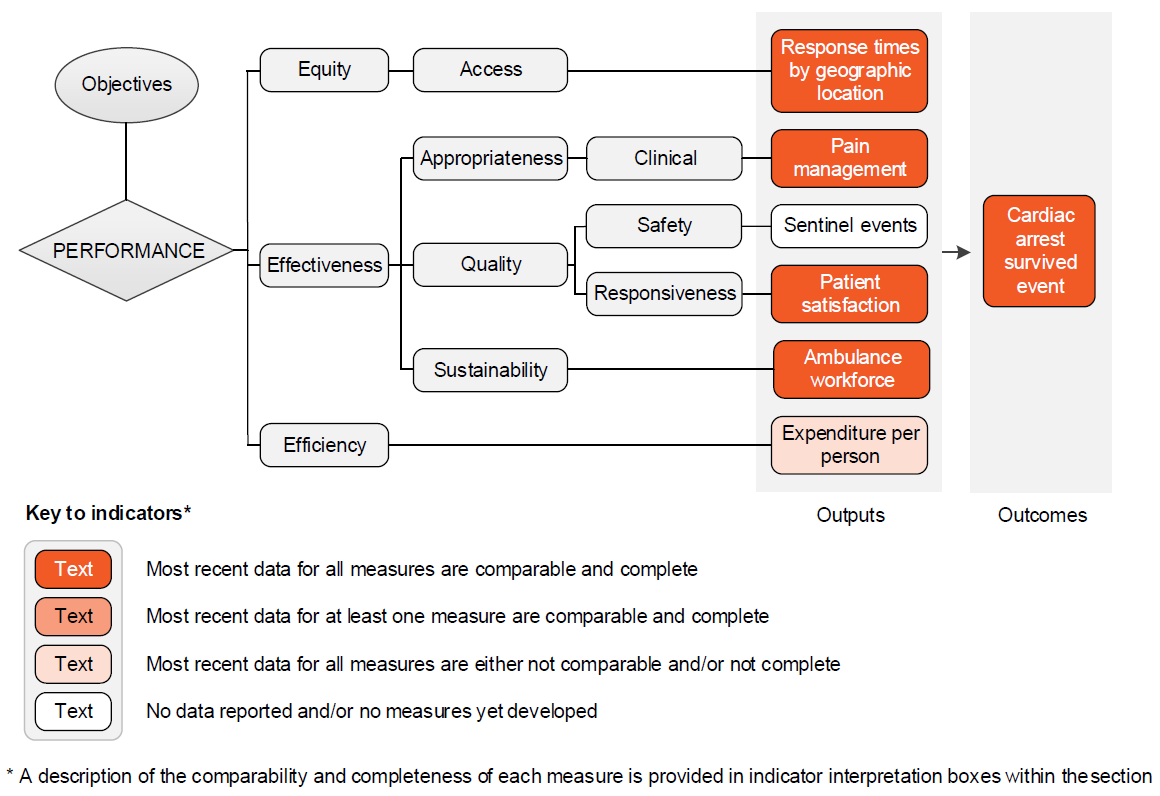
The performance indicator framework provides information on equity, efficiency and effectiveness, and distinguishes the outputs and outcomes of ambulance services.
The performance indicator framework shows which data are complete and comparable in this Report. For data that are not considered directly comparable, text includes relevant caveats and supporting commentary. Section 1 discusses data comparability and completeness from a Report-wide perspective. In addition to the service area's Profile information, the Report’s statistical context (section 2) contains data that may assist in interpreting the performance indicators presented in this section.
Improvements to performance reporting for ambulance services are ongoing and include identifying data sources to fill gaps in reporting for performance indicators and measures, and improving the comparability and completeness of data.
Outputs
Outputs are the services delivered (while outcomes are the impact of these services on the status of an individual or group) (see section 1). Output information is also critical for equitable, efficient and effective management of government services.
Outcomes
Outcomes are the impact of services on the status of an individual or group (see section 1).
An overview of the Ambulance services indicator results is presented. Different delivery contexts, locations and types of clients can affect the equity, effectiveness and efficiency of ambulance services.
Information to assist the interpretation of these data can be found in the Ambulance services interpretative material and data tables. Data tables are identified by a ‘11A’ prefix (for example, table 11A.1).
All data are available for download as an excel spreadsheet and as a CSV dataset — refer to Download supporting material. Specific data used in figures can be downloaded by clicking in the figure area, navigating to the bottom of the visualisation to the grey toolbar, clicking on the 'Download' icon and selecting 'Data' from the menu. Selecting 'PDF' or 'Powerpoint' from the 'Download' menu will download a static view of the performance indicator results.
Download supporting material
- 11 Ambulance services interpretative material (PDF - 188 Kb)
- 11 Ambulance services interpretative material (Word - 56 Kb)
- 11 Ambulance services data tables (XLSX - 229 Kb)
- 11 Ambulance services dataset (CSV - 240 Kb)
See the interpretative material and corresponding table number in the data tables for detailed definitions, caveats, footnotes and data source(s).