Trade and Assistance Review 2013-14
Annual report series
The Trade and Assistance Review 2013-14 was released on 24 June 2015.
The review contains the Commission's latest quantitative estimates of Australian Government assistance to industry. The Review also:
- outlines policy insights from the evolution and recent developments in the measurement of global value chains
- comments on the weakness of Government assessment of both industry assistance and preferential trade agreements (otherwise known as 'free trade agreements')
- identifies recent developments in industry assistance and international trade policy.
Due to a methodology error the estimates for the R&D Tax Incentive have been underestimated since its introduction in 2012-13. This means the estimates of budgetary assistance and total assistance have been underestimated in this document. Please see the 2015-16 Review for the correct estimates.
Download the report
- Trade and Assistance Review 2013-14 (PDF - 3053 Kb)
- Trade and Assistance Review 2013-14 (Word/Zip - 2248 Kb)
Methodological Annex
- At a glance
- Contents
- Supporting data
- Infographic
Key points
- Government assistance to firms, projects and industry is provided through an array of measures including tariffs, grants, concessional loans, tax concessions, regulatory restrictions on competition, and government purchasing preferences.
- While tariff and budgetary assistance remains substantial and is readily quantified, other less transparent and difficult to quantify measures can confer substantial assistance.
- The reaction of some firms to emerging competition, technologies and business models (for example digital disruption) has been to call for restrictions on competition.
- Australian Government tariff and budgetary gross assistance to industry amounted to over $17 billion in 2013-14.
- After allowing for the cost to business of tariffs on imported inputs ($7.3 billion, largely incurred by service industries), net assistance across all sectors was $9.7 billion.
- Tariffs alone costs every Australian around $150 each year.
- Net assistance matters. This is most perversely manifest in the net negative assistance to services - $4.3 billion of assistance is outweighed by a $4.9 billion tariff penalty on inputs.
- Budgetary industry assistance in 2013-14 was about 17 per cent (or $1.3 billion) higher than in 2012-13. The largest increase was from the Small Business Simplified Depreciation Rules.
- Notably in the year to May 2015, the Government announced additional industry assistance involving about $1.5 billion as well as reductions of around $1 billion. Significant increases were afforded though the Industry Innovation and Competitiveness Agenda.
- Where Government becomes a 'co-investor' through firm-specific grants, and despite some recent government resistance to such calls, resource misallocation is likely. Moreover, governance and due diligence fall short of contemporary, comparable best practice. The term 'co-investor' is a commercial misnomer.
- Better government assessment processes are needed.
- The evolution and recent measurement of global value chains and value-added trade flows provides valuable insights for trade and assistance policy. The key policy take-outs reinforce several established policy imperatives, including:
- multilateral trade reform is the most effective way to improve national and global welfare
- non-discriminatory policies that seek to lower imported input costs and other business costs have the best chance of fostering firm and economic growth
- policies that seek to support designated priority sectors unavoidably risk disadvantaging more competitive activities.
- Slow progress in multilateral trade reform has accelerated preferential agreement making.
- Preferential trade agreements add to the complexity and cost of international trade through substantially different sets of rules of origin, varying coverage of services and potentially costly intellectual property protections and investor-state dispute settlement provisions.
- The emerging and growing potential for trade preferences to impose net costs on the community presents a compelling case for the final text of an agreement to be rigorously analysed before signing. Analysis undertaken for the Japan-Australia agreement reveals a wide and concerning gap compared to the Commission's view of rigorous assessment.
Media release
Trade and Assistance Review 2013-14
In 2013-14, Australian industry received over $17 billion in gross assistance from the Australian Government through budgetary outlays, tax concessions and tariffs according to the latest annual Trade and Assistance Review (The Review) by the Productivity Commission.
Notably, budgetary assistance to industry in 2013-14 was about 17% (or $1.3 billion) higher than in 2012-13.
The Review finds that while tariff assistance today is much lower than it was - from as high as 125% in 1985 to a maximum of 5% today - on average it 'taxes' every Australian about $150 each year. Businesses incurred an estimated $7.3 billion in additional input costs in 2013-14, from the same source.
The net effect of assistance varies significantly by sector. Manufacturing remains the biggest beneficiary, receiving around $7 billion in net assistance. Other sectors do far less well from the taxpayer. Services once again bear a greater imposed cost - with the tariff penalty on their inputs perversely outweighing the benefit from government assistance measures.
The Review highlights that services are more important than traditional trade statistics suggest. While trade statistics suggest that manufactures are about 36% of Australian exports, on a value added basis much of this is composed of services. Consequently, services are more like 42% of Australian trade; and manufactures fall to around 14%. Imposing a net burden on services through industry assistance measures in part designed to promote exports appears even less explicable.
The Trade and Assistance Review 2013-14 also outlines policy insights from the evolution and recent developments in the measurement of global value chains. The new data tracks global value chains as goods and services journey between countries, regions and industries before they end up in the hands of the consumer. This recently available data shows that more of our exports ultimately end up in Europe and the United States than suggested by traditional Australian trade data. 'Global trade statistics now unravel the DNA of value-added trade between countries and regions. Current policy settings not based on them, and many trade and industry policies are not, are at best ill-informed' said Commissioner Karen Chester.
The Review also comments on the weakness of Government assessment of both industry assistance and preferential trade agreements (otherwise known as 'free trade agreements'). Established benchmarks for assessment are not being applied. Even if the policies were advisable, the analysis to support that is not being developed as might be expected.
A 'gap analysis' of assessment work for the Japan Australia Economic Partnership Agreement compared with the Commission's previously published benchmarks for rigorous assessment has been undertaken and is included in the Review. 'Our 'gap analysis' of the Japan Australia Agreement shows today's assessment processes fall well short of what is needed before committing us to these agreements,' Commissioner Karen Chester said.
- Preliminaries
- Cover, Copyright and publication details, Foreword, Contents and Abbreviations
- Overview
- Chapter 1 About this Review
- Chapter 2 Policy insights from emerging patterns of global trade
- 2.1 Value-added trade patterns
- 2.2 International trade competitiveness
- 2.3 Assistance to exporting and Australia's export competitiveness
- 2.4 Concluding comments
- Chapter 3 Firm assistance - when government becomes an 'investor'
- 3.1 An appropriate governance framework
- 3.2 Current assistance governance practices vary considerably
- 3.3 Governance processes that would help narrow the performance gaps
- Chapter 4 Issues and concerns with preferential trade agreements
- 4.1 Rules of origin
- 4.2 Service sector coverage
- 4.3 Intellectual property provisions
- 4.4 Dispute settlement
- 4.5 Assessing the potential impacts of trade agreements
- Chapter 5 Assistance estimates
- 5.1 Estimates in aggregate
- 5.2 Tariff assistance
- 5.3 Australian Government budgetary assistance
- 5.4 Combined assistance and effective rates of assistance
- 5.5 Effective rates of assistance since 1970
- Chapter 6 Recent developments in industry assistance
- 6.1 Research, development and innovation
- 6.2 Primary production
- 6.3 Manufacturing
- 6.4 Industry Innovation and Competitiveness Agenda
- 6.5 Regional assistance programs
- 6.6 Broadcasting and communications
- 6.7 Other industry assistance developments
- 6.8 Policy framework reviews
- Chapter 7 Recent developments in trade policy
- 7.1 Multilateral, plurilateral and regional developments
- 7.2 Bilateral and regional agreements
- 7.3 Dispute settlement
- 7.4 Anti-dumping activity
- Appendix A Detailed estimates of Australian Government assistance to industry
- Appendix B Emerging patterns of production and trade
- Appendix C Recent co-investment grant proposals
- Appendix D Services commitments in the ASEAN-Australia-New Zealand trade agreement
- Appendix E Anti-dumping and countervailing activity
- References
The following excel files contain tables of data used to make the charts within the Trade and Assistance Review 2013-14. There is also an extra file with data of Australian Government budgetary assistance by program.
- Overview (XLSX - 57 Kb)
- Chapter 2 (XLSX - 58 Kb)
- Chapter 4 (XLSX - 41 Kb)
- Chapter 5 (XLSX - 121 Kb)
- Appendix A - Detailed estimates of assistance (XLSX - 162 Kb)
- Appendix B - Emerging patterns of production and trade (XLSX - 117 Kb)
- Appendix E - Anti-dumping and countervailing activity (XLSX - 16 Kb)
- Budgetary assistance by program, 2008-09 to 2013-14 (XLSX - 21 Kb)
Download the full infographic
Trade and Assistance Review 2013-14 (text version of the infographic)
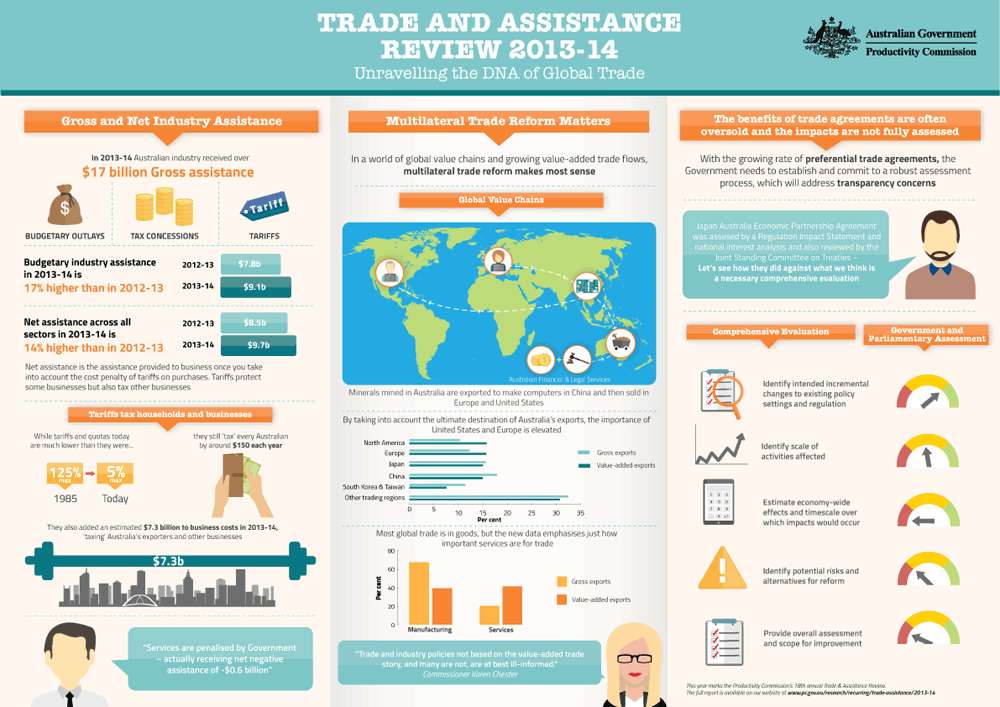
Unravelling the DNA of Global Trade
Gross and Net Industry Assistance
In 2013-14 Australian industry received over $17 billion Gross assistance from Budgetary outlays, tax concessions and tariffs.
Budgetary industry assistance in 2013-14 is 17% higher than in 2012-13. $7.8 billion in 2012-13 and $9.1 billion in 2013-14.
Net assistance across all sectors in 2013-14 is 14% higher than in 2012-13. $8.5 billion in 2012-13 and $9.7 billion in 2013-14.
Net assistance is the assistance provided to business once you take into account the cost penalty of tariffs on purchases. Tariffs protect some businesses but also tax other businesses.
Tariffs tax households and business
While tariffs and quotas today are much lower than they were... 125% max in 1985 compared to 5% max today... they still 'tax' every Australian by around $150 each year.
They also added an estimated $7.3 billion to business costs in 2013-14, 'taxing' Australia's exporters and other businesses.
'Services are penalised by Government - actually receiving net negative assistance of -$0.6 billion'
Multilateral Trade Reform Matters
In a world of global value chains and growing value-added trade flows, multilateral trade reform makes most sense.
Global Value Chains
Minerals mined in Australia are exported to make computers in China and then sold in Europe and United States.
| Country | Share of gross exports | Share of value-added exports |
|---|---|---|
| North America | 10.3 | 15.8 |
| Europe | 12.3 | 15.7 |
| Japan | 15.6 | 15 |
| China | 17.9 | 15 |
| South Korea and Taiwan | 11.4 | 7.6 |
| Other trading regions | 32.5 | 30.8 |
| Sector | Gross exports | Value-added exports |
|---|---|---|
| Manufacturing | 67 | 39 |
| Services | 20 | 41 |
'Trade and industry policies not based on the value-added trade story, and many are not, are at best ill-informed.' Commissioner Karen Chester.
The benefits of trade agreements are often oversold and the impacts are not fully assessed
With the growing rate of preferential trade agreements, the Government needs to establish and commit to a robust assessment process, which will address transparency concerns.
Japan Australia Economic Partnership Agreement was assesed by a Regulation Impact Statement and national interest analysis and also reviewed by the Joint Standing Committee on Treaties - Let's see how they did against what we think is a necessary omprehensive evaluation.
| Comprehensive Evaluation | Government and Parliamentary Assessment |
|---|---|
| Identify intended incremental changes to existing policy settings and regulation | Changes reasonably well identified |
| Identify scale of activities affected | Scale of activities affected not well articulated |
| Estimate economy-wide effects and timescale over which impacts would occur | Economy-wide impacts not quantified |
| Identify potential risks and alternatives for reform | Only limited attention given to potential risks and alternatives for reform |
| Provide overall assessment and scope for improvement | Major gaps in overall assessment |
This year marks the Productivity Commission's 18th annual Trade and Assistance Review.
Read more detail in the report.