Report on Government Services 2026
PART F, SECTION 14: RELEASED ON 29 JANUARY 2026
14 Aged care services
This section focuses on government funded care and support services for older people and their carers, which are provided at home, in the community and in residential care facilities.
The Indicator results tab uses data from the data tables to provide information on the performance for each indicator in the Indicator framework. The same data is also available in CSV format.
Data downloads
Refer to the corresponding table number in the data tables for detailed definitions, caveats, footnotes and data source(s).
Context
Objectives for aged care services
The aged care system aims to promote the wellbeing and independence of older people (and their carers), by enabling them to stay in their own homes or assisting them in residential care. Governments seek to achieve this aim by subsidising aged care services that are:
- accessible – including timely and affordable
- appropriate to meet the needs of clients – person-centred, with an emphasis on integrated care, ageing in place and restorative approaches
- high quality and safely delivered
- sustainable.
Governments aim for aged care services to meet these objectives in an equitable and efficient manner.
As people age, they may need care and support to maintain their health, wellbeing, social connections, and independence, and to remain in their homes and communities. In 2022, 39.8% of people aged 65 years or older (1.7 million people) reported needing assistance as they aged (ABS 2024). Care and support for older people is often provided by family members, friends and neighbours. However, not everyone’s care needs can be met through informal care and support. Around 80% of older people will access some form of government funded aged care service before they die (AIHW 2018).
Government funded aged care services are provided to older people (all people aged 65 years or over and Aboriginal and Torres Strait Islander people aged 50–64 years) who have been assessed as eligible for subsidised care through an Aged Care Assessment Team (ACAT) or the single assessment application process. These services assist people who require assistance to access care in their homes, in the community or in residential care facilities. Approved aged care service providers receive government funding and must meet minimum standards of care.
Regulation and policy oversight of aged care services is primarily the responsibility of the Australian Government. The Aged Care Act 2024 (Cth) and the accompanying rights-based framework are the main regulatory instruments. The Act enforces obligations through a Code of Conduct and Aged Care Quality Standards that outline the rights of older people.
The Australian Government funds residential aged care, home care and home support, with state, territory and local governments also funding and/or delivering some of these services directly. For example, a small proportion of residential aged care facilities are owned by state and territory governments. However, most services are delivered by non-government providers (tables 14A.11–12), such as private-for-profit, religious and charitable organisations.
While the Australian Government subsidises a significant portion of aged care, clients and residents are expected to contribute where they can and may be charged fees by service providers.
In 2024-25, government recurrent expenditure on aged care services was $39.8 billion or $7,895.4 per older person (table 14A.5; figure 14.1). Residential and flexible care services accounted for the largest share of expenditure ($25.4 billion, or 63.9%), while home care and home support services accounted for most of the remainder ($12.9 billion) (table 14A.4).
In 2024-25, the Australian Government provided 98.9% of government funding for aged care services, with the remainder contributed by state and territory governments (table 14A.4). Detailed expenditure data by program is contained in tables 14A.4-9.
In 2024-25, operating expenses for the Aged Care Quality and Safety Commission (ACQSC) were $338.4 million (table 14A.4).
Aged care target population
The size and health of the older population are key drivers of demand for aged care services. Australia's population is ageing rapidly, with the share of the population aged 65 years or over projected to increase by 6.1 percentage points, from 17.3% in 2022-23 to 23.4% in 2062-63 (Commonwealth of Australia 2023). Although the Aboriginal and Torres Strait Islander population is also ageing, life expectancy at birth for Aboriginal and Torres Strait Islander people is lower compared to the non-Indigenous population (ABS 2023). The health sector overview contains further information on life expectancy (table EA.9).
The aged care target population is defined as all people aged 65 years or over and Aboriginal and Torres Strait Islander people aged 50–64 years (this aligns with the funding arrangements specified under the National Health Reform Agreement). The aged care target population differs from the Australian Government’s aged care ‘planning population’, which is used to allocate places under the Aged Care Act 1997 (Cth). For more information on the populations, refer to the 'Explanatory material' tab and table 14A.1.
Types of care and support
Home care and support
Governments provide services to help older people remain in their homes or return to their homes from hospital or respite care. Carers can also access respite care through home care and home support programs:
- the Commonwealth Home Support Programme (CHSP) provides entry-level support services to help older people live independently and safely at home and in their community. Table 14A.20 provides a full list of CHSP services. Nationally in 2024-25, there were 833,670 older CHSP clients, equivalent to around 165.4 older clients per 1,000 older people (table 14A.2–3).
- the Home Care Packages Programme provides more complex in home care tailored to assessed levels of need (level 1 Home Care Packages assist older people with low-care needs, while level 4 packages support high-care needs). Nationally in 2024-25, there were 351,816 older clients of the Home Care Packages programme, equivalent to around 69.8 older clients per 1,000 older people (table 14A.2–3).
- the Department of Veterans’ Affairs (DVA) provides community care for eligible veterans through the Veteran Home Care (VHC) service. Nationally in 2024-25, 31,979 veterans aged 65 years or over were approved for VHC services (tables 14A.8).
Residential aged care services
Residential aged care is provided in aged care homes on a permanent or respite (temporary) basis. Residents receive accommodation, support (cleaning, laundry and meals) and personal care services (assistance with showering and toileting), and nursing care where required. Nationally in 2024-25, 259,592 older people were in permanent residential care (equivalent to 51.5 per 1,000 older people) and 81,964 older people were in respite care (equivalent to 16.3 per 1,000 older people) (table 14A.2–3).
At 30 June 2025, the occupancy rate of residential aged care services was 89.9%, the highest occupancy rate since 2018. The occupancy rate had been trending downwards until 2023, when the occupancy rate was 86.1% (the lowest rate over the reported time series), before increasing in the two most recent years. The number of operational residential aged care places increased slightly over the same period (195,825 in 2016 to 224,493 in 2025) (table 14A.14). There were 66,739 permanent admissions to residential aged care in 2024-25 (table 14A.34).
Information on the classification of residential aged care residents is in table 14A.13. Rates of operational aged care places by selected characteristics are in tables 14A.15–17.
Flexible Care services
Where mainstream residential or home care services are unable to cater for an older person’s specific needs, flexible care options are available:
- Transition Care provides time-limited care to older people after a hospital stay to help maximise their independence and minimise functional decline, thereby avoiding premature entry into residential aged care. Nationally in 2024-25, 24,939 older people received support from Transition Care services (table 14A.2).
- Short Term Restorative Care (STRC) is similar to transition care. It provides time-limited care to improve the physical functioning, wellbeing and independence of older people, but without the need to have been in hospital. Nationally in 2024-25, 11,490 older people received STRC services (DoHDA 2025).
- Multi-Purpose Services (MPS) provide flexible and integrated health and aged care services in small communities in regional and remote areas that cannot support both a hospital and a separate aged care home. At 30 June 2025, there were 3,798 operational MPS program places (DoHDA 2025a).
- The National Aboriginal and Torres Strait Islander Flexible Aged Care Program provides culturally appropriate aged care to older Aboriginal and Torres Strait Islander people close to their home or community. Services funded under this program can deliver a mix of residential and home care services. At 30 June 2025, there were 1,829 operational flexible allocated places under this program, with 457 in flexible residential aged care facilities (DoHDA 2025a).
Care providers
Nationally at 30 June 2025, private for-profit organisations provided the largest proportion of operational home care packages (40.0%) and residential aged care places (38.0%) (figure 14.2; tables 14A.11–12).
Indicator Framework
The performance indicator framework provides information on equity, effectiveness and efficiency, and distinguishes the outputs and outcomes of aged care services.
The performance indicator framework shows which data is complete and comparable in this report. For data that is not considered directly comparable, text includes relevant caveats and supporting commentary. Section 1 discusses data comparability and completeness from a report-wide perspective. In addition to the contextual information for this service area (refer to Context tab), the report's statistical context (Section 2) contains data that may assist in interpreting the performance indicators presented in this section.
Improvements to performance reporting for aged care services are ongoing and include identifying data sources to fill gaps in reporting for performance indicators and measures, and improving the comparability and completeness of data.
Outputs
Outputs are the services delivered (while outcomes are the impact of these services on the status of an individual or group) (refer to section 1). Output information is also critical for equitable, efficient and effective management of government services.
Outcomes
Outcomes are the impact of services on the status of an individual or group (refer to section 1).
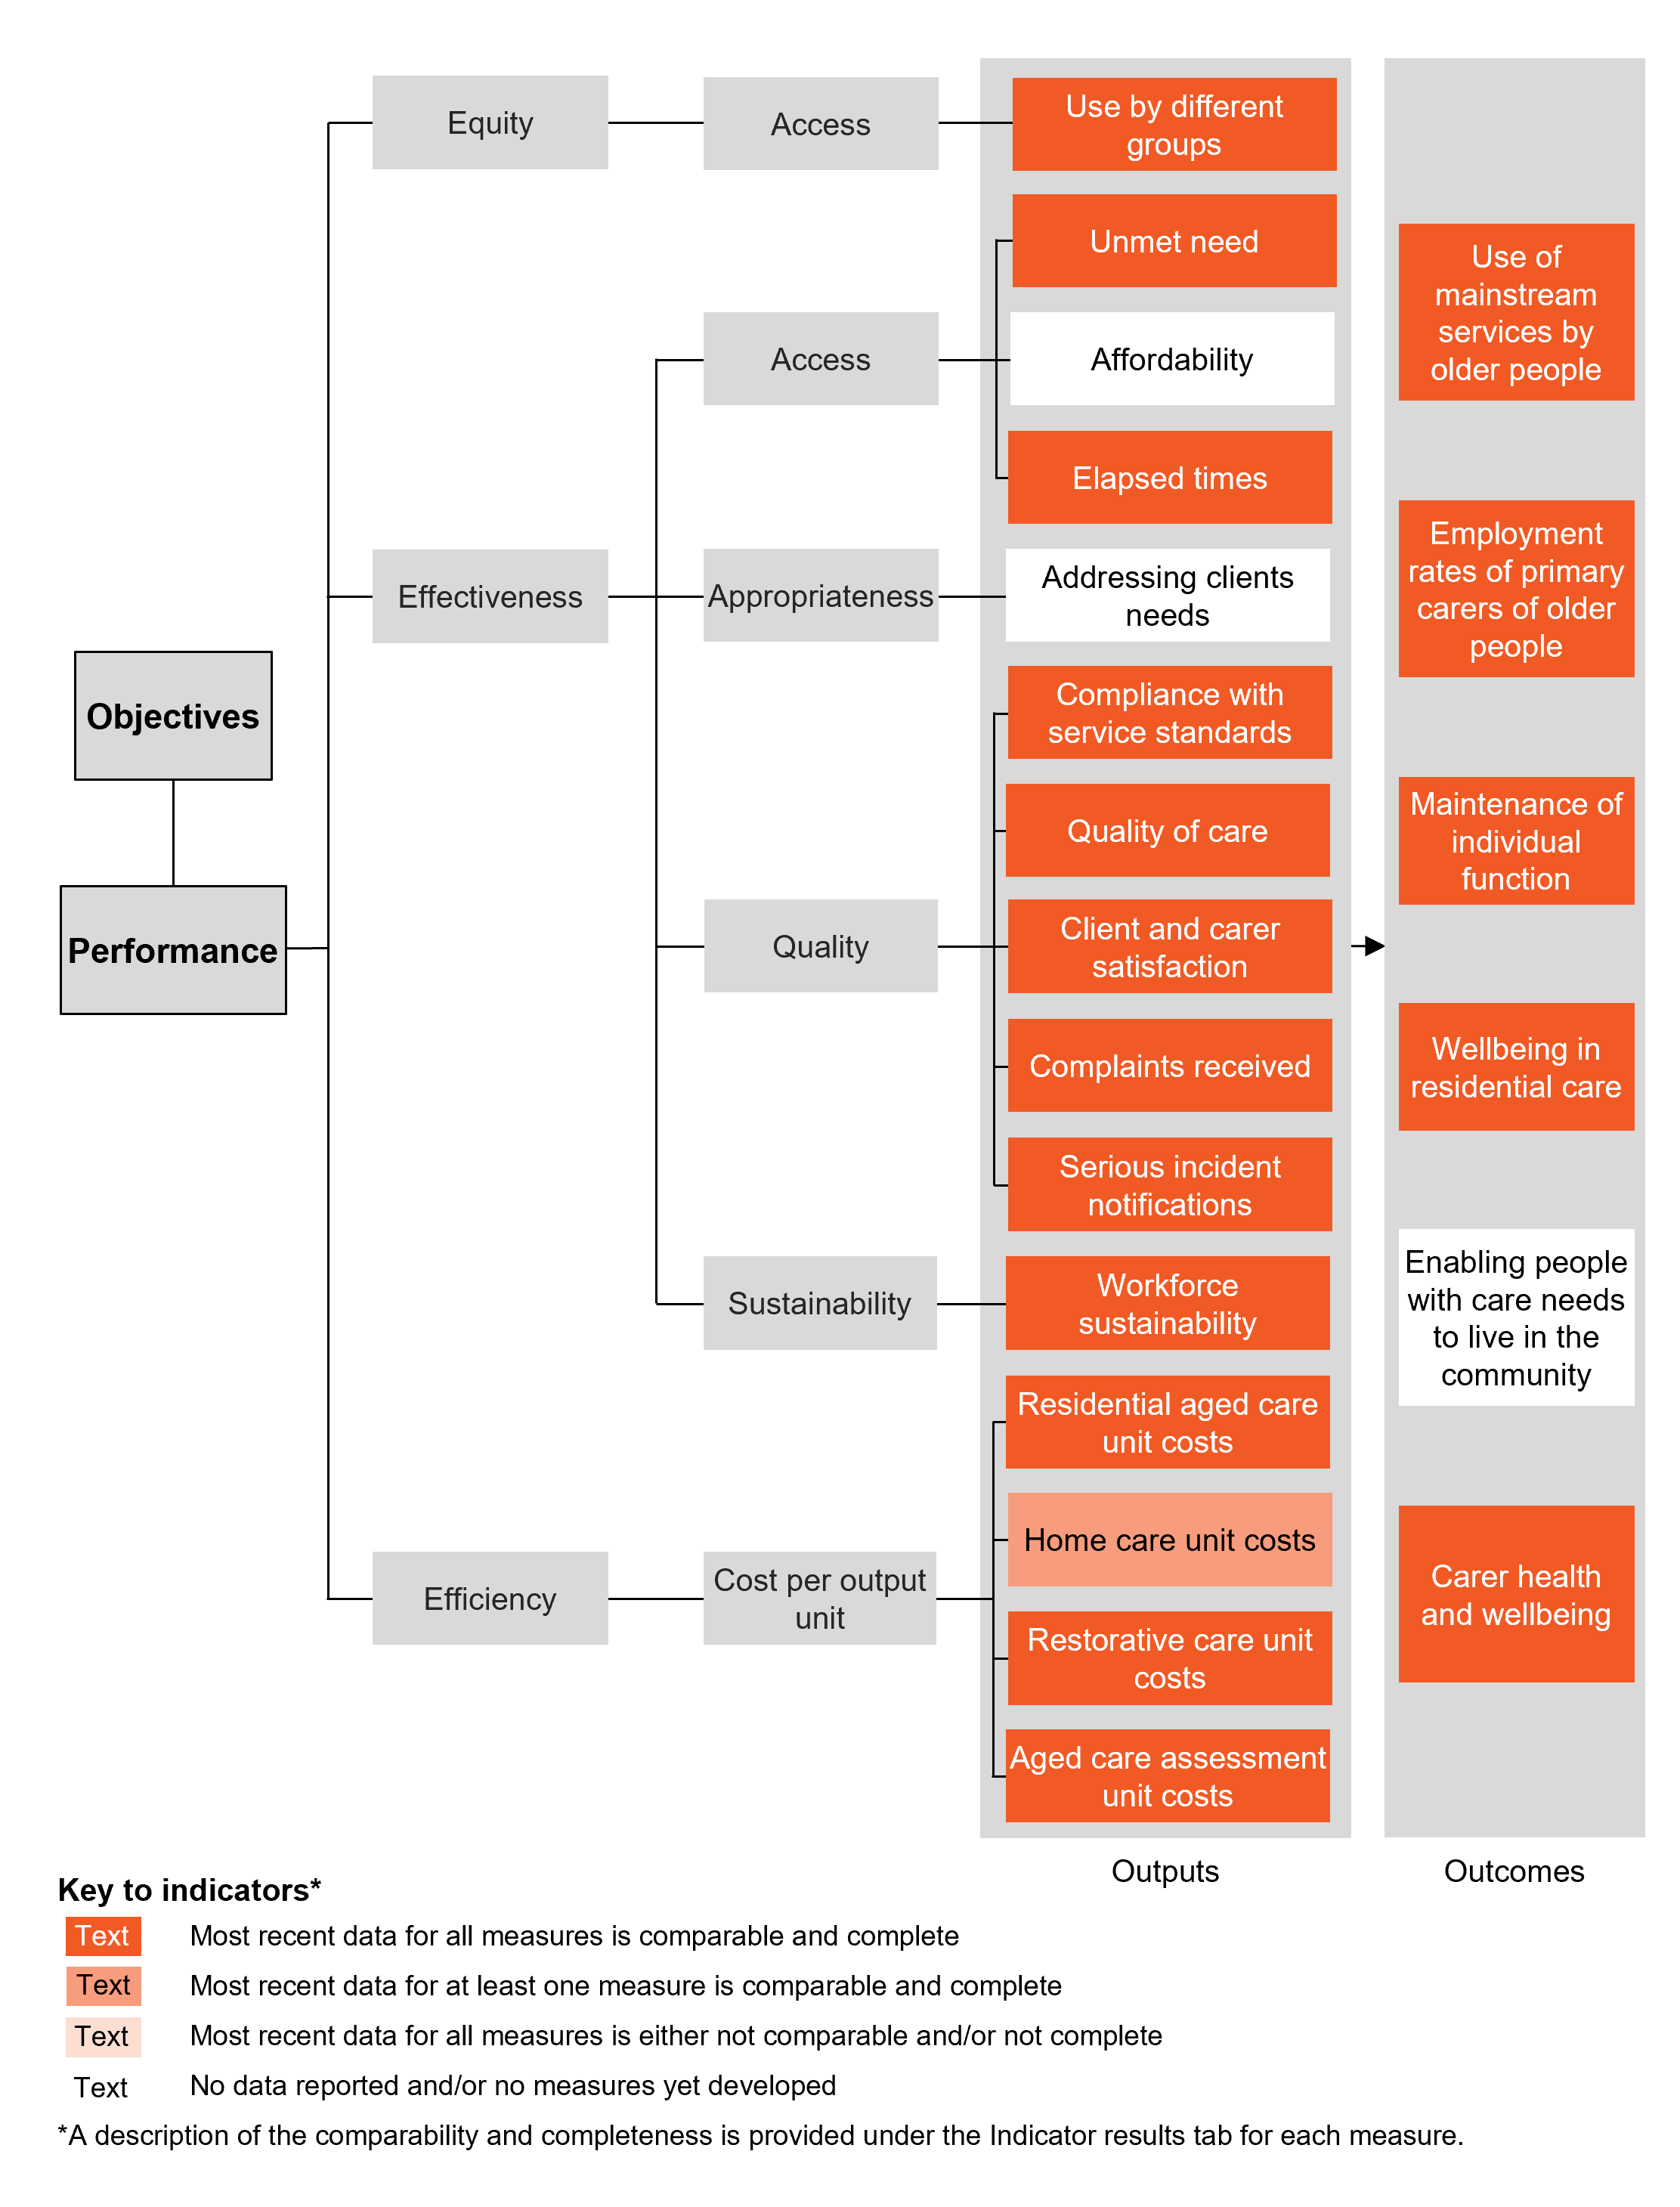
Performance – linked to Objectives
Outputs
Equity – Access
- Use by different groups – most recent data for all measures is comparable and complete
Effectiveness – Access
- Unmet need – most recent data for all measures is comparable and complete
- Affordability – no data reported and/or no measures yet developed
- Elapsed times – most recent data for all measures is comparable and complete
Effectiveness – Appropriateness
- Addressing client needs – no data reported and/or no measures yet developed
Effectiveness – Quality
- Compliance with service standards – most recent data for all measures is comparable and complete
- Quality of care – most recent data for all measures is comparable and complete
- Client and carer satisfaction – most recent data for all measures is comparable and complete
- Complaints received – most recent data for all measures is comparable and complete
- Serious incident notifications – most recent data for all measures is comparable and complete
Effectiveness – Sustainability
- Workforce sustainability– most recent data for all measures is comparable and complete
Efficiency – Cost per output unit
- Residential aged care unit costs – most recent data for all measures is comparable and complete
- Home care unit costs – most recent data for at least one measure is comparable and complete
- Restorative care unit costs – most recent data for all measures is comparable and complete
- Aged care assessment unit costs – most recent data for all measures is comparable and complete
Outcomes
- Use of mainstream services by older people – most recent data for all measures is comparable and complete
- Employment rates of primary carers of older people – most recent data for all measures is comparable and complete
- Maintenance of individual function – most recent data for all measures is comparable and complete
- Wellbeing in residential care – most recent data for all measures is comparable and complete
- Enabling people with care needs to live in the community – no data reported and/or no measures yet developed
- Carer health and wellbeing – most recent data for all measures is comparable and complete
A description of the comparability and completeness is provided under the Indicator results tab for each measure.
Indicator Results
This section presents an overview of Aged care services performance indicator results. Different delivery contexts, locations and types of clients can affect the equity, effectiveness and efficiency of aged care services.
Information to assist the interpretation of this data can be found with the indicators below and all data (footnotes and data sources) is available for download above as an excel spreadsheet and as a CSV dataset. Data tables are identified by a '14A' prefix (for example, table 14A.1).
Specific data used in figures can be downloaded by clicking in the figure area, navigating to the bottom of the visualisation to the grey toolbar, clicking on the 'Download' icon and selecting 'Data' from the menu. Selecting 'PDF' or 'Powerpoint' from the 'Download' menu will download a static view of the performance indicator results.
‘Use by different groups’ is an indicator of governments’ objective to subsidise aged care services in an equitable manner.
‘Use by different groups’ is defined as the proportion of service clients from a selected equity group, compared with the proportion of the aged care target population from that selected equity group.
Data is reported for three selected equity groups:
- Aboriginal and Torres Strait Islander people
- people from culturally and linguistically diverse (CALD) backgrounds
- people receiving aged care services in outer regional, remote/very remote areas.
Contextual data on the proportion of all permanent residents’ care days used by financially disadvantaged residents, aged care assessment, assessment approvals, plus services received through CHSP and recommended locations of longer-term living arrangements are available in tables 14A.19–23.
The proportion of service clients from a selected equity group should be broadly similar to the proportion of the aged care target population from that group.
Several factors should be considered when interpreting this data. Some equity groups may have a greater need for aged care services. Cultural differences and the availability of care and support from family, friends and neighbours can also affect the use of services across population groups.
‘Unmet need’ is an indicator of governments’ objective to subsidise aged care services that are accessible. ‘Unmet need’ measures aged care service access relative to need and is defined by two measures:
- unmet need in the community
- hospital patient days used by aged care type patients.
Unmet need in the community
'Unmet need in the community' reports on the:
- Proportion of people (aged 65 years or over) living in households who need more formal assistance than they currently receive.
- Proportion of carers (of people aged 65 years or over) who report a need for further assistance in their caring roles.
- Proportion of carers who report that they and the person or people they care for had poor access to adequate levels of formal support to ensure their wellbeing.
- Proportion of carers who report high barriers when trying to access services such as in-home support, respite care, and cleaning services on behalf of a care recipient.
A low or decreasing proportion of people who report needing more formal assistance is desirable.
Data for the Northern Territory should be interpreted with caution as the ABS Survey of Disability, Ageing and Carers (SDAC) excludes very remote areas, which comprise more than 20% of the estimated resident population in the Northern Territory living in private dwellings (ABS 2024).
Measure 1a: Nationally in 2022, 15.4% of people aged 65 years or over reported a need for more formal assistance than they currently receive, higher than in 2018 (9.7%) and 2015 (8.3%) (figure 14.3a).
Measure 1b: Nationally in 2022, 31.3% of primary carers of people aged 65 years or over reported a need for more formal assistance than they currently receive, higher than in 2018 (25.1%) and 2015 (22.5%) (table 14A.28).
Measure 1c: Nationally in 2024-25, 38.7% of carers of people aged 65 years or older reported poor access to support from a formal service for in-home care and assistance with specific needs, higher than in 2023-24 (36.3%) and 2022-23 (35.9%) but lower than 2021-22 (39.2%) (table 14A.29).
Measure 1d: Nationally in 2024-25, carers of people aged 65 years and over reported a range of barriers to accessing services, including poor service co-ordination (30.6%), lack of service availability (40.5%), long waiting times (48.0%) and complicated application processes for accessing services (48.7%). The proportion of carers reporting poor service co-ordination as a barrier to access has decreased over the available time series (34.7% in 2021-22), but the proportion of carers reporting lack of service availability, complicated application processes and long waiting times have not improved (38.7%, 42.4% and 43.3%, respectively, in 2021-22) (table 14A.29).
Hospital patient days used by aged care type patients
‘Hospital patient days used by aged care type patients’ is a proxy measure of unmet need defined as the proportion of hospital patient days (for overnight separations only) that were for aged care type patients (refer to 'Explanatory material' tab for further details).
Hospital inpatient services are geared towards shorter periods of acute care aimed at addressing serious illness or injury, or diagnosis. The needs of older people for maintenance care (particularly for extended periods of time) can be better met in residential aged care services than hospitals.
Understanding the relationship between the aged care and health systems is important, as interactions are critical for the performance of both systems. The number of operational residential aged care places can affect demand for public hospital beds, just as the number of older patients in acute and subacute care and the time they spend in hospital can affect demand for aged care services.
A low or decreasing proportion of patient days used by aged care type patients is desirable.
This data should be interpreted with caution, because:
- days for patients who have not completed their period of care in a hospital are not included
- identification in hospital as an aged care patient type may not reflect a person’s eligibility for residential care services (this is determined by an ACAT assessment) or reliably reflect access issues for residential aged care from the acute care sector – linked ACAT and hospital separations data is not available at this time
- the diagnosis codes for aged care patient type may not be applied consistently across jurisdictions or over time
- the denominator (all patient days for overnight separations) does not directly reflect the need for aged care services
- the scope of aged care type patients differs slightly to the equivalent National Healthcare Agreement indicator (refer to table 14A.30 for details).
Measure 2: Nationally in 2023‑24, the rate of all hospital patient days used by patients waiting for residential aged care was 13.6 per 1,000 patient days (figure 14.3b). Rates were lower for Aboriginal and Torres Strait Islander people compared to other Australians. Rates were higher for people from lower compared to higher socio-economic areas and for people in remote compared to non‑remote areas (table 14A.31). The proportion of separations for ‘aged care type’ patients waiting 35 days or longer was 15.5% nationally in 2023-24, the highest proportion in ten years (table 14A.30).
‘Affordability’ is an indicator of governments’ objective to subsidise aged care services to improve affordability for people who need them.
‘Affordability’ is defined as the out‑of‑pocket costs for aged care services (after subsidies) as a proportion of disposable income.
Low or decreasing out‑of‑pocket costs relative to disposable income indicates more affordable aged care services and is desirable.
Data is not yet available for reporting on this indicator.
‘Elapsed times’ is an indicator of governments’ objective to subsidise aged care services that are accessible. ‘Elapsed times’ are measured in days at the 50th and 90th percentile and reported separately for three measures:
- aged care assessment times
- home care elapsed times
- residential aged care elapsed times.
Low and decreasing days waited are desirable. However, various factors can influence days waited, including system capacity to assess applications and allocate packages, consumer choices, and market/provider supply side factors.
Days waited at the 50th percentile means half the sample will have a shorter elapsed time than this figure and half will have a longer elapsed time. Days waited at the 90th percentile means 90% of the sample will have a shorter elapsed time, while 10% will have a longer elapsed time.
Aged care assessment times
Aged care assessment times are measured in days at the 50th and 90th percentile between referral for an aged care assessment and assessment approval (excluding incomplete assessments). Assessment location is also reported.
Measure 1: Nationally in 2024-25, 50% of older people who were referred for an aged care assessment waited up to 27 days to receive an assessment approval (increasing to 172 days at the 90th percentile). Days waited between referral and assessment approval have increased from 14 days at the 50th percentile and 43 days at the 90th percentile in 2020-21 (table 14A.32).
Measure 1: Nationally in 2024-25, the elapsed time for assessment in a hospital was one day at the 50th percentile, increasing to six days at the 90th percentile. For community-based assessments, the elapsed time for assessment was 43 days at the 50th percentile, increasing to 192 days at the 90th percentile (figure 14.4a; table 14A.32).
Home care packages
Home care elapsed times are measured in days at the 50th and 90th percentile between: (1) assessment approval and the assignment of a home care package; (2) assignment of a home care package to service commencement date; and (3) assessment approval to service commencement date. Results are reported for medium, high and all priority older people.
Results measure days between assessment approval to assignment of a home care package and service commencement for any home care package level, whether or not it was at the approved level. Results are also limited to the first time an older person is assigned a home care package and/or services commence for an older person, as this is most indicative of the typical experience; package upgrades and opt back-ins would inflate reported elapsed times.
Measure 2: Nationally in 2024-25, all priority groups waited 204 days at the 50th percentile and 326 days at the 90th percentile to be assigned a home care package following assessment approval. The elapsed time has increased from 78 days at the 50th percentile and 216 days at the 90th percentile in 2023-24. Days waited were shorter for high-priority clients (12 days and 14 days at the 50th and 90th percentiles, respectively (figure 14.4b; table 14A.33).
Measure 2: Nationally in 2024-25, all priority groups waited 245 days at the 50th percentile and 366 days at the 90th percentile for services to commence after assessment approval. The number of days waited has increased from 118 days at the 50th percentile and 250 days at the 90th percentile in 2023-24. Days waited were shorter for high-priority clients (40 days and 77 days at the 50th and 90th percentiles, respectively) (table 14A.33).
Residential aged care
Residential aged care elapsed times are measured in days at the 50th and 90th percentile between assessment approval and residential aged care entry for all permanent residents and for a high priority cohort, defined as older people who enter residential aged care within 12 months of application (on the basis that older people with higher needs are unlikely to delay care entry by choice).
Not everyone assessed is approved for care, and some people are approved for more than one type of care. Additionally, care approvals do not lapse, which means assessments performed some years previously can be used for entry into residential aged care. With no central register of residential care offers, it is unclear if older people were offered a place and decided to delay their entry into care. Also, as an assessment can be for more than one type of care, older people can receive a home care package before they enter residential aged care.
Measure 3: Nationally in 2024-25, permanent residents who entered care during the financial year and within one year of assessment approval had an elapsed time of 71 days at the 50th percentile and 256 days at the 90th percentile (a trend largely consistent trend over the time series) (figure 14.4c). Of all people admitted to residential care with known elapsed times in 2024-25, 64.1% were admitted within one year of assessment approval (table 14A.34).
Data by equity groups are available in tables 14A.36–38.
Nationally in 2024-25, 38.9% of older people entered residential aged care within three months of their assessment approval (figure 14.4d); the median elapsed time was 162 days, similar to the 10-year high point of 163 days in 2020-21 and an increase from 84 days in 2015-16 (table 14A.35).
‘Addressing client needs’ is an indicator of governments’ objective to subsidise aged care services that are appropriate to meet the needs of clients – person‑centred, with an emphasis on integrated care, ageing in place and restorative approaches.
‘Addressing client needs’ will measure the extent to which:
- care recipients or their representatives had input into the planning of their care
- the supports identified in the care planning process to address an individual’s needs were provided (match of needs)
- individual interests, customs, beliefs and cultural and ethnic backgrounds were valued and fostered.
Data is not yet available for reporting on this indicator.
‘Compliance with service standards’ is an indicator of governments’ objective to subsidise high quality aged care services.
‘Compliance with service standards’ measures the extent to which approved aged care services (residential and home care) are meeting expected standards and is defined by three measures:
- re-accreditation of residential aged care providers
- compliance with aged care quality standards
- compliance with care minutes and registered nurse requirements.
Residential care – re-accreditation
This measure reports the proportion of accredited services given three‑year re-accreditation. Three years is the longest period for which re‑accreditation can be granted (in most cases). If a service is re‑accredited for this period, it implies a higher level of service quality than services re‑accredited for a shorter period. Further information on the accreditation standards and process is available at http://www.agedcarequality.gov.au.
Data for this measure does not include new services (1.0% of all residential care services) that have not been re‑accredited as at 30 June 2025 (table 14A.42).
High or increasing proportions of services that are re‑accredited for three years are desirable.
Data on re-accreditation by the size of the facility (places) and location are available in tables 14A.40–41.
Measure 1: At 30 June 2025, 95.2% of the 606 services re‑accredited that year were granted accreditation for three years or more; up from 85.0% in 2021‑22 (table 14A.39). At 30 June 2025, 96.3% of all 2,676 re-accredited residential aged care services had three-years or longer accreditation. This is the highest since 30 June 2018, but still lower than the peak of 98.3% in 2016 (figure14.5a and table 14A.42).
Compliance with Aged Care Quality Standards
On 1 July 2019, the Aged Care Quality Standards took effect for organisations providing all types of Commonwealth‑subsidised aged care services. These standards are:
- Standard 1 – Consumer dignity and choice
- Standard 2 – Ongoing assessment and planning with consumers
- Standard 3 – Personal care and clinical care
- Standard 4 – Services and supports for daily living
- Standard 5 – Organisation’s service environment
- Standard 6 – Feedback and complaints
- Standard 7 – Human resources
- Standard 8 – Organisational governance.
High or increasing proportions of services that met all expected outcomes are desirable.
Measure 2: For Australian Government subsidised aged care services, 17.4% of services received a re-accreditation audit during 2024-25 for residential aged care services, and 45.7% received a quality audit for home care and support (table 14A.43).
Measure 2: The proportions of residential aged care and home care and home support service providers reviewed during 2024‑25 that achieved the standards are in table 14.2.
Compliance with care minutes requirements
The care minutes responsibility requires approved residential aged care service providers to provide residents with a minimum amount of direct care time by registered nurses (RN), enrolled nurses, and personal care workers and assistants. The sector-wide care minutes benchmark for the 2023-24 financial year was an average of 200 minutes per resident per day, including 40 minutes of RN time. On 1 October 2024, the care minutes requirements increase to 215 minutes per resident per day, including 44 minutes of direct RN care time (although approved providers can meet up to 10% of their RN care minutes target with care time delivered by enrolled nurses).
Compliance with care minutes is measured as the proportion of services that met both the total care minutes target and the RN care minutes target.
A high or increasing proportion of services that meet their care minutes targets is desirable.
Measure 3: Nationally in 2024-25, 45.9% of residential aged care services met both the total care minutes target and the RN care minutes target, increased from 34.0% in 2023-24 (figure 14.5b). Separately, 55.8% of residential aged care services met the total care minutes target and 70.2% met the RN care minutes target (table 14A.44).
Registered nurse (RN) 24/7 coverage requirements
The 24/7 RN coverage responsibility requires approved providers of residential care services in a residential facility to ensure at least one RN is on-site and on duty 24 hours a day, seven days a week at the residential facility.
Compliance with the 24/7 RN coverage requirement is measured as the proportion of facilities with an RN on-site and on duty 24 hours a day, seven days a week. A high or increasing percentage of services meeting their 24/7 RN coverage requirements is desirable.
Nationally in 2024-25, 93.5% of residential aged care services met the 24/7 RN coverage requirement with an RN on-site and on duty 24 hours a day, seven days a week, an increase from 89.3% in 2023-24 (table 14A.45).
‘Quality of care’ is an indicator of governments’ objective to subsidise high quality aged care services. High quality aged care services provide services that meet residents’ personal, functional, clinical and psycho-social needs to a high standard.
‘Quality of care’ in residential aged care services is measured according to the expanded National Aged Care Mandatory Quality Indicator Program (the QI program). Participation in the QI program has been a requirement for all Australian Government subsidised residential aged care services since 1 July 2019.
The definitions and data collection methods for each quality indicator are outlined in the QI Program Manual 4.0 – Part A (DoHDA 2025b)
‘Quality of care’ is defined by eight measures:
- pressure injuries
- restrictive practices
- medication management
- falls and major injury
- unplanned weight loss
- activities of daily living: the proportion of care recipients who experienced a decline in activities of daily living.
- incontinence care: the proportion of care recipients who experienced incontinence-associated dermatitis.
- hospitalisation: the proportion of care recipients who presented to emergency departments or were admitted to hospitals.
Tables 14A.51–53 present the results for the three measures: activities of daily living, incontinence care and hospitalisation
Further details on the definitions of these measures are available in the Key terms section.
All else being equal, a low or decreasing rate of pressure injuries, physical restraint, medication management issues, falls, unplanned weight loss, deterioration in activities of daily living and incontinence care issues can suggest higher-quality services. However, high or increasing occurrences might reflect more effective reporting and monitoring arrangements.
Data for the Northern Territory should be interpreted with caution due to the small number of residential aged care services in the territory.
Measure 1: Pressure injuries – care recipients were observed for pressure injury once each quarter during 2024-25. In quarter 4 (Q4; April to June 2025), 5.0% of care recipients had one or more pressure injuries, down from the same quarter in 2021-22 (6.3%). Prevalence was higher for lower grade pressure injuries (figure 14.6a; table 14A.46).
Measure 2: Restrictive practices – restrictive practices were assessed by reviewing three days of existing care records each quarter during 2024-25. In quarter 4 (Q4; April to June 2025), 20.8% of care recipients subject to the use of a restrictive practice (excluding chemical restraint), and 15.7% subject to the use of a restrictive practice exclusively through the use of a secure area, an increase from the same quarter in 2023-24 (18.5% and 14.4%) (figure 14.6b; table 14A.47).
Measure 3: Unplanned weight loss – assessment of care recipients’ weight loss occurred monthly, however both unplanned weight loss indicators were measured on a quarterly basis during 2024-25. In quarter 4 (Q4; April to June 2025), 6.8% of care recipients experienced significant unplanned weight loss (meaning unplanned weight loss of 5.0% or more when comparing their current and previous quarter finishing weights), and 7.4% of care recipients experienced consecutive unplanned weight loss (meaning consecutive unplanned weight loss every month over three consecutive months of the quarter) down from the same quarter in 2021-22 (9.4% for both measures) (figure 14.6c; table 14A.48).
Measure 4: Falls and major injury – falls and falls resulting in major injury were assessed by reviewing care records over the entire quarter for each quarter during 2024-25. In quarter 4 (Q4; April to June 2025), 32.4% of care recipients experienced a fall, with 1.7% resulting in major injury (for example, bone fractures, joint dislocations, and head injuries), stable compared to the same quarter in 2021-22 for care recipients who experienced a fall (32.2%) but a decrease in care recipients who experienced a fall resulting in major injury (2.2%) (figure 14.6d; table 14A.49).
Measure 5: Medication management – care recipients' medication charts and/or records were assessed through a single review each quarter during 2024-25. In quarter 4 (Q4; April to June 2025), 35.2% of care recipients were prescribed nine or more medications, down compared to the same quarter in 2021-22 (37.5%). In Q4, 8.1% of all care recipients received antipsychotic medications for a diagnosed condition of psychosis, 17.8% of all care recipients received antipsychotic medications, down from the same quarter in 2021-22 (10.7% and 19.7%) (figure 14.6e; table 14A.50).
National Aged Care Mandatory Quality Indicator Program data used to report on this indicator are based on quarterly assessment data recorded by service as distinct from care recipients. Therefore, it is not possible to determine the number of quarters in which the same care recipients were assessed.
‘Client and carer satisfaction’ is an indicator of governments' objective to subsidise high quality aged care services. ‘Client and carer satisfaction’ is defined by six measures:
- Proportion of people aged 65 years or over living in households, who are satisfied with the range of formal service options available.
- Proportion of people aged 65 years or over living in households, who are satisfied with the quality of assistance received from formal services in the last six months.
- Proportion of carers who reported high satisfaction with their access to support (respite care services).
- Proportion of primary carers living in households (caring for people aged 65 years or over), who are satisfied with the range of formal service options available to help them in their caring role.
- Proportion of primary carers living in households (caring for people aged 65 years or over), who are satisfied with the quality of assistance received from formal services in the last six months to help them in their caring role.
- Proportion of consumers of residential aged care who reported 'good' or 'excellent' consumer experiences.
Performance indicator 7 'Quality of care' presents information on the QI program, which includes consumer experience.
A high or increasing proportion of clients and carers who are satisfied is desirable as it suggests that the service received was of a higher quality.
Data for the Northern Territory should be interpreted with caution, as the ABS SDAC excludes very remote areas. Very remote areas comprise of more than 20% of the estimated resident population in the Northern Territory living in private dwellings, and due to the small number of residential aged care services in the territory.
Measure 1: Nationally in 2022, 63.0% of people aged 65 years and over who reported a need for or received formal services in the previous six months were satisfied with the range of services available (figure 14.7a; table 14A.54).
Measure 2: Nationally in 2022, 85.4% of people aged 65 years and over who received formal services in the previous six months were satisfied with the quality of assistance they received (table 14A.55).
Measure 3: Nationally the proportion of carers who were satisfied with their access to respite care services was 38.6% in 2024-25, a decrease from 2023-24 (41.2%) (figure 15.7b; table 14A.58).
Measure 4: For primary carers of people aged 65 years or over, the proportion who were satisfied with the range of organised services available to help them in their caring role was 36.3% in 2022, a decrease of around 11 percentage points from 2015 (table 14A.56).
Measure 5: For primary carers of people aged 65 years or over, the proportion who were satisfied with the quality of assistance provided to help them in their caring role was 63.6% in 2022, down from 77.2% in 2015 (table 14A.57).
Measure 6: The proportion of care recipients who completed the consumer experience survey and reported a good or excellent consumer experience using all methods in quarter 4 (Q4; April to June 2025) was 84.9%, an increase from 82.5% in same quarter in 2023-24. Proportions varied by completion method (figure 14.7c; table 14A.59).
‘Complaints received’ is an indicator of governments’ objective to subsidise high quality aged care services.
‘Complaints received’ is defined as the number of in‑scope complaints received by the Aged Care Quality and Safety Commission that relate to Australian Government funded providers of residential care, home care, CHSP or flexible aged care services. However, the reported rate of complaints (complaints per 10,000 occupied bed days) is for complaints about residential aged care services only.
All else being equal, a low or decreasing rate of complaints can suggest higher quality services. However, a high or increasing rate of complaints may not necessarily mean lower quality services. It may reflect more effective complaints reporting and monitoring arrangements.
Nationally in 2024‑25, the Aged Care Quality and Safety Commission received 10,451 in‑scope complaints. Of these, 6,211 concerned permanent and respite residential aged care services, equivalent to 0.85 complaints per 10,000 occupied bed days, a decrease from a peak of 0.93 in 2021-22 (figure 14.8).
‘Serious incident notifications’ is an indicator of governments’ objective to subsidise high quality aged care services. 'Serious incident notifications' is defined by two measures:
- the number of Serious Incident Response Scheme notifications received by the Aged Care Quality and Safety Commission, by primary incident type, per 10,000 occupied bed days in residential care
- the number of Serious Incident Response Scheme notifications received by the Aged Care Quality and Safety Commission, by primary incident type in-home care.
The Serious Incident Response Scheme (the Scheme) was introduced on 1 April 2021. The purpose of the Scheme is to help prevent and reduce incidents of abuse and neglect in residential aged care services subsidised by the Australian Government. The Scheme was extended to aged care services delivered in home or community settings on 1 December 2022.
In a mature system where providers are routinely complying with reporting obligations, low or decreasing rates of Serious incident notifications are desirable. However, high or increasing rates might reflect more effective incident reporting mechanisms and organisational cultural change.
The number of Serious Incident Response Scheme notifications does not necessarily correlate to the number of instances of harm to an older person in aged care. Reports might include multiple notifications of the same matter, allegations of incidents, and situations where incidents occurred but injury was avoided. Incident rates should be monitored over time to identify trends.
Measure 1: Nationally in 2024-25, the Aged Care Quality and Safety Commission received 58,995 Serious Incident Response Scheme notifications from residential aged care service providers, which equates to 8.0 notifications per 10,000 occupied bed days (an increase from 5.5 notifications per 10,000 occupied bed days in 2021-22, which was the first full year of the scheme) (table 14A.61). Notifications most commonly concerned the unreasonable use of force (figure 14.9).
Measure 2: Nationally in 2024-25, the Aged Care Quality and Safety Commission received 6,053 Serious Incident Response Scheme notifications from in-home care service providers, an increase from 4,879 in 2023-24. Notifications most commonly concern neglect (table 14A.62).
‘Workforce sustainability’ is an indicator of governments’ objective to provide sustainable aged care services. Aged care workforce sustainability relates to the capacity of the aged care workforce to meet current and projected future service demand. ‘Workforce sustainability’ is defined by two measures:
- the proportion of nurses (registered and enrolled), in 10-year age brackets, by region
- the attrition rate of nurses (registered and enrolled).
Both measures report on full-time equivalent (FTE) nurses in aged care settings.
These measures are not a substitute for a comprehensive workforce analysis that considers training, migration, emerging work patterns and future demand. However, they can indicate the need for further workforce planning for aged care services.
High or increasing proportions of the workforce that are new entrants and/or low or decreasing proportions of the workforce that are close to retirement are desirable. A low or decreasing rate of workforce attrition is desirable.
Workforce age profiles
Measure 1: Nationally in 2024, 10.4% of the FTE registered aged care nursing workforce was aged 60 years or over (18.1% for enrolled nurses). Since 2015, the proportion of aged care nurses aged under 40 years has increased by 20.5 percentage points for registered nurses (17.4 percentage points for enrolled nurses) (figure 14.10a).
The proportion of Aboriginal and Torres Strait Islander people who are registered or enrolled as aged care nurses is presented in tables 14A.64 and 14A.66.
Workforce attrition rates
Aged care nursing workforce attrition rates are calculated using the FTE of aged care nurses who left the aged care nursing workforce (i.e., nurses who were not working in an aged care setting in the current year but who were working in an aged care setting in the previous year), divided by the total FTE of nurses employed in the workforce in an aged care setting in the previous year.
Measure 2: Nationally in 2024, the attrition rate for registered nurses working in aged care settings was 25.2%, a decrease from 35.9% in 2023 (figure 14.10b). Nationally in 2024, the attrition rate for enrolled nurses working in aged care settings was 31.4%, a decrease from 37.0% in 2023 (table 14A.66).
Table 14A.67 presents quarterly contextual data on workforce turnover in residential aged care services. It captures all eligible staff, including service managers, nurse practitioners or registered nurses, enrolled nurses, and personal care staff or assistants in nursing. This data provides insights into workforce turnover in residential aged care services, but it does not provide a comprehensive picture of overall workforce sustainability. For example, rather than leaving the sector, a worker might have moved to a new service provider.
Of all staff, 4.9% stopped working at a service during quarter 4 (Q4; April to June 2025), a similar result in the same quarter in 2023-24 (5.1%). The proportion was highest for service managers (7.0%).
‘Residential aged care unit costs’ is an indicator of governments’ objective to subsidise aged care services in an efficient manner. ‘Residential aged care unit costs’ is defined by two measures:
- Average annual program cost, per occupied bed day – annualised government expenditure on residential aged care services.
- Average annual Australian Government residential aged care subsidy (all levels of care), per claim day – annualised subsidy entitlements plus Conditional Adjustment Payment.
For measure 1, annualised costs are derived using total government aged care program expenditure on residential aged care services (Australian Government Department of Health and Aged Care, Department of Veterans' Affairs, and state and territory government supplements), divided by the number of occupied bed days, multiplied by 365 to present an average cost figure for an aged care resident in care for a year.
For measure 2, annualised costs are derived using total Australian Government aged care subsidy claims, divided by the number of claim days, multiplied by 365 to present an average subsidy amount that aged care providers could have claimed for an aged care resident in care for a year.
While high or increasing residential aged care unit costs might reflect deteriorating efficiency, it might also reflect changes in aspects of the service (such as greater time spent with clients) or differences in the characteristics of clients (such as their geographic location or higher levels of acuity). Similarly, while low or declining residential aged care unit costs might reflect improving efficiency, it might also reflect declining quality.
Not all expenditure is included in these measures. Expenditure by local governments and non-government sources is not captured.
Measure 1: Nationally in 2024-25, the average annualised cost per occupied bed day was $120,467, up from $83,091 in 2015-16 (figure 14.11).
Measure 2: Nationally in 2024-25, the average annualised Australian Government subsidy per claim day was $117,396 using the new classification system, AN-ACC, an increase from $109,084 in 2023-24 (table 14A.69).
‘Home care unit costs’ is an indicator of governments’ objective to subsidise aged care services in an efficient manner. ‘Home care unit costs’ is defined by four measures:
- Average annual home care program cost – Australian Government expenditure on home care, per recipient.
- Average annual CHSP cost – Australian Government expenditure on CHSP, per client.
- Average annualised home care package payment – payments on home care packages to recipients.
- Expenditure per hour of service for CHSP – Australian Government expenditure on services, divided by the number of hours of service provided.
While high or increasing home care unit costs might reflect deteriorating efficiency, it might also reflect changes in aspects of the service (such as greater time spent with clients) or differences in the characteristics of clients (such as their geographic location). Similarly, while low or declining home care unit costs might reflect improving efficiency, it may also reflect declining quality.
Not all expenditure is included in these measures. Expenditure by local governments and non-government sources is not captured.
Measure 1: Nationally in 2024-25, the cost per home care package recipient was $24,516. This is an increase from $19,427 in 2022-23 (figure 14.12a).
Measure 2: Nationally in 2024-25, the cost per recipient of the CHSP was $3,899, up from $3,415 in 2017-18, although a decrease compared with 2021-22 ($3,972) (table 14A.71).
Measure 3: Nationally in 2024-25, the average annualised payment per home care package was $29,800, an increase from 2022-23 ($24,321). The average annualised payment amount increased with package level ($9,300 for a level one home care package, compared to $50,500 for a level four home care package) (figure 14.12b).
Table 14A.72 includes additional contextual information on aged care package entitlement (i.e. allocated funds) and unspent funds.
Measure 4: Nationally in 2024-25, personal care costs per hour decreased, but domestic assistance, allied health and nursing costs per hour increased compared to 2023-24. Expenditure per hour of service was highest for nursing ($152.57), followed by allied health ($133.15), personal care ($103.78) and domestic assistance ($67.87) (figures 14.12c and 14.12d).
‘Restorative care unit costs’ is an indicator of governments’ objective to subsidise aged care services in an efficient manner. ‘Restorative care unit costs’ is defined by two measures:
- transition care, cost per recipient day
- short-term restorative care, cost per recipient day.
The Transition Care Programme is funded by the Australian Government and the state and territory governments, while the Short Term Restorative Care Programme is funded by the Australian Government.
While high or increasing restorative care unit costs might reflect deteriorating efficiency, it might also reflect changes in aspects of the service (such as greater time spent with clients) or differences in the characteristics of clients (such as their geographic location or entry conditions). Similarly, while low or declining restorative care unit costs might reflect improving efficiency, it might also reflect declining quality.
Not all expenditure is included in these measures. Expenditure by local governments and non-government sources on services is not captured.
Measure 1: Nationally in 2024-25, the cost per day of the Transition Care Programme was $380, a decrease from $478 in 2023-24 (figure 14.13).
Measure 2: Nationally in 2024-25, the cost per day of the Short Term Restorative Care Programme was $252, an increase from $214 in 2021-22, the earliest year available (table 14A.74).
‘Aged care assessment unit costs’ is an indicator of governments’ objective to subsidise aged care services in an efficient manner.
‘Aged care assessment unit costs’ is defined as Australian Government expenditure on aged care assessments, divided by the number of completed assessments.
While high or increasing aged care assessment unit costs might reflect deteriorating efficiency, it might also reflect changes in aspects of the service (such as greater time spent with clients) or differences in the characteristics of clients (such as their geographic location). Similarly, while low or declining aged care assessment unit costs might reflect improving efficiency, it might also reflect declining quality.
The Australian Government introduced the Single Assessment Program in December 2024, replacing the Aged Care Assessment Team (ACAT) program and the Regional Assessment Service program. Data for the 2024-25 period comprise a mix of program assessment types. More information, including the number of assessments, by type is in table 14A.75.
Not all expenditure is included in these measures. Expenditure by local governments and non‑government sources (for example, client fees for CHSP) and state and territory governments’ contributions to the cost of ACAT assessments are not captured.
Measure 1: Nationally in 2024-25, the average expenditure per assessment was $673 (figure 14.14).
'Use of mainstream services by older people' is an indicator of governments' objective that people aged 65 years and older have an enhanced quality of life and enjoy choice and wellbeing.
'Use of mainstream services by older people' is defined as the proportion of people aged 65 years or older who reported difficulty accessing government buildings in the last 12 months.
Low or decreasing proportions of people aged 65 years and older experiencing difficulty accessing government buildings is desirable.
Data for the Northern Territory should be interpreted with caution as the ABS SDAC excludes very remote areas which comprises more than 20% of the estimated resident population in the Northern Territory living in private dwellings (ABS 2024).
Measure 1: Nationally in 2022, 4.1% of people aged 65 years and over reported difficulty accessing government buildings in the last 12 months, compared to 30.1% of people aged 65 years and over who reported difficulty accessing any facilities in the past 12 months (figure 14.15; table 14A.76).
'Employment rates of primary carers of older people’ is an indicator of governments' objective to help carers of people aged 65 years and over achieve economic participation.
'Employment rates of primary carers of older people' is measured as the employment rate of primary carers (aged 15-64 years) who are caring for people aged 65 years and over, compared to the general population aged 15-64 years.
Similar rates of employment for primary carers and the general population are desirable.
This indicator does not assess whether employment opportunities are appropriate or fulfilling.
Nationally in 2022, 58.5% of primary carers (15-64 years old) caring for people aged 65 years and over were employed, compared to 77.4% of the general population aged 15-64 years. Employment rates for primary carers increased from 57.6% in 2018 and 53.8% in 2015 (figure 14.16).
‘Maintenance of individual function’ is an indicator of governments’ objective for aged care services to promote the wellbeing and independence of older people.
‘Maintenance of individual function’ is defined as improvement in the level of physical function for Transition Care Programme (TCP) and Short-Term Restorative Care Programme (STRCP) clients from entry to exit, measured as the difference between the average Modified Barthel Index (MBI) score on entry and exit.
Refer to the 'Explanatory material' for further information on the MBI.
An increase in the score from entry to exit is desirable.
This indicator needs to be interpreted with caution:
- The TCP and STRCP operate with some differences across jurisdictions, including differences in health and aged care service systems, local operating procedures and client groups. Variations in the average MBI scores on entry and exit from the program may reflect differences in client groups for the program across jurisdictions.
- The TCP is a small program only available directly on discharge from hospital (in 2024‑25 there were 22,900 admissions to the TCP). The average duration is around 10 weeks, with a maximum duration of 12 weeks (although this may be extended by a further six weeks in some circumstances) (DoHDA 2025).
- The STRCP provides services to older people for up to eight weeks (56 days) to help delay or avoid long-term care (in 2024‑25, there were 10,474 admissions to the STRCP) (DoHDA 2025).
Measure 1: Nationally in 2024‑25, the average MBI score for TCP clients increased from entry (71) to exit (82), similar to previous years (figure 14.17).
Measure 2: Nationally in 2024‑25, the average MBI score for STRCP clients increased from entry (83) to exit (86), similar to the previous year (table 14A.78).
'Wellbeing in residential care' is an indicator of governments' objective to promote the wellbeing of older people by assisting them in residential care and providing appropriate and high quality care to meet their needs.
'Wellbeing in residential care' is defined by two measures:
- The proportion of older people in residential aged care who report having a 'good' or 'excellent' quality of life, as measured by the National Aged Care Mandatory Quality Indicator (QI) Program.
- The proportion of older people in residential aged care who report positive experiences in residential aged care, 'Always' and 'Most of the time', as measured by the Residents’ Experience Survey.
Performance indicator 7 'Quality of care' presents further information on the QI program.
A high or increasing proportion of older people in residential aged care who report positive experiences in residential aged care and a good or excellent quality of life is desirable.
Data for the Northern Territory on the proportion of older people in residential aged care who report having a 'good' or 'excellent' quality of life should be interpreted with caution due to the small number of residential aged care services in the territory.
Measure 1: The proportion of care recipients who completed the quality of life survey and reported a good or excellent quality of life using all methods in quarter 4 (Q4; April to June 2025) was 75.4%, an increase from the same quarter in 2023-24 (73.7%). Proportions varied by completion method (figure 14.18a; table 14A.80).
Measure 2: Nationally in 2024:
- 66.1% of residents reported staff always treated them with respect, a decrease from 2023 (70.8%)
- 75.1% of residents reported that they always felt safe, similar to 2023 (74.7%)
- 62.2% of residents reported they always received the care they need, an increase from 2023 (57.2%)
- 57.8% of residents reported that they are always encouraged to do as much as possible for themselves, an increase from 2023 (55.1%) (figure 14.18b; table 14A.79).
‘Enabling people with care needs to live in the community’ is an indicator of governments’ objective to promote the wellbeing and independence of older people, by enabling them to stay in their own homes.
‘Enabling people with care needs to live in the community’ is defined as the proportion of older people with care needs who are living in the community.
An increasing proportion of older people with care needs who want to and are living in the community is desirable. This indicator should be considered alongside the outcome indicator on social participation.
Data is not yet available for reporting against this indicator.
'Carer health and wellbeing' is an indicator of governments' objective that carers of people aged 65 or over have an enhanced quality of life and enjoy choice and wellbeing.
'Carer health and wellbeing' is defined by three measures, which assess the rate of:
- self-reported wellbeing of carers compared to the general population
- self-reported loneliness ('often' or 'always' experiencing loneliness) of carers compared to the general population
- self-reported health ('fair' or 'poor') of carers compared to the general population.
Similar rates of carer health and wellbeing compared to the general population is desirable.
Measure 1-3: Nationally in 2024-25:
- 54.6% of carers reported low levels of wellbeing on the Personal Wellbeing Index compared with the general population (33.6%), and an increase from 2021-22 (48.6%)
- 36.8% of carers responded that they are often/always lonely compared with the general population (18.0%). This result is similar to 2021-22 (33.9%)
- 51.5% of carers responded that they have either fair or poor health compared with the general population (22.4%), and an increase from 2021-22 (44.3%) (figure 14.19; table 14A.81).
Aboriginal And Torres Strait Islander Data
Data for Aboriginal and Torres Strait Islander people in this section is available in the data tables listed below. Further supporting information can be found in the 'Indicator results' tab and data tables.
| Table number | Table title |
|---|---|
| Context data | |
| Table 14A.1 | Aged care target and planning populations, by remoteness area, 30 June |
| Table 14A.2 | People receiving aged care services |
| Table 14A.21 | Aged care assessments |
| Performance indicator data | |
| Table 14A.25 | Representation of Aboriginal and Torres Strait Islander people in the aged care target population and aged care recipients |
| Table 14A.31 | Hospital patient days used by those eligible and waiting for residential aged care |
| Table 14A.38 | Elapsed times for residential aged care, by Indigenous status |
| Table 14A.64 | Aged care nurse workforce (registered) (FTE) as at 30 September, by Indigenous status and attrition rate |
| Table 14A.66 | Aged care nurse workforce (enrolled) (FTE) as at 30 September, by Indigenous status and attrition rate |
Explanatory Material
| Terms | Definition |
|---|---|
| Accreditation | Accreditation is a key component of the Australian Government’s quality framework for federally funded residential aged care and is a quality assurance system for residential aged care services – based on the principle of continuous improvement. Accreditation requires assessment against the Aged Care Quality Standards ‑ grouped into eight standards: consumer dignity and choice; ongoing assessment and planning with consumers; personal care and clinical care; services and supports for daily living; service environment; feedback and complaints; human resources; and organisational governance. |
| Aged care | Services funded and/or provided by governments that respond to the functional and social needs of older people, and the needs of their carers. Home care and home support services aim to optimise independence and to assist older people to stay in their own homes, while residential care services provide accommodation and care for those who can no longer be cared for at home. Assessment of care needs is an important component of aged care. The majority of aged care services assist in activities of daily living such as personal care (for example, bathing and dressing), housekeeping and meal provision. Other services aim to promote social participation and connectedness. These services are delivered by trained aged care workers and volunteers. However, aged care services may also be delivered by health professionals such as nurses and occupational therapists. Aged care services generally aim to promote wellbeing and foster function rather than to treat illness. Although some aged care services such as transition care have a specific restorative role, they are distinguished from the health services described in Part E of this Report. Aged care services may be funded through programs specifically or mainly directed to older people, or through programs that address the needs of people of different ages. |
| Aged care target population | The aged care target population is defined as all people (Aboriginal and Torres Strait Islander people and non‑Indigenous) aged 65 years or over and Aboriginal and Torres Strait Islander people aged 50–64 years. This is the population within the scope of, and funded for services under, the national aged care system. |
| Aged care type patient (unmet need indicator) | Aged care type patients are those who are waiting for residential aged care where the care type is Maintenance, a diagnosis was reported as Person awaiting admission to residential aged care service and the separation mode was not Other (includes discharge to place of usual residence). Includes overnight separations only. |
| Aged care planning population | The aged care planning population is defined as people aged 70 years or over. This is the population used by the Australian Government for its needs‑based planning framework to ensure sufficient supply of both places by matching the growth in the number of aged care places with growth in the aged population. It also seeks to ensure balance in the provision of services between metropolitan, regional, rural and remote areas, as well as between people needing differing levels of care. Under the framework, the Australian Government seeks to achieve and maintain a specified national provision level of subsidised operational aged care places for every 1,000 people aged 70 years or over. This provision level is known as the aged care provision ratio (DoHA 2012). |
| Aged Care Quality Standards | From 1 July 2019, organisations providing Australian Government subsidised aged care services have been required to comply with the Aged Care Quality Standards. Organisations are assessed by the Aged Care Quality and Safety Commission and must be able to provide evidence of their compliance with the eight standards (ACQSC 2020): Standard 1 – Consumer dignity and choice: this standard reflects concepts important in treating consumers with dignity and respect, supporting choice and independence, and fostering social inclusion, health and wellbeing. Standard 2 – Ongoing assessment and planning with consumers: planned care and services should meet each consumer’s needs, goals and preferences, and optimise their health and wellbeing. Standard 3 – Personal and clinical care: consumers and the community expect the safe, effective and quality delivery of personal and clinical care, applying to all services delivering personal and clinical care specified in the Quality of Care Principles. Standard 4 – Service and supports for daily living: covers a wide range of options that aim to support consumers to live as independently as possible. Standard 5 – Organisation’s service environment: applies to physical service environments that organisations provide for residential care, respite care and day therapy centres. Standard 6 – Feedback and complaints: requires an organisation to have a fair, accessible, confidential and prompt system for resolving complaints. Standard 7 – Human resources: requires an organisation to have and use a skilled and qualified workforce. Standard 8 – Organisational governance: this Standard holds the governing body of an organisation responsible for the organisation and delivery of safe and quality care services. Further detail on the standards can be found on the ACQSC website at https://agedcarequality.gov.au. |
| Ageing in place in residential care | An approach that aims to provide residents with appropriate care and increased choice by allowing them to remain in the same facility regardless of changes in their level of care needs. It also allows couples with different levels of care needs to be cared for in the same facility. The main facet of ‘ageing in place’ is that funding is tied to the assessed care needs of the client rather than to the services provided by the facility. |
| Capital expenditure on residential services | Expenditure on building and other capital items, specifically for the provision of Australian Government funded residential aged care. |
| Care leaver | A care leaver is a person who was in institutional care (such as an orphanage or mental health facility) or other form of out‑of‑home care, including foster care, as a child or youth (or both) at some time during their lifetime (DoHA 2012). |
| Centre‑based respite | Respite care provided from a facility such as a day care or health centre. Respite care is usually combined with social support services to maintain the functional capabilities of the person receiving care. |
| Complaint | A complaint by the affected care recipient or his or her representative, or anyone else, to the ACQSC about matters relevant to an approved provider’s responsibilities under the Aged Care Act 1997 (Cth) or the Aged Care Principles. |
| Disability | In the ABS SDAC 2018, a person has a disability if they report they have a limitation, restriction or impairment, which has lasted, or is likely to last, for at least six months and restricts everyday activities. This includes: loss of sight (not corrected by glasses or contact lenses); loss of hearing where communication is restricted, or an aid to assist with, or substitute for, hearing is used; speech difficulties; shortness of breath or breathing difficulties causing restriction; chronic or recurrent pain or discomfort causing restriction; blackouts, seizures, or loss of consciousness; difficulty learning or understanding; incomplete use of arms or fingers; difficulty gripping or holding things; incomplete use of feet or legs; nervous or emotional condition causing restriction; restriction in physical activities or in doing physical work; disfigurement or deformity; mental illness or condition requiring help or supervision; memory problems or periods of confusion causing restriction; social or behavioural difficulties causing restriction; long term effects of head injury, stroke or other brain damage causing restriction; receiving treatment or medication for any other long term conditions or ailments and still being restricted and any other long term conditions resulting in a restriction. |
| Elapsed time | The measure of the time elapsed between key events in the process of getting aged care services. The key time events that are measures are:
|
| Modified Barthel Index | A measure of functioning in the activities of daily living reported for Transition Care Program recipients who completed a transition care episode, with zero being fully dependent and 100 being fully independent (DoHDA 2025). |
| National Aged Care Mandatory Quality Indicator (QI) Program | Pressure injuries
Restrictive practices
Unplanned weight loss
Falls and major injury
Medication management
Activities of daily living
Incontinence care
Hospitalisation
|
| Older people | All people (Aboriginal and Torres Strait Islander and non‑Indigenous) aged 65 years or over and Aboriginal and Torres Strait Islander people aged 50–64 years. |
| People from non‑English speaking countries | People who were born in non‑English speaking countries. English‑speaking countries are defined as Australia, New Zealand, the United Kingdom, Ireland, the United States, Canada and South Africa. |
| People with profound, severe and moderate disability | A person with a profound disability is unable to do, or always needs help with, a core activity task. A person with a severe disability sometimes needs help with a core activity task, and/or has difficulty understanding or being understood by family or friends, or can communicate more easily using sign language or other non‑spoken forms of communication. A person with a moderate disability needs no help, but has difficulty with a core activity task. |
| Personal care | Assistance in undertaking personal tasks (for example, bathing). |
| Places | A capacity within an aged care service for the provision of residential care, community care or flexible care in the residential care context to an individual (Aged Care Act 1997 (Cth)); also refers to ‘beds’ ( Aged Care (Consequential Provisions) Act 1997 (Cth), s.16). |
| Primary carer | In the ABS SDAC, a primary carer is defined as a person who provides the most informal assistance to a person with one or more disabilities, with one or more of the core activities of mobility, self care or communication. |
| Respite care | Alternative care arrangements for dependent people living in the community, with the primary purpose of giving a carer or a care recipient a short term break from their usual care arrangement. |
| Selected equity groups | Section 11‑3 of the Aged Care Act 1997, specifies the following as selected equity groups: people from Aboriginal and Torres Strait Islander communities; people from culturally and linguistically diverse backgrounds; veterans; people who live in rural or remote areas; people who are financially or socially disadvantaged; people who are homeless or at risk of becoming homeless; care‑leavers; parents separated from their children by forced adoption or removal; and lesbian, gay, bisexual, transgender and intersex people. |
| Serious Incident Response Scheme (SIRS) | The Serious Incident Response Scheme requires aged care providers to:
|
| Veterans | Veterans, war widows, widowers and dependants who hold a Repatriation Health Card and are entitled to health services and treatment under the Veterans’ Entitlements Act 1986, Safety, Rehabilitation and Compensation Act 1988 or the Military Rehabilitation and Compensation Act 2004. |
ACQSC (Aged Care Quality and Safety Commission) 2020, Quality Standards, https://www.agedcarequality.gov.au/providers/standards (accessed 4 September 2025).
ABS (Australian Bureau of Statistics) 2024, Disability, Ageing and Carers, Australia: Summary of Findings https://www.abs.gov.au/statistics/health/disability/disability-ageing-and-carers-australia-summary-findings/latest-release#cite-window1) (accessed 15 October 2025).
—— 2023, Aboriginal and Torres Strait Islander life expectancy https://www.abs.gov.au/statistics/people/aboriginal-and-torres-strait-islander-peoples/aboriginal-and-torres-strait-islander-life-expectancy/latest-release#cite-window1 (accessed 15 October 2025).
AIHW (Australian Institute of Health and Welfare) 2018, Cause of death patterns and people’s use of aged care: A Pathway in Aged Care analysis of 2012–14 death statistics, Cat. no. AGE 83, https://www.aihw.gov.au/reports/aged-care/cause-of-death-patterns-peoples-use-of-aged-care/summary (accessed 12 October 2025).
Commonwealth of Australia 2023, 2023 Intergenerational Report, https://treasury.gov.au/publication/2023-intergenerational-report (accessed 2 October 2025).
DoHA (the former Department of Health and Ageing) 2012, 2011–2012 Report on the Operation of the Aged Care Act 1997, 2011–12 Report on the Operation of the Aged Care Act 1997 - AIHW Gen (accessed 10 December 2025).
DoHDA (Department of Health, Disability and Ageing) 2025a, Aged care data snapshot – 2025, https://www.gen-agedcaredata.gov.au/resources/access-data/2024/october/aged-care-data-snapshot-2024 (accessed 18 November 2025).
—— 2025b, National Aged Care Mandatory Quality Indicator Program Manual – 4.0 – Part A, National Aged Care Mandatory Quality Indicator Program Manual 4.0 – Part A | Australian Government Department of Health, Disability and Ageing (accessed 15 December 2025).
A PDF of Part F Community services can be downloaded from the Part F sector overview page.

Differences in the representation of a selected equity group in services compared to their representation in the aged care target population varied across service types and groups (table 14.1). Nationally in 2024-25: