Report on Government Services 2026
PART A, SECTION 1: RELEASED ON 29 JANUARY 2026
1 Approach to performance measurement
The Report on Government Services (the report) provides information on the equity, effectiveness and efficiency of government services in Australia. By encouraging improvements in these services, the report contributes to the wellbeing of all Australians. Governments use the report to inform policy and evaluation, for budgeting (including to assess the resource needs and performance of government agencies) and to demonstrate accountability.
This report provides a dynamic online presentation underpinned by machine readable data in a CSV format as well as data provided in Excel format.
Reasons for measuring performance
Measuring and publicly reporting on the performance of governments in delivering services creates incentives to improve performance by:
- clarifying government objectives and responsibilities
- providing indicators of policy and program performance over time
- enhancing transparency to the community through the provision of relevant information
- highlighting innovation and opportunities for improvement.
A key focus of the report is measuring the comparative performance of government services across jurisdictions. Reporting on comparative performance can provide incentives to improve performance where there is no or little competition, and provides a level of accountability to consumers, who have minimal opportunity to express their preferences by accessing services elsewhere.
The terms ‘comparative performance reporting’ and ‘benchmarking’ are sometimes used interchangeably. However, benchmarking typically involves assessing performance against a predetermined standard, which this report generally does not do. Instead, this report measures, for example, the average or median time taken to access particular services (expressed in minutes, days, months) rather than the proportion of people who access services within predetermined 'target' timeframes. Governments can use the information in this report to identify appropriate benchmarks.
Scope of the report
Governments provide a range of services to people, households and the community. This report focuses on measuring the performance of governments delivering social services (such as, health, education, and community services), which aim to enhance wellbeing by improving tangible outcomes (for example, cancer screening rates, student outcomes) and intangible outcomes (for example, self-reported patient satisfaction, student engagement). The report presents performance information on child care, education and training, health, justice, emergency management, community services, social housing, and homelessness across 17 service areas. The service areas included in the report were chosen based on a set of formal criteria.
Recurrent government expenditure on the services in this report was approximately $412 billion in 2023-24 (2023-24 dollars) (figure 1.1) – a significant proportion (around 70%) of total recurrent government expenditure. This is equivalent to around 15% of gross domestic product (estimates based on 2025 ABS data). Updated financial data for the 2024-25 financial year is available for some sections.
Figure 1.1 – Recurrent government expenditure by sectora
a Changes in sector expenditure over time can be partly due to the reallocation of services between sectors in line with broad policy shifts (or changes in the data source). Readers are encouraged to check service areas within each sector to confirm coverage for the relevant year.
Governments use a mix of methods to deliver services to the community, including providing services directly (a ‘delivery/provider’ role), funding external providers through grants or the purchase of services (a ‘purchaser’ role) and subsidising users (via vouchers or cash payments) to access services from external providers.
As non‑government organisations are often involved in the delivery of services, government funding may not cover the full cost of delivering services to the community. Since the purpose of this report is to inform government decision-making about the effectiveness and efficiency of government purchase or supply of services, the scope is confined to the cost to government. Similarly, this report does not include detailed information on general government income support. For example, the report covers aged care services but not the age pension and child care services but not family payments (although descriptive information on income support is included in some cases).
Performance across agencies, jurisdictions and over time is influenced by a range of factors outside government control, such as geography, economic circumstances, available inputs and input prices. While the report generally does not adjust results for these factors, some indicators are aligned with other national reporting exercises (for example, casemix adjustment to account for patient complexity when measuring comparative hospital costs in section 12). Instead, the report notes government performance in delivering services is one contributing factor and, where possible, provides data on other key contributing factors, including different geographic and demographic characteristics across jurisdictions. Section 2 contains detailed statistics for each state and territory, which may assist in interpreting the performance indicators presented in the report.
Conceptual approach
The report applies a consistent conceptual approach to measure performance across service areas. This allows for comparisons in performance across services, improvements in reporting within one area to be applied across others and supports a coordinated response to issues that span multiple service areas.
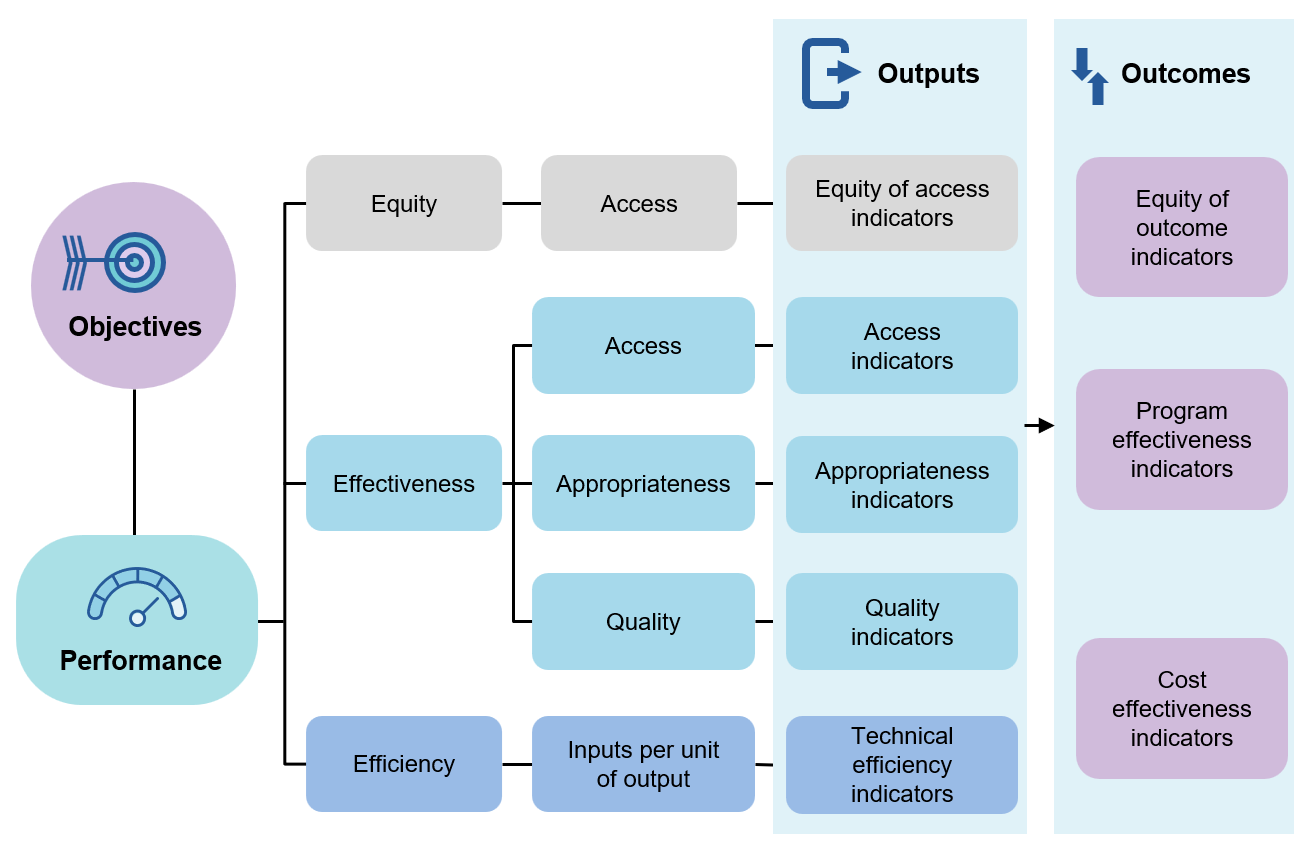
The performance indicator framework
Each service area in the report includes a set of objectives and a performance indicator framework against which government performance is measured (figure 1.2). Performance indicator frameworks include output indicators (grouped according to equity, effectiveness and efficiency domains) and outcome indicators.
Figure 1.2 – General performance indicator framework
The framework reflects the process through which inputs are transformed into outputs and outcomes in order to achieve desired objectives (figure 1.3). Service providers transform resources (inputs) into services (outputs). The rate at which resources are used to make this transformation is known as ‘technical efficiency’.
Figure 1.3 – Example of a service process – school education
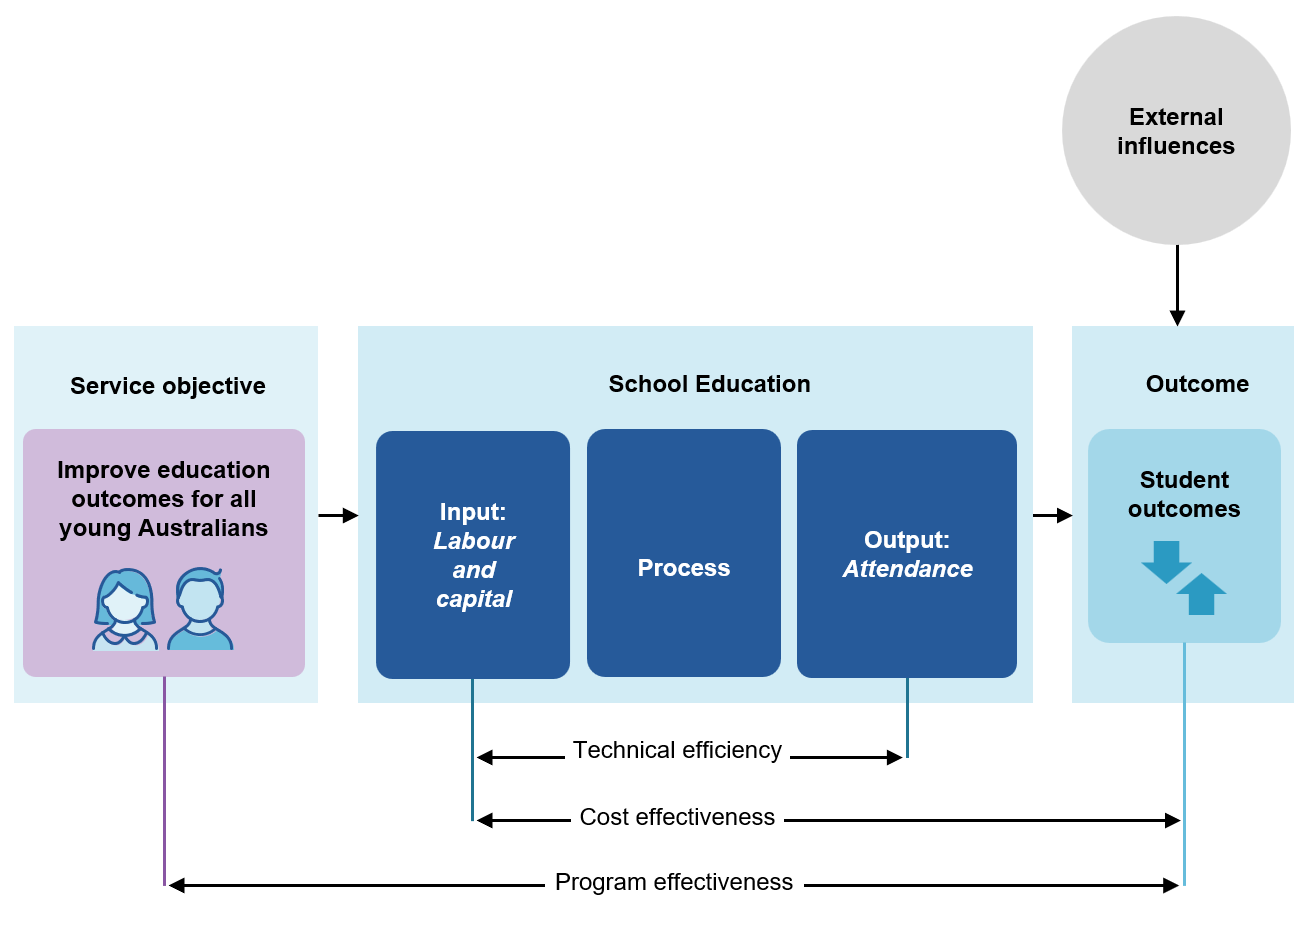
The impact of outputs on people, households and the community are the outcomes of a service. In the report, the rate at which inputs are used to generate outcomes is referred to as ‘cost effectiveness’. Although no explicit cost effectiveness indicators are currently included in the report, implicit cost effectiveness reporting is achieved through combinations of efficiency and effectiveness indicators, and combinations of efficiency and outcome indicators.
Objectives
Each service area includes a set of objectives, agreed by all governments, against which performance is measured. Objectives are structured consistently across service areas and comprise three key components:
- the high-level vision for a service
- the service delivery characteristics that contribute to effectiveness (for example, quality, safety, timeliness)
- that services are provided in an equitable and efficient manner.
Outcome indicators are linked to the high-level vision, whereas output indicators measure the equity, effectiveness and efficiency of services. These concepts are discussed in more detail below.
Output indicators
While the report aims to focus on outcomes, these can be difficult to measure directly. Therefore, the report includes output measures where there is a relationship between outputs and desired outcomes. Output information is also critical for equitable, effective and efficient management of government services, and is often the level of performance information most relevant to people who access those services.
Equity, effectiveness and efficiency indicators are given equal prominence in the report's performance indicator framework. Measuring performance across all three domains is essential, as there are often inherent trade-offs in allocating resources and therefore limitations in analysing only some aspects of service performance. For example, a service with higher costs may be more effective than a lower cost service and therefore be more cost effective. In addition, improving service access and outcomes for equity groups may result in higher average unit costs.
Equity indicators
Equity indicators measure how well a service is meeting the needs of people who have specific challenges accessing government services. Equity–access indicators measure whether services are equally accessible to all members of the community regardless of personal characteristics such as cultural background or geographic location. Effectiveness and outcome indicators may also have equity dimensions when assessing gaps in performance between selected equity groups and the comparison/general population (for example, readmissions to hospital within 28 days of discharge, by Indigenous status and achievement of sustained housing, by Indigenous status).
Equity groups for whom disaggregated data is commonly reported across the report include:
- Aboriginal and Torres Strait Islander people
- People living in rural or remote areas
- People from a non-English speaking background
- People with disability (whose access to specialist disability services is also reported in section 15).
To assess equity of access, the report often compares the proportion of people in the population in the selected equity group to their proportion in the service use population. This approach is suitable for services provided on a near-universal basis (for example, preschool education) but must be used with caution for other services where service provision is based on assessed need. In such cases, comparisons should ideally be made across selected equity groups on the basis of need (for example, disability services uses potential populations for each selected equity group).
Effectiveness indicators
Effectiveness indicators measure how well the outputs of a service meet its delivery objectives. The performance indicator framework groups effectiveness indicators according to characteristics considered important to the service. For most sections, these characteristics include access, appropriateness, quality, and sustainability.
Access
Access indicators measure how easily the community can obtain a service. Access indicators are generally categorised according to three domains:
- Overall access indicators measure how readily services are accessed by people who need them across the eligible or relevant population (for example, access to specialist disability services is measured according to the ‘potential population’ based on disability prevalence). Due to difficulties directly measuring access, indirect measures are often included, such as measures of unmet need (section 15) or enrolment in preschool (section 3).
- Timeliness of access indicators measure the time it takes for consumers to access services (expressed in minutes, days or months using administrative data or self-reported survey data). These measures are important where there is a limited supply of services, which can result in access delays (for example, waiting times for health and aged care services) and where time is critical (for example, emergency services response times).
- Affordability indicators measure the cost burden on consumers where they are responsible for part of the cost of a service (for example, child care out-of-pocket costs in section 3 or the proportion of people who delayed or did not fill a prescription due to cost in section 10). These measures are important as affordability might be a barrier to service access.
Appropriateness
Appropriateness indicators measure how well services meet client needs (for example, whether students achieve their main reason for training in section 5). Appropriateness is distinct from access, as it measures performance in meeting the needs of people who already have access to the service.
Appropriateness indicators also seek to identify whether the level of service received is appropriate for the level of need. Some services have developed measurable standards of service need, against which levels of service provision can be assessed (for example, the ‘match of dwelling to household size’ indicator in section 18 measures the appropriateness of the size of the dwelling relative to the size and composition of the household).
Quality
Quality indicators measure whether services meet expectations and conform to standards and specifications (for example, aged care quality standards, health service accreditation requirements). Information about service quality is important to assess whether efficiency is achieved at the expense of quality, and that all relevant aspects of performance are considered.
The report includes both direct and implied (or proxy) indicators:
- Direct indicators measure the frequency of positive (or negative) events resulting from service delivery.
- Implied or proxy indicators measure the extent to which aspects of a service conform to specifications.
Quality indicators in the report generally relate to one of four categories:
- Standards – whether services are accredited or meeting required standards (for example, compliance with aged care service standards and health service accreditation requirements).
- Safety – whether services provided are safe (for example, deaths in police custody, serious incidents in aged care, sentinel events in hospitals).
- Responsiveness – whether services are client orientated and responsive to client needs (for example, measures of patient satisfaction).
- Continuity – whether services provide coordinated or uninterrupted care over time and across service providers (for example, community follow-up after psychiatric admission).
Sustainability
Broadly defined, sustainability can relate to financial, social, and environmental dimensions of service performance. In this report, the concept of sustainability is typically defined as 'workforce sustainability' and relates to the capacity of a workforce to meet current and projected service demands (for example, the nursing, allied health and medical workforce in the health care sector). In some sectors, volunteers play a vital role. Where relevant, the report includes contextual information on volunteer numbers (for example, firefighting volunteers in the emergency services sector and kinship and foster carers in the child protection system).
Efficiency
Economic efficiency comprises several dimensions:
- Technical efficiency means that goods and services are produced at the lowest possible cost.
- Allocative efficiency means that the goods and services consumers value most are produced from a given set of resources.
- Dynamic efficiency means that, over time, consumers are offered new and better products, and existing products at lower cost.
The report focuses on technical (or productive) efficiency. Technical efficiency indicators measure how well services use their resources (inputs) to produce outputs that contribute to desired outcomes. A common example is government funding per unit of output delivered (for example, cost per annual hour for vocational education and training in section 5).
Some efficiency indicators included in the report are incomplete or proxy measures of technical efficiency. For example, indicators that do not capture the full cost to government of providing services are considered incomplete measures of technical efficiency. Other indicators of efficiency, such as partial productivity measures, are used where there are shortcomings in the data (for example, judicial officers per finalisation in section 7).
In addition, some service areas report on the cost per head of total/eligible population, rather than the cost per person actually receiving the service or another unit of output. These are not measures of technical efficiency, but the cost of providing the service relative to the total/eligible population.
Outcome indicators
Outcome indicators provide information on the overall impact of a service on people and the community, unlike output indicators, which report on the characteristics of service delivery. Outcomes may be short or longer term. For example, in school education, learning outcomes at years 3, 5, 7 and 9 may be considered intermediate outcomes, while completion of year 12 or school leaver destinations may be considered longer term outcomes (section 4). The report includes both types of outcome indicators, as appropriate.
In contrast to outputs, outcome indicators:
- typically depend on multiple service characteristics
- are more likely to be influenced by factors outside the control of governments and service providers.
Guiding principles for the report
The Steering Committee's guiding principles provide the basis for reporting across service areas (box 1.1). These principles are based on schedule C of the Intergovernmental Agreement on Federal Financial Relations (IGA FFR) (IGA FFR 2022). There can be trade-offs when applying these principles. For example, sometimes timely data might have had less opportunity to undergo rigorous validation. The approach in the report is to publish best available, albeit imperfect data, with caveats. This approach supports the Steering Committee to meet its Terms of Reference, including transparency and accountability to the public, while overseeing an annual program of review and continuous improvement. Important information about data quality is included in the relevant sections and data tables. More information on data quality for some indicators and measures is available from external data providers including the ABS and AIHW. Data Quality Statements for National Agreement indicators and datasets maintained by the AIHW can be accessed here:
Box 1.1 – Guiding principles for the report
Comprehensive – performance should be assessed against all objectives.
Streamlined – reporting should be concise, measuring performance against indicators aligned to agreed objectives, with contextual information included when necessary to support interpretation.
Meaningful – data should measure what it claims to measure. Proxy indicators should be clearly identified and the development of more meaningful indicators encouraged where practicable.
Understandable – data should be reported in a way that is meaningful to a broad audience, many of whom will not have technical or statistical expertise.
Timely – data for each reporting period should be the most recent possible. Incremental reporting when data becomes available, and then updating all relevant data over recent years, is preferable to waiting until all data is available.
Comparable – data should be comparable across jurisdictions and over time. Where data is not yet comparable across jurisdictions, time series data within jurisdictions is particularly important.
Complete – data should be reported for all jurisdictions (where relevant), but where this is not possible, data should be reported for jurisdictions that can report, rather than waiting until data is available for all.
Administratively simple and cost effective - use acceptable performance indicators that are already in use in other national reporting arrangements, where appropriate, to reduce duplication and minimise reporting burden.
Accurate – data should be of sufficient accuracy to provide confidence in analysis based on information in the report.
Hierarchical – outcome indicators should be underpinned by output indicators and additional disaggregated data where a greater level of detail is required.
A focus on outcomes – performance reporting should focus on outcomes, reflecting whether service objectives have been met, supplemented by input and output measures where they relate to desired outcomes.
Validation – data can vary in the extent to which it has been reviewed or validated (at a minimum, all data is endorsed by the provider and subjected to peer review).
Full costing of services – unit cost estimates should reflect the full cost to government (where possible).
Source: Adapted from schedule C of the Intergovernmental Agreement on Federal Financial Relations (2022).
Costing of services
Consistent with the Steering Committee's guiding principles, expenditure on services should be reported on a comparable basis and capture the full cost to government. Issues that have affected the comparability and coverage of costs in the report include:
- accounting for differences in the treatment of payroll tax (SCRCSSP 1999)
- including the full range of capital costs (SCRCSSP 2001)
- apportioning applicable departmental overhead costs
- reporting non-government sourced revenue.
Payroll tax
The Steering Committee’s preference is to remove payroll tax from reported costs, where feasible, so that cost differences between jurisdictions are not caused by differences in payroll tax policies. However, in some sections it has not been possible to separately identify payroll tax, so a hypothetical amount is included in cost estimates for exempt services.
Capital costs
Under accrual accounting, items are accounted for as they are earned or incurred, for example the capital used (or consumed) in a particular year, rather than the cash expenditure incurred in its purchase (such as the purchase costs of a new building). Capital costs comprise two distinct elements:
- Depreciation – defined as the annual consumption of non-current physical assets used in delivering government services.
- User cost of capital – the opportunity cost of funds tied up in the capital used to deliver services (that is, the return that could have been generated if the funds were employed in their next best use).
Both depreciation and the user cost of capital should be included in unit cost calculations (with the user cost of capital for land reported separately). The user cost of capital rate should be applied to all non-current physical assets, less any capital charges and interest on borrowings already reported by the agency (to avoid double counting). The rate applied for the user cost of capital is based on a weighted average of rates nominated by jurisdictions (currently 8%).
Differences in asset measurement techniques can have a major impact on reported capital costs (SCRCSSP 2001). However, the differences created by these asset measurement effects are generally relatively small in the context of total unit costs, because capital costs represent a relatively small proportion of total cost (except for housing). The adoption of national uniform accounting standards across all service areas would be a desirable outcome for the report.
Other costing issues
Other costing issues include the apportionment of costs shared across services (mainly overhead departmental costs) and the treatment of non-government sourced revenue.
- Full apportionment of departmental overheads (i.e., full cost recovery) is consistent with the Steering Committee's guiding principle that the report should capture the full cost to government of providing services. The practice of apportioning overhead costs varies across services in the report.
- The treatment of non-government sourced revenue varies across services in the report. Some services deduct such revenue from their efficiency estimates. Ideally when reporting technical efficiency for services which governments provide directly, the estimates should be reported both including and net of revenues. Some services report net of revenue only. This is usually in cases where the amounts concerned are relatively small (for example, courts). The costs reported are therefore an estimate of the net cost to government.
References
ABS (Australian Bureau of Statistics) 2025, Australian National Accounts: National Income, Expenditure and Product, Australian National Accounts, June 2025, https://www.abs.gov.au/statistics/economy/national-accounts/australian-national-accounts-national-income-expenditure-and-product/latest-release (accessed 4 September 2025).
IGA FFR (Intergovernmental Agreement on Federal Financial Relations) 2022, IGA FFR schedule C, https://federalfinancialrelations.gov.au/intergovernmental-agreement-federal-financial-relations (accessed 30 September 2025).
SCRCSSP (Steering Committee for the Review of Commonwealth/State Service Provision) 1999, Payroll Tax in the Costing of Government Services, Productivity Commission.
—— 2001, Asset Measurement in the Costing of Government Services, Productivity Commission.
A PDF of Part A Approach to performance reporting can be downloaded from the Part A Approach to performance reporting page.
