Report on Government Services 2026
PART E: RELEASED ON 5 FEBRUARY 2026
E Health

Data downloads
These data tables relate to the sector as a whole. Data specific to individual service areas is in the data tables under the relevant service area.
Refer to the Sector overview text and corresponding table number in the data tables for detailed definitions, caveats, footnotes and data source(s).
Note: Data tables are referenced by table xA.1, xA.2, etc, with x referring to the section or overview. For example, table EA.1 refers to data table 1 for this sector overview.
Main aims of services within the sector
The main objective of the health sector is that Australians are born and remain healthy. To achieve this, health sector services aim to promote, restore and maintain a healthy society through the delivery of services that prevent illness, promote health, detect and treat illness and injury, rehabilitate and provide palliative care.
In Australia, the health sector consists of four main services.
![]()
Primary and community health
Primary and community health services aim to promote health, prevent illness and support people to manage their health issues in the community. These include general practice, pharmaceutical services, dentistry, allied health services, community health services, maternal and child health and alcohol and other drug treatment.
- Total government real recurrent expenditure on primary and community health services was $51.6 billion in 2023-24.
- There were 29,976 full-time equivalent (FTE) general practitioners (GPs), equating to 110.2 per 100,000 people nationally in 2024.
- Around 232.8 million services were subsidised under Section 85 and Section 100 of the Pharmaceutical Benefits Scheme (PBS) in 2024-25.
![]()
Ambulance services
Ambulance service organisations are the primary agencies involved in providing emergency medical care, pre-hospital and out-of-hospital care, and transport services.
- Total government real recurrent expenditure on ambulance services was $6.4 billion in 2024-25.
- There were 26,603 registered paramedics in Australia in 2024-25.
- There were 5.9 million ambulance responses to 4.5 million incidents in 2024-25.
![]()
Public hospitals
Public hospitals aim to alleviate or manage illness and the effects of injury by providing acute, non- and sub-acute care along with emergency and outpatient care.
- Total government real recurrent expenditure on public hospitals (excluding depreciation) was $103.1 billion in 2023-24.
- There were 704 public hospitals in Australia in 2023-24, comprising 67,280 public hospital beds (equivalent to 2.5 beds per 1,000 people).
- Approximately 7.5 million separations from public (non-psychiatric) hospitals in 2023-24.
![]()
Services for mental health
Services for mental health aim to promote mental health and wellbeing, and where possible prevent the development of mental health problems; and when mental health problems and illness do occur, reduce their impact.
- Total government real recurrent expenditure allocated to mental health services was $13.8 billion in 2023-24.
- A further $5.7 billion was provided to support people with a significant and enduring primary psychosocial disability through the National Disability Insurance Scheme (NDIS) in 2024-25.
- 13.3 million Medicare-subsidised services for mental health were provided in Australia in 2024-25. This includes Medicare-subsidised mental health services provided by psychologists, psychiatrists, general practitioners and other allied health professionals.
Detailed information on the equity, effectiveness and efficiency of service provision and the achievement of outcomes for the primary and community health, ambulance services, public hospitals, and mental health services is contained in the service-specific sections.
Government expenditure in the sector
Total government recurrent expenditure for health services for the latest years covered in this report was $160.5 billion.
For the 2023‑24 financial year (the most recent financial year for which data are available across all sections) this represented 39.0% of total government expenditure covered in this report.
As much of the expenditure on services for mental health is already captured in public hospital and primary and community health expenditure, it is not included in the health sector expenditure total to avoid double counting.
Flows in the sector
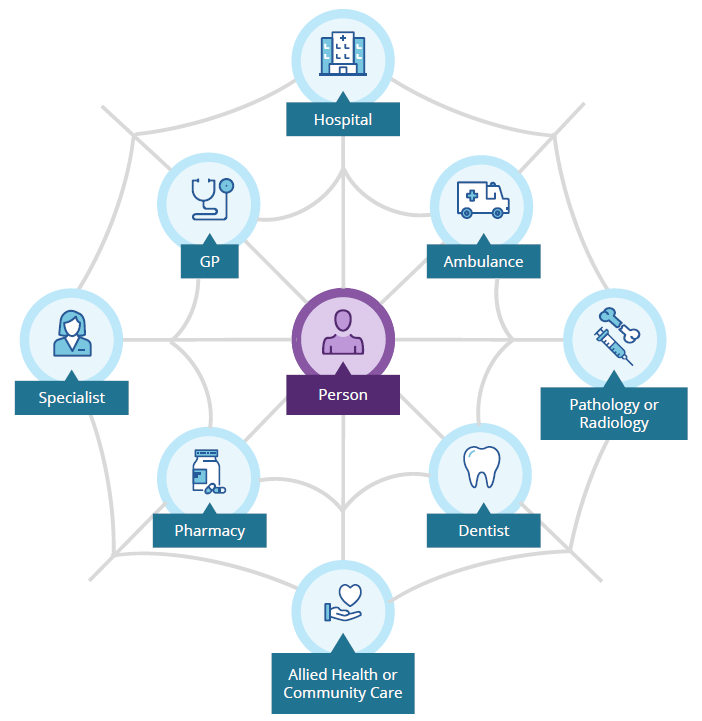
Health services in Australia are delivered by a variety of government and non‑government providers in a range of service settings that do not have a clearly defined path (figure E.1).
Figure E.1 Client flow within the Australian health care system
Intersection of ambulance services and public hospital emergency departments
The intersection of ambulance services and public hospital emergency departments (EDs) is a vital component of the healthcare system, facilitating patients receiving timely and effective emergency care. Efficient ambulance-to-ED transfers ensures timely treatment, prevents complications, and maintains emergency service capacity (Dawson et al. 2022).
Delays in transfers may disrupt patient care and limit ambulance and ED response capabilities, increasing strain on the health system (Mengyu et al. 2019). Delays may result from hospital overcrowding, partly a consequence of increasing presentations to EDs (AIHW 2025a; Crawford et al. 2014). Long-stay patients awaiting discharge can further reduce hospital capacity and delay admissions from the ED (IFEM 2020). Limited aged care and disability support services, along with staff and resource shortages may compound the issue (Kruk 2023; Queensland Health 2024).
Governments are working to minimise patient transfer delays to provide immediate medical care for lower acuity patients and divert unnecessary presentations from EDs (DHDA 2023; Savira et al. 2025). For example:
- Medicare Urgent Care Clinics aim to ease the pressure on hospitals and give patients more options to see a health care professional when they have an urgent, but not life threatening, need for care.
- 'Hospital in the Home’ programs which provide hospital-level care at home also aim to increase availability of hospital beds by reducing demand (Montalto et al. 2020).
- Virtual Emergency Department care provides urgent medical care remotely, particularly for conditions that are not life-threatening. These services allow patients to connect with emergency-trained health professionals via telehealth, potentially avoiding the need to visit a physical ED.
These measures diversify the care settings available to patients and provide an alternative to public hospital-based care, thus increasing hospital capacity and reducing patient transfer delays.
This overview provides selected population health insights across four themes:
- Babies born of low birthweight
- Selected potentially preventable diseases
- Life expectancy
- Mortality rates
- Health workforce
Babies born of low birthweight
Nationally in 2023, 5.2% of babies born in Australia were of low birthweight (figure E.2). Around 10% of babies born to Aboriginal and Torres Strait Islander mothers were of low birthweight (table EA.2).
Further information on the historical and ongoing context for Aboriginal and Torres Strait Islander people is available on the Closing the Gap Information Repository website – Target 2.
Selected potentially preventable diseases
Selected potentially preventable diseases are diseases that could potentially have been prevented through the provision of health interventions and early disease management. Diseases covered in this report include selected cancers, heart attacks and type 2 diabetes.
- Nationally in 2022, the age standardised rate of new cases of selected cancers was highest for female breast cancer (126.4 per 100,000 females), followed by melanoma, bowel cancer and lung cancer (50.2, 45.1 and 40.7 per 100,000 people, respectively) and lowest for cervical cancer (6.8 per 100,000 females) (table EA.3). Data by remoteness area and Indigenous status is reported in tables EA.4 and EA.5.
- Nationally in 2023, the age standardised rate of heart attacks (acute coronary events) was 261.9 cases per 100,000 people aged 25 years or over (table EA.6). The national rate has decreased each year over the 10 years included in this report. The rate for females is more than half the rate for males (table EA.7).
- Nationally in 2022, an estimated 4.5% of adults had diabetes (table EA.8). Nationally in 2022–24, an estimated 15.5% of Aboriginal and Torres Strait Islander adults had diabetes (ABS 2025).
Life expectancy
Historically, life expectancy has risen steadily over time but has decreased in recent years. In 2022–24, life expectancy at birth was 81.1 years for males and 85.1 years for females – the same as 2021–23 (table EA.9). The life expectancy of Aboriginal and Torres Strait Islander people is lower than that of other people, with a life expectancy at birth of 71.9 years for Aboriginal and Torres Strait Islander males and 75.6 years for Aboriginal and Torres Strait Islander females born between 2020–22 (table EA.10).
Further information on the historical and ongoing context for Aboriginal and Torres Strait Islander people is available on the Closing the Gap Information Repository website – Target 1.
Mortality rates
The national age standardised mortality rate was 507.7 deaths per 100,000 people in 2024 – down from 2023 (figure E.3). In line with life expectancy data, mortality rates are higher for Aboriginal and Torres Strait Islander people compared to non-Indigenous people (table EA.12).
Child mortality
Mortality data is separately reported for children as follows:
- Registered perinatal deaths, comprising fetal deaths (stillbirths) and neonatal deaths (death of an infant within 28 days of birth)
- Registered infant deaths (children aged less than 1 year)
- Registered infant and child deaths (children aged 0–4 years).
Registered perinatal, infant and child deaths data are sourced from the Australian Bureau of Statistics (ABS) Causes of Death collection, which is based on information from births, deaths, and marriage registrars. Further information on hospital recorded perinatal deaths is available from the Australian Institute of Health and Welfare (AIHW) National Perinatal Mortality Data Collection (2025b).
Nationally in 2024:
- there were 10.0 registered perinatal deaths per 1,000 births (table EA.15), of which around 75.6% were fetal deaths and the remainder neonatal deaths (tables EA.13–14)
- the average infant mortality rate was 3.3 registered deaths per 1,000 live births (table EA.16). Over the past 10 years, the average infant mortality rate has ranged from 3.1 (2016 and 2018) to 3.3 (2017, 2019, 2021, and 2024) registered deaths per 1,000 live births.
The combined infant and child mortality rate (three-year average) has decreased over time from 80.7 deaths per 100,000 population in 2013–15 to 73.8 deaths per 100,000 population in 2022–24 (table EA.17).
Data by Indigenous status is available in tables EA.18–20. Further information on the historical and ongoing context for Aboriginal and Torres Strait Islander people is available on the Closing the Gap Information Repository website – Target 1.
Causes and prevention
The most common causes of death among all Australians in 2024 were neoplasms (cancer) and circulatory diseases (including heart disease, heart attack and stroke) (table EA.21). Data by Indigenous status is available in table EA.22.
There is potential to prevent some deaths through individualised care and/or to treat health conditions through existing primary or hospital care.
- Nationally, there were 99.1 potentially avoidable deaths per 100,000 people in 2024 – up on 2023 (98.6 per 100,000 people) (table EA.23).
- The rate of potentially avoidable deaths in 2020–24 for Aboriginal and Torres Strait Islander people was 309.0 per 100,000 people – the highest rate over the reported time series (since 2017–21) (table EA.24).
Data on key risk factors affecting population health outcomes (including overweight or obesity, smoking and risky alcohol consumption) are available in tables EA.26–29. Nationally in 2022:
- 33.7% of adults were overweight, while 31.1% were obese – down and up, respectively, since 2017-18. Additionally, 19.5% of children aged 5–17 years were overweight, while 8.3% were obese – up since 2017-18 (table EA.26).
- 10.7% of adults reported that they were current daily smokers, the lowest proportion recorded in the time series (since 2007-08) (table EA.27).
- 27.1% of adults exceeded the alcohol lifetime risk guidelines (as defined by the 2020 National Health and Medical Research Council [NHMRC] guidelines) (table EA.29). A time series of Australians who exceeded the 2009 NHMRC alcohol lifetime risk guidelines is available in table EA.28.
Data on key risk factors affecting Aboriginal and Torres Strait Islander people is available in tables EA.30–33. Nationally in 2022-23, among Aboriginal and Torres Strait Islander people over the age of 18:
- 71.5% reported being overweight or obese (table EA.30)
- 31.4% reported that they smoke daily, the lowest proportion recorded in the available time series (table EA.31)
- 36.3% reported long-term risky alcohol consumption under the 2020 NHMRC guidelines (table EA.33). A time series under the 2009 NHMRC alcohol lifetime risk guidelines is available in table EA.32.
Further information on the historical and ongoing context for Aboriginal and Torres Strait Islander people is available on the Closing the Gap Information Repository website – Target 1.
Health workforce
The healthcare workforce is essential to the functioning of the health system, providing care, supporting public health efforts, and ensuring operational continuity. Nationally in 2024, there were:
- 122,749 FTE medical practitioners, including 815 who identified as Aboriginal and Torres Strait Islander, up 7% from 2023 (table EA.34).
- 372,821 FTE nurses and midwives, the eighth consecutive increase over an eight-year period (table EA.35)
Data for allied health professionals, dentists and allied dental workers is available in tables EA.36–38.
A summary of the primary and community health, ambulance services, hospitals and mental health services performance indicator results are presented. Detailed information is in the service-specific sections.
- Delaying seeing a GP or filling a prescription due to affordability concerns has improved, however, remains higher than pre-pandemic levels.
Nationally in 2024-25:- 7.7% of respondents who needed to see a GP reported that they delayed or did not see a GP in the last 12 months due to cost, down from 8.8% in 2023-24 and a departure from year-on-year increases since 2020-21 when the proportion was 2.4%, however, remains higher than pre-pandemic levels in 2018-19 (3.4%).
- 7.5% of respondents who needed a prescription for medication reported that they delayed filling or did not fill a prescription in the last 12 months due to cost, down from 8.0% in 2023-24 and a departure from year-on-year increases since 2020-21 when the proportion was 4.4%, however, remains higher than pre-pandemic levels in 2018-19 (6.7%).
- The proportion of children who are fully immunised has decreased to a 10-year low while notifications of selected childhood diseases increased over the same period.
Nationally in 2024-25:- 91.6% of children aged 12 to less than 15 months, 89.8% of children aged 24 to less than 27 months, 93.3% of children aged 60 to less than 63 months were fully immunised. This represents respective percentage point decreases of 3.3, 2.8 and 1.9 since peak rates recorded in 2020-21
- 93.5% of children aged 60 months to less than 63 months were fully immunised against diphtheria, tetanus and pertussis (whooping cough).
- notifications of whooping cough are up to 792.1 per 100,000 children. For the years pre-pandemic (2015-16 to 2018-19), the average rate of notifications of whooping cough was 183.5 per 100,000 children.
- The proportion of general practices successfully accredited against the Royal Australian College of General Practices' Standards (National General Practice Accreditation (NGPA) scheme) remains high.
Nationally in 2024:- 99% of the 1,982 general practices that were assessed for accreditation were successfully accredited.
More information: section 10 Primary and community health
- Ambulance response times across Australia deteriorated for the majority of jurisdictions compared to previous years.
All jurisdictions except Tasmania (90th percentile) and South Australia (50th percentile) recorded longer response times compared to previous years. In 2024-25:- the time within which 90% of first responding ambulance resources arrived at the scene of an emergency in code 1 situations ranged from 17.8 minutes (Australian Capital Territory) to 47.9 minutes (Northern Territory) state-wide
- for the Northern Territory, the time within which 90% of first responding ambulance resources arrived at the scene of an emergency in code 1 situations was 47.9 minutes, state-wide, up from 31.1 minutes in 2023-24
- the time within which 50% of first responding ambulance resources arrived at the scene of an emergency in code 1 situations ranged from 10.3 minutes (Western Australia) to 16.3 minutes (Northern Territory) state-wide.
- Nationally, the proportion of patients who reported a clinically meaningful pain reduction was the lowest recorded.
‘Pain management’ is defined as the proportion of patients who report a clinically meaningful reduction in pain severity. Patients who refuse pain medication are excluded from reporting. Nationally in 2024-25:- the proportion of patients who reported clinically meaningful pain reduction at the end of ambulance service treatment was 80.4%. This continues a year-on-year decrease since 2019-20 and is the lowest recorded proportion over the 10-year time series.
- Nationally, cardiac arrest survival rates improved compared to the prior year.
‘Cardiac arrest survival rate’ is defined as the proportion of adult patients (aged 16 years or over) who were in out‑of‑hospital cardiac arrest and returned to spontaneous circulation (that is, the patient had a pulse) on arrival at hospital. Nationally in 2024-25:- the cardiac arrest survival rate for paramedic witnessed cardiac arrests was 50.0% nationally (up from 49.0% in 2023-24)
- the cardiac arrest survival rate for non-paramedic witnessed cardiac arrests where resuscitation was attempted was 26.6% (up from 25.7% in 2023-24).
More information: section 11 Ambulance services
- Almost all category 1 patients were seen within clinically appropriate timeframes. However, the proportion of patients seen within clinically appropriate timeframes across all triage categories remains lower than it has been over the time series.
In 2024-25:- all category 1 patients (need for resuscitation) were seen within clinically appropriate timeframes in New South Wales, Victoria, Queensland, Western Australia and Tasmania, but 1% in South Australia and the ACT, and 1% in the Northern Territory were not seen immediately.
- the proportion of category 2 patients (emergency) seen within 10 minutes was 68% – down over the past 10 years from 77% in 2015-16
- for all triage categories combined, an estimated 67% of patients were seen within triage category timeframes – down over the past 10 years from 74% in 2015-16.
- Waiting times for admitted patients have shown some improvements but they remain higher than they have been over the time series.
Nationally in 2024-25:- 50% of patients were admitted within 45 days (down slightly from 46 days in 2023-24) and 90% of patients were admitted within 329 days (unchanged from 2023-24). While showing some improvement in recent years, waiting times for admitted patients remain notably higher than they were ten years ago (38 days for 50% of patients and 263 days for 90% of patients in 2015-16)
- 30% of people who presented to an emergency department and were admitted, waited four hours or less to be admitted to a public hospital; slightly down from 31% 2023-24 and notably lower than the proportion in 2015-16 (49%).
- Adverse events continue to occur across Australian public hospitals at a similar rate.
‘Adverse events treated in hospitals’ are incidents in which harm resulted to a person during hospitalisation and are measured by separations that had an adverse event (including infections, falls resulting in injuries and problems with medication and medical devices) that occurred during hospitalisation.- Nationally in 2023-24, 6.6% of separations in public hospitals had an adverse event reported during hospitalisation (up from 6.4% in 2022-23).
- Over the past 10 years, workers aged under 40 years have made up an increasing proportion of the nursing and medical practitioner workforces.
Nationally in 2024:- the proportion of nurses and midwives aged under 40 years was up by 11.5 percentage points since 2015. The proportion of the FTE nursing workforce aged 60 years or over was 8.0%.
- the attrition rate for nurses and midwives was 24.5% (down from 28.9% in 2023)
- the proportion of the medical practitioner workforce who are female peaked at 46.2%. The proportion of medical practitioners who were female aged under 30 years was 10.3%, slightly up from a 10-year low of 9.9% in 2023. However, this age group remains the only one to have declined in proportion over the past decade.
- the attrition rate for medical practitioners was 24.2% (up from 22.9% in 2023).
More information: section 12 Public hospitals
- The proportion of people delaying seeing a mental health professional due to affordability concerns has improved slightly, however, remains amongst the highest over the time series.
Nationally in 2024-25, 19.7% of all respondents delayed seeing any mental health professional in the last 12 months due to cost, down from 20.4% in 2023-24 and a departure from year-on-year increases since reporting began in 2020-21 (12.0%).- Respondents were almost two and a half times as likely to report delaying mental health care due to cost for psychologists, psychiatrists and other mental health professionals (23.8%) than for GPs (9.6%).
- Rates of readmissions to hospital within 28 days of discharge have improved over the past decade.
- Nationally in 2023-24, the proportion of overnight separations from psychiatric acute inpatient services that were followed by a readmission to a psychiatric acute inpatient service within 28 days of discharge was 13.2%, down from 15.0% in 2014-15.
- Since 2019-20, Aboriginal and Torres Strait Islander people and people aged under 18 years have experienced the greatest improvements, with reductions of 2.3 percentage points each.
- Attrition rates for health care workers employed in the mental health sector have reduced after a post-COVID peak.
Nationally in 2024:- attrition rates for mental health nurses reduced to 22.6% down from a peak of 32.3% in 2022. The proportion of mental health nurses aged under 40 years grew from 29.4% in 2015 to 42.1% in 2024.
- the proportion of medical practitioners aged under 40 years in the mental health sector was up to a 10-year high of 24.6%. Female medical practitioners aged under 30 years represented 5% of the female medical practitioner workforce, the highest proportion since 2018, following a decrease to 3.5% in 2020 and 2021.
More information: section 13 Services for mental health
References
ABS (Australian Bureau of Statistics) 2025, National Aboriginal and Torres Strait Islander Health Measures Survey, https://www.abs.gov.au/statistics/people/aboriginal-and-torres-strait-islander-peoples/national-aboriginal-and-torres-strait-islander-health-measures-survey/latest-release (accessed 10 October 2025)
AIHW (Australian Institute of Health and Welfare) 2025a, Emergency department presentations - Hospitals, Australian Institute of Health and Welfare, https://www.aihw.gov.au/hospitals/topics/emergency-departments/presentations (accessed 13 June 2025).
AIHW (Australian Institute of Health and Welfare) 2025b, National Perinatal Mortality data collection, https://www.aihw.gov.au/about-our-data/our-data-collections/national-perinatal-mortality-data-collection-npmdc (accessed 18 October 2025).
Crawford, K, Morphet, J, Jones, T, Innes, K, Griffiths, D and Williams, A 2014, ‘Initiatives to reduce overcrowding and access block in Australian emergency departments: A literature review’, Collegian, vol. 21, no. 4, pp. 359–366.
Dawson, LP, Andrew, E, Stephenson, M, Nehme, Z, Bloom, J, Cox, S, Anderson, D, Lefkovits, J, Taylor, AJ, Kaye, D, Smith, K and Stub, D 2022, ‘The influence of ambulance offload time on 30‐day risks of death and re‐presentation for patients with chest pain’, Medical Journal of Australia, vol. 217, no. 5,
DHDA (Australian Government Department of Health Disability and Ageing) 2023, About Medicare Urgent Care Clinics, Australian Government Department of Health and Aged Care, https://www.health.gov.au/find-a-medicare-ucc/about (accessed 28 May 2025).
IFEM (International Federation for Emergency Medicine) 2020, Report from the Emergency Department Crowding and Access Block Task Force, June.
Kruk, R 2023, Independent review of Australia’s regulatory settings relating to overseas health practitioners, Special Inquiry.
Mengyu, L, Vanberkel, P and Carter, AJE 2019, ‘A review on ambulance offload delay literature’, Health Care Manag Sci, Health care management science, vol. 22, no. 4, https://pubmed.ncbi.nlm.nih.gov/29982911/ (accessed 20 May 2025).
Montalto, M, McElduff, P and Hardy, K 2020, ‘Home ward bound: features of hospital in the home use by major Australian hospitals, 2011-2017’, The Medical Journal of Australia, vol. 213, no. 1, pp. 22–27.
Queensland Health (The State of Queensland) 2024, Understanding ambulance ramping and why it happens, Queensland Health, https://www.health.qld.gov.au/newsroom/features/understanding-ambulance-ramping-and-why-it-happens (accessed 20 May 2025).
Savira, F, Frith, M, Aditya, CJ, Randall, S, White, N, Giddy, A, Spark, L, Swann, J and Robinson, S 2025, ‘Urgent care centres for reducing the demand on emergency departments’, Medical Journal of Australia (MJA), vol. 222, no. 9, https://apo.org.au/node/330747 (accessed 28 May 2025).
We value your comments about this publication and encourage you to provide feedback.
