Driver
Higher education commencement, attrition, and completion rates
University component | Time series, cohort analyses - 4, 6 and 9 years
Data tables appear under figures
Measure 1
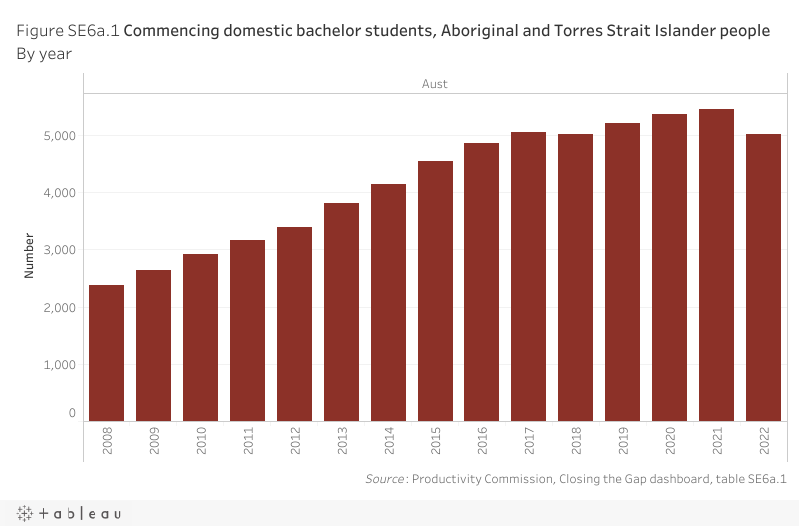
Number of people commencing university courses
Nationally in 2022, 5,016 Aboriginal and Torres Strait people commenced a domestic bachelor degree at an Australian university. This is lower than the previous three years (ranging from 5,200 in 2019 to 5,460 in 2021). Over the past 12 years, this number has more than doubled (from 2,376 in 2008) (figure SE6a.1).
Measure 2
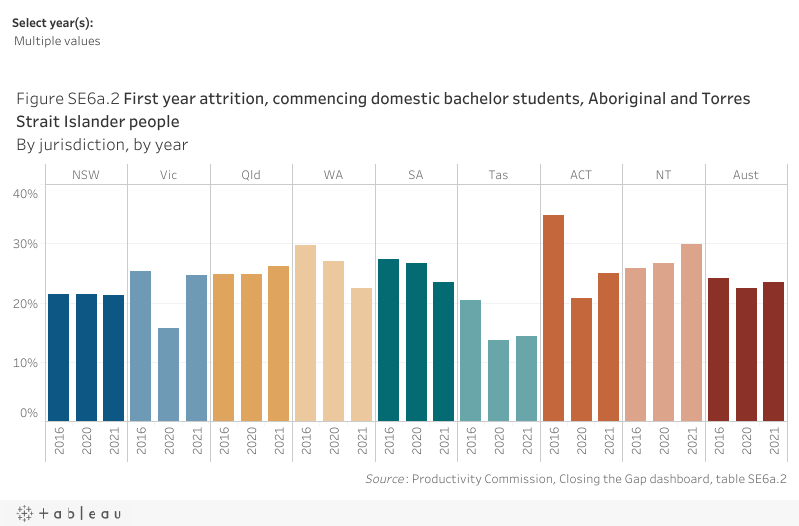
Rate of Attrition
Of the Aboriginal and Torres Strait Islander students who commenced a bachelor degree nationally in 2021, 23.4% did not return to study the following year (and had not completed their degree). This is an increase in the first year attrition rate since the previous period (22.5% in 2020), however the rate remains below the 2016 baseline of 24.2% (figure SE6a.2).
Measure 3
Proportion of people commencing university courses who complete, continue or leave over time
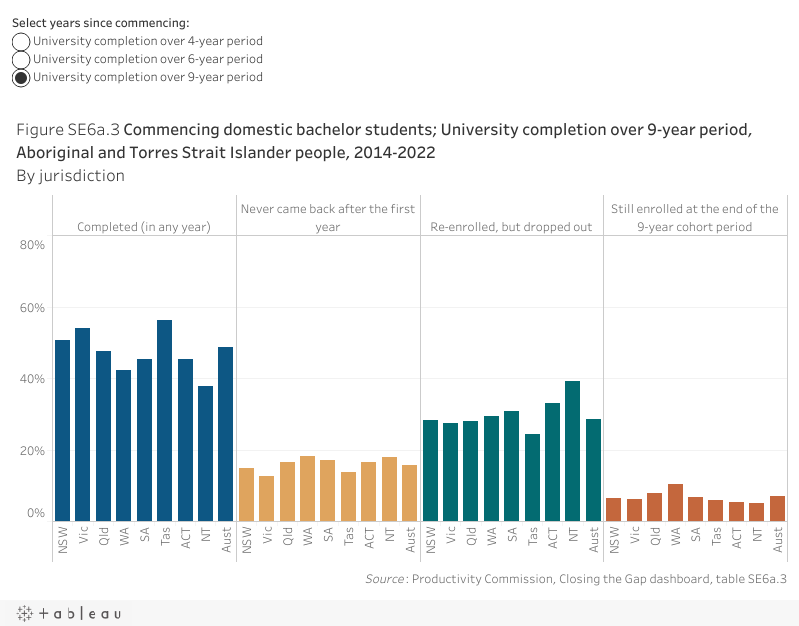
University completion is measured over four years, six years and nine years, as while some students may study continuously full-time and complete a degree within four years others may study part-time and/or with breaks, hence longer time periods are also reported.
Nationally in 2022, the completion rate increased as it was measured over longer time periods, with the most substantial increase between the four-year and six-year periods. For those who commenced in 2019, 26.0% had completed their degree in 2022; this increased to 39.6% and 48.6% for those who commenced in 2017 and 2014 respectively. The differences in continuation (still enrolled) and leaving (at first year or later years) rates mirror those for completion, in that the largest percentage point differences were between the four-year and six-year periods, with smaller differences between the six-year and nine-year periods (figure SE6a.3).
Indicator data specifications
Related outcome: | Aboriginal and Torres Strait Islander students reach their full potential through further education pathways. |
|---|---|
Related target: | By 2031, increase the proportion of Aboriginal and Torres Strait Islander people aged 25‑34 years who have completed a tertiary qualification (Certificate level III and above) to 70%. |
Indicator: | Higher education commencement (university component), attrition, and completion rates (time series, cohort analyses - four, six and nine years) |
Measure: | Three measures defined as follows: Measure 1: Number of Aboriginal and Torres Strait Islander people commencing university courses defined as: Numerator – total number of Aboriginal and Torres Strait Islander people commencing a domestic bachelor degree at an Australian university and is presented as a number. Measure 2: The attrition rate, defined as: Numerator – number of Aboriginal and Torres Strait Islander students who commenced a course in year(x) who neither complete in year(x) or year(x+1) nor return in year(x+1) Denominator – total number of Aboriginal and Torres Strait Islander people commencing a domestic bachelor degree at an Australian university in year(x) and is presented as a rate. Measure 3: Proportion of people commencing university courses who complete, continue or leave over time, defined as: Numerator – number of Aboriginal and Torres Strait Islander people who:
after four years, six years and nine years since commencing a domestic bachelor degree at an Australian university Denominator – total number of Aboriginal and Torres Strait Islander people commencing a domestic bachelor degree at an Australian university four years, six years and nine years ago and is presented as a percentage. |
Indicator established: | National Agreement on Closing the Gap July 2020 |
Latest dashboard update for the indicator: | 6 March 2024 |
Indicator type: | Driver |
Interpretation of change: | Measure 1 A high or increasing number is desirable. Measure 2 A low or decreasing rate is desirable. Measure 3 A high or increasing proportion of people completing or continuing is desirable. A low or decreasing proportion of people dropping out or not returning is desirable. |
Data source: | Name: Higher Education Statistics Collection Frequency: Annual (Revised data across multiple years and measures is included in the March 2023 Dashboard update) Documentation (links): https://www.dese.gov.au/higher-education-statistics |
Data provider: | Provider name: Department of Education, Skills and Employment Provider area: Analysis and Data Division |
Baseline year: | Measure 1: 2016 (data reported back to 2008, to support Measure 3) Measure 2: 2016 Measure 3: 2013–2016 (four-year cohort), 2011–2016 (six-year cohort), 2008–2016 (nine-year cohort) |
Latest reporting period: | Measure 1: 2022 Measure 2: 2021 Measure 3: 2019–2022, 2017–2022, 2014–2022 |
Disaggregations: | State and territory and Australia, by Indigenous status. |
Computation: | Measure 1: Numerator. Measure 2: Numerator divided by Denominator multiplied by 100. Measure 3: Numerator divided by Denominator multiplied by 100, by completion status. Counting rules Data are for all domestic bachelor students attending a higher education provider (university component) (Tables A and B providers only in the Higher Education Statistics Collection). A domestic student is a student who is an Australian citizen, a New Zealand citizen or the holder of a permanent visa. A commencing student is a student who has enrolled in the course for the first time at the higher education institution between 1 January and 31 December of the collection year. Geographical variables are based on the location of the student (postcode or permanent home residence). Includes (Measure 3)
Excludes (both numerator and denominator)
|
Data quality considerations: | Student cohort analysis is based on the institution where the student commenced their course. Therefore, if a student commenced at a university and change to a non‑university they will be counted in the university scope. The attrition rate calculation and cohort analysis is based on a matching process using both the StudentID and the Commonwealth Higher Education Student Support Number (CHESSN). If a student moves from one institution to another in the following year, he or she would be counted as retained. It is only those students who left the higher education system entirely (that is, they were no longer at any institution) that are counted as attrited. The attrition rate counts students who commenced in year 1 and neither re-enrolled in year, nor completed in years one or two. The attrition rates are typically higher than the cohort analysis (‘Never came back after first year’) which counts students who commenced in year one then never had a re‑enrolment or completion over the cohort period (for example, in years two, three or four for the four‑cohort analysis). The count of commencing students used as the denominator for Measure 2 is different to the count of commencing students reported in Measures 1 and 3. |
Future reporting: | Additional disaggregations required for future reporting:
|