This guide is to assist with navigating the Closing the Gap Information Repository to access the data currently available.
The dashboard includes the four Priority Reform areas and 17 socio-economic outcome areas as currently specified in the National Agreement on Closing the Gap (the Agreement). Each area has at least one agreed target indicator and a number of supporting indicators (in the Agreement these supporting indicators are variously referred to as Indicators, Outcome indicators, Drivers and Contextual information). Data is being added to each of these areas over time.
Users of the data are also encouraged to view the material on How to interpret the data.
Target indicators
The dashboard reports data for each of the targets across the 17 socio-economic outcome areas with the exception of target 9B under socio-economic outcome area 9 (the data is not yet available to enable reporting against this target). The following data and related material is available for the targets:
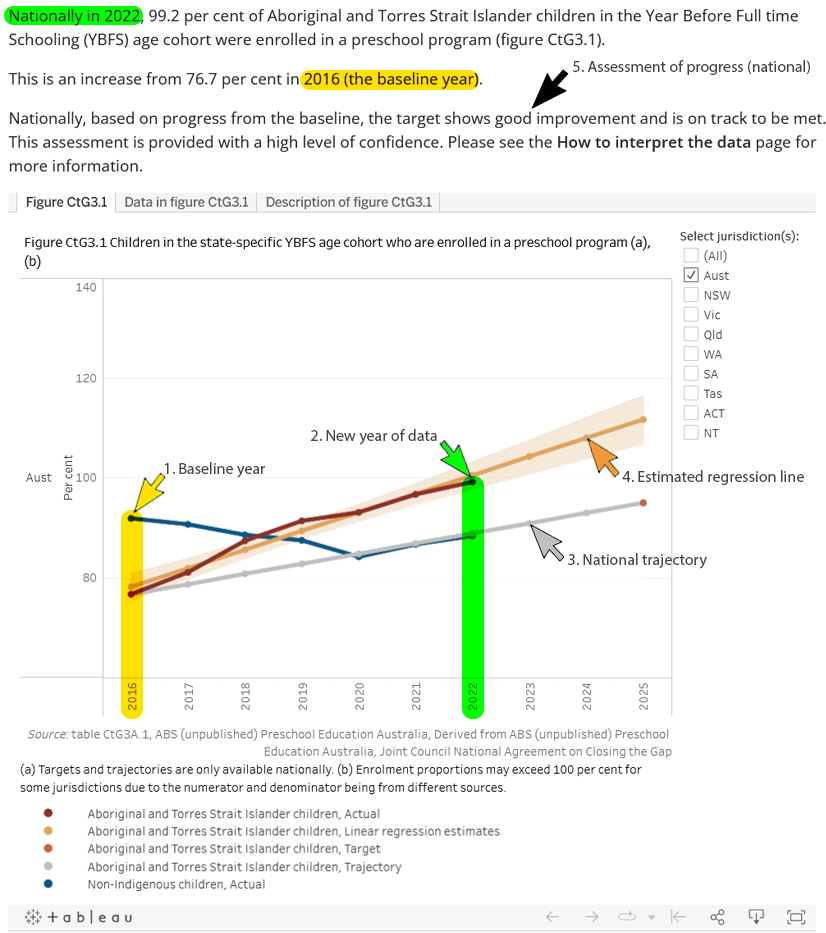
- Baseline year data – the data year from which progress will be measured at the national level.
- New year data for a subset of the targets – not all targets have new data available.
- National trajectories – these straight-line trajectories show a potential pathway from the baseline to the desired ‘end point’, they show us the direction and constant speed of change needed from today to meet the target in future.1
- Estimated regression lines – these estimates show the trend line that best fits the data from the baseline to the current period and show the potential pathway in future should this trend continue.
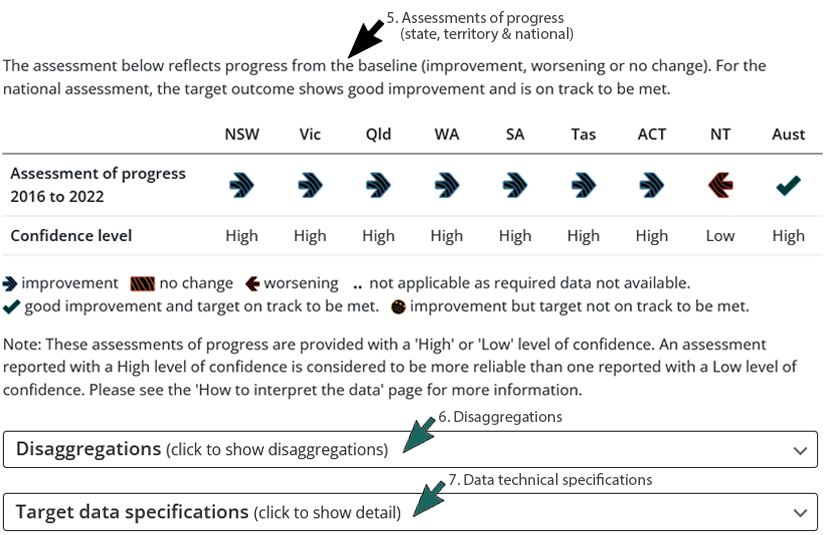
- Assessments of progress – for those targets with new data available since the baseline year.
- Disaggregations – for those targets with new data available since the baseline year.
- Target data specifications – technical data specifications, such as measures, computation rules and data source.
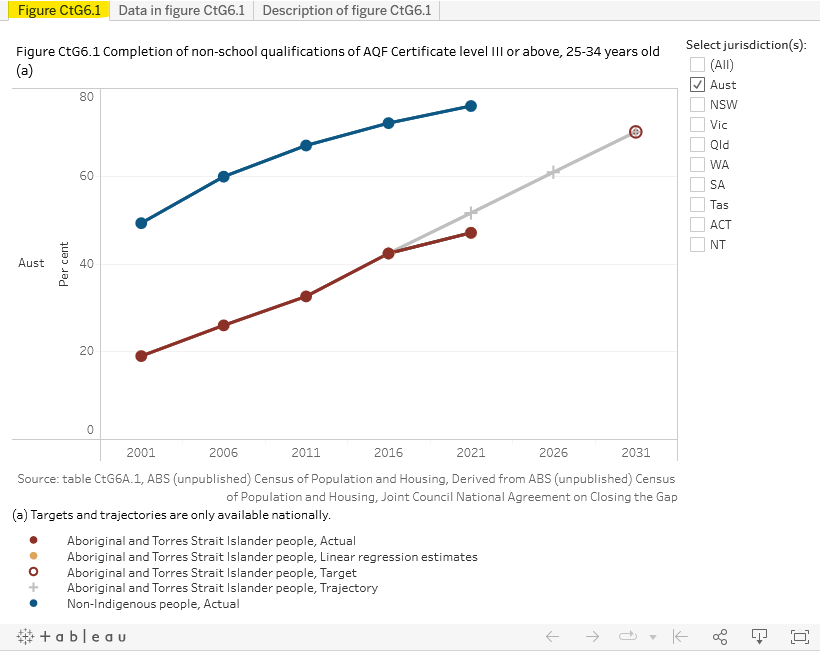
The image below (using CtG target 3) illustrates where the items above can be found on the dashboard.
The data is not yet available on the dashboard for the targets under the four Priority Reforms.
Supporting indicators (drivers and contextual information)
Across the Priority Reforms and socio-economic outcome areas, material is available for 28 supporting indicators. The following data (where available) and related material are now available on the dashboard for these supporting indicators:
- Baseline year data – the data year from which progress will be measured, in line with the baseline year for the associated target indicator (available for 21 of the supporting indicators, all in the socio-economic outcome areas).
- New year/s of data for a subset of the indicators – not all indicators have new data available.
- Indicator data specifications.
- A trajectory for the target on digital inclusion is yet to be developed. This target is based on achieving parity and data is not currently available for non-Indigenous people. Locate Footnote 1 above
The data is available in different formats on the dashboard:
-
Visually (Tableau)
- Tableau is used to present the data in a visual format (in this case, as charts or tables).
- For the target indicator, the visualisations show the baseline data, current year data (where there is more recent data available), and national trajectories and national targets (where available).
- For the target indicator, an assessment of progress from the baseline (improvement, worsening or no change) is provided, and where there is improvement at the national level an assessment of whether the target indicator is on track or not on track to be met.
- For the disaggregations, the visualisations show the target indicator disaggregated by selected variables (such as sex and remoteness area) from the baseline year (where available).
- For the supporting indicators, the visualisations present the indicator data (where available).
- The presentations allow you to change your view at the national, state and territory level by checking the tick boxes for selecting individual states and territories.
-
For the embedded Tableau dashboards there is a suite of supplementary buttons that allow you to interact with the dashboard in different ways:
 Select a datapoint on the tableau dashboard, in the tooltip you can choose to exclude the given datapoint or display only that datapoint.
 After interacting with the dashboard select this icon to revert the dashboard to its default settings.
 After interacting with the dashboard select the leftward or rightward arrow to undo or redo the previous interaction.
 Select this icon to share the link for the Tableau Public via social media channels.
 Select this icon to download the contents of the dashboard – for further information on the visualisations and underlying data that can be downloaded please see Step 4 below.
 Select this icon to enter full-screen mode.
 Select this icon to view the dashboard in Tableau Public
-
In data tables (Excel)
- Excel is used to provide data in a neatly formatted way that makes it easy to understand.
- These tables are located at the bottom of each socio-economic outcome area page on the dashboard and can be downloaded (see Step 4c below).
-
In a machine readable flat file (CSV)
- Comma-separated values (CSV) files provide the same data and information as the Excel files but in a different format that allows users to more easily import and export data between these files and other applications.
- CSV files are located at the bottom of each socio-economic outcome area page on the dashboard and can be downloaded (see Step 4c below).
There are five steps for accessing data.
- Steps 1 and 2 guide you to where the data is located, through the dashboard to the individual outcome area of interest.
-
Once in the outcome area of interest:
- Step 3 guides you to information about how the data is measured.
- Step 4 explains how to access the data presentations for the outcome area, for the target indicator visual presentations (4a), supporting indicator visual presentations and target indicator disaggregation visual presentations (4b) and the data files (Excel and CSV) (4c).
- Step 5 explains how to print and/or download a copy of what you see on the screen.
Step 1. Getting to the dashboard
Visit the Closing the Gap Information Repository webpage
Click on the dashboard tab

Step 2. Locating area of interest
Select a Priority Reform area or a socio-economic outcome area
Click on one of the Priority Reform area cards (left) or socio-economic outcome area cards (right)

You will be taken to the target indicator page for the Priority Reform or socio-economic outcome area.
There are two options to access information for supporting indicators (note: only supporting indicators which have indicator data specifications – that is, information describing how the indicator is defined and measured – are currently available on the dashboard).
-
Option 1 is to click on the supporting indicator under the target indicator in the left hand navigation
- Option 2 is to click on the supporting indicators tab on the target indicator page. Then click on the supporting indicator of interest
Click on the supporting indicators tab

Click on the supporting indicator of interest
Step 3a. Target definitions and measurement
To access information about how the target is defined and measured, click on the target data specifications tab underneath the target indicator data visualisation. This information is important in understanding how to interpret the target and associated disaggregations.
Click on the target data specifications tab

Step 3b. Supporting indicator definitions and measurement
To access information about how the supporting indicator is defined and measured, click on the indicator data specifications tab on the supporting indicator page. This information is important in understanding how to interpret the indicator.
Click on the indicator data specifications tab

Step 4a. Viewing the target indicator data
To view the data as a visual presentation or in table format, click on the first or second tabs respectively in the target indicator data visualisation. Click on the third tab to read a description of the data.
Choose how data is to be presented by jurisdiction (where available)
Select one or more jurisdictions, or all jurisdictions by clicking in the relevant box (multiple choices are possible)

To download the visualisation or data that sit behind the visualisation, click on the 'Download' icon at the bottom of the visualisation.
[Note re Browser: if wanting to download the data behind the visualisation you first need to click in the figure if using Chrome or a data point within the figure if using Edge.]
Click on the Download icon at the bottom of the visualisation

Select your preferred file format

If selecting PDF in pop up box, select ‘Unspecified’ as page size, then select Download.
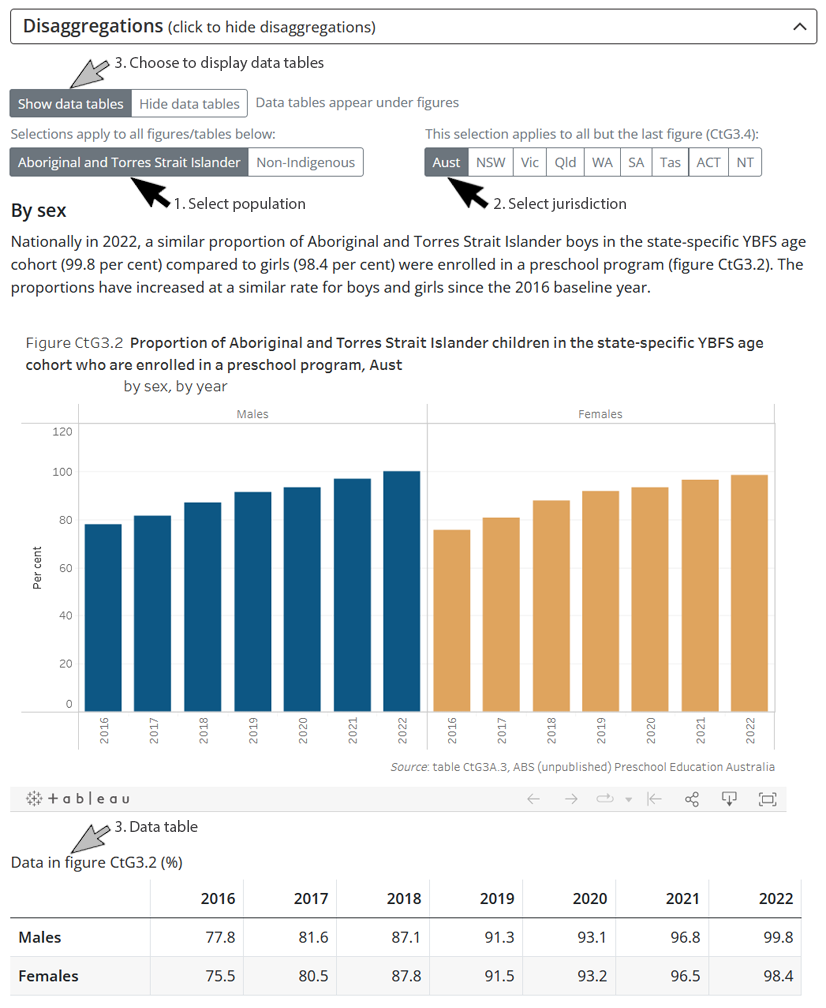
Step 4b. Viewing the supporting indicators and/or viewing the disaggregations for the target indicator data
To view:
- supporting indicator data – click on the supporting indicators tab on the target indicator page, then click on the supporting indictor of interest.
- target indicator disaggregation data – click on the Disaggregations tab on the target indicator page.
Follow the following options to view the data of interest (noting not all supporting indicators reported have data available):
- Click on the ‘Aboriginal and Torres Strait Islander’ or ‘Non-Indigenous’ buttons to select which population to display.
- Click on the national or selected state or territories buttons to select which jurisdiction to display.
- Click on the ‘Show’ or ‘Hide’ data tables buttons to select whether or not to display data tables directly under the figures.
The image below (using CtG target 3) illustrates the three selections for displaying different data within the dashboard.
To download the visualisation or data that sit behind the visualisation, click on the 'Download' icon at the bottom of the visualisation.
[Note re Browser: if wanting to download the data behind the visualisation you first need to click in the figure if using Chrome or a data point within the figure if using Edge.]
Click on the Download icon at the bottom of the visualisation
Select your preferred file format
If selecting PDF in pop up box, select ‘Unspecified’ as page size, then select Download.
Step 4c. Downloading data tables
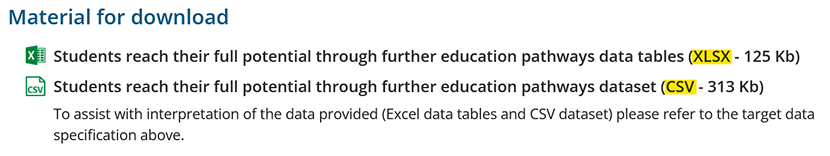
For each socio-economic outcome area, a data set is available to download that contains all data for the target indicator, target indicator disaggregations and supporting indicators (the data is not currently available for the Priority Reforms). To download data in Excel or CSV formats:
Scroll to the bottom of the Target page to Material for download. To open and download the data, click on the Excel (XLSX) file or the CSV file
Step 5. Printing and downloading what you see on the screen
There is a Print/Download button on the top right hand corner of each webpage.
Clicking on this button will print the entirety of the screen that is open and expands and prints the Target data specifications and all other text references on the page.
Please note that for the screen view (print or download) the view in the visualisation is limited to data for Australia (ie national totals) only.
Click the Print/Download button at the top of the page to print the text on the page or select Save as PDF in the print window to download a copy

The dashboard is updated on a regular basis (at a minimum, annually). In addition, to reporting data for the first time, data already reported on the dashboard may be updated with more recent and/or revised data. The date the data were last updated on the dashboard is recorded:
-
In target data specifications and indicator data specifications
- The ‘Latest dashboard update’ records the most recent date when at least one of target/indicator tables (including disaggregations) was updated on the dashboard.
-
In data tables (Excel)
- The contents page records when each table was last updated on the dashboard.