What is productivity?
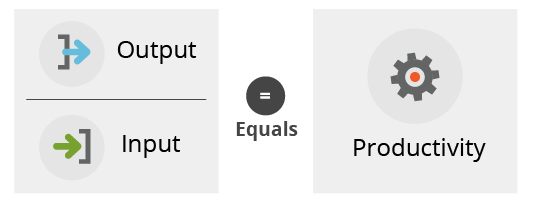
Productivity measures how good we are at producing output.
Put simply, productivity measures how efficiently inputs (say, labour, capital or raw materials) are used to produce outputs (goods or services).
It is calculated as the ratio of the value of output produced to the quantity of inputs used.
Factors that affect productivity growth include:
- technological improvements
- economies of scale and scope
- workforce skills
- management practices
- competitive pressures
- the stage of the business cycle.
Why does it matter?
Productivity is essential to improving Australians’ living standards.
For example, it takes the average Australian worker just one hour to produce the same amount as a worker produced in a whole day in 1901. This improved productivity has allowed incomes to rise even while working hours have fallen.
The more goods and services a society can produce with a given set of inputs, the greater the material standard of living of that society.
The most noticeable effects are:
- More leisure: As labour productivity improves, workers can achieve the same standard of living by working fewer hours.
- Consuming more market goods and services: Workers could choose to consume more goods and services.
- Greater number of public goods and services: The additional tax income available can be used to fund more hospitals, schools and emergency services.
- Lower labour cost of goods and services: The number of hours a worker needs to work to buy any particular product should fall for most goods over time as productivity increases.
How have the price of goods and services changed over time?
Productivity has led to enormous improvements in the lifestyle of Australians since Federation.
The number of hours a person needs to work in order to buy particular goods has fallen dramatically (see table below).
For example, consider rental housing costs, which have risen in real dollar terms, but have fallen in labour cost terms — the average person needed to work about 22 hours a week to rent a three-bedroom house in 1901, while in 2019 the average person would need only to have worked for about 12 hours.
Or consider the bicycle. In 1901 it would have required several months of work to afford a new bike but today it requires less than a day of work for a basic model.
These falling costs understate the increased quality of most goods available now compared to what was available at Federation — even the lowest-quality bicycles produced now are much safer and easier to use than their 1901 versions.
More significant for many people are the goods that are cheaply available now that had not been invented at Federation. Antibiotics, for example, have lowered the mortality from infectious disease from about 30 per 10,000 people in 1907 to 1 per 10,000 people in 2017, all at a fraction of the price.
| 1901 | 2000 | 2019 | |
|---|---|---|---|
| Rent (3 bedroom house) | 22.1 | 13.9 | 11.8 |
| Bicycle | 527.4 | 17.8 | 7.5 |
| Attending a game of football | 1.7 | 1.2 | 1.2 |
| 1901 | 2000 | 2019 | |
|---|---|---|---|
| Rump steak (1 kg) | 142.9 | 41.8 | 38.0 |
| Antibiotics | - | 18.0 | 8.6 |
| Bread (a loaf) | 20.4 | 7.7 | 5.5 |
| Milk (1 litre) | 30.6 | 4.7 | 2.2 |
a Calculated as the ratio of the average price of a good as a proportion of the average hourly earnings multiplied by the average working week length.
Source: AIHW (2019); Commission estimates using ABS (2019, Consumer Price Index, Australia, Sep 2019, Cat. no. 6401.0; 2001, Year Book Australia, 2001, Cat. no. 1301.0) for prices of goods in 1901 and 2019, and for earnings in 2019, and Ville and Withers (2015, pp. 561–569) for earnings and a combination of Bergeaug et al. (2016), Ville and Withers (2015, pp. 561–569) and the Conference Board (2018) for hours worked in 1901, and for wage growth since 2000, ABS (2019, Australian System of National Accounts, 2018‑19, Cat. no. 5204.0, table 1; 2019, Estimates of Industry Multifactor Productivity, 2018‑19, Cat. no. 5260.0.55.002, tables 1–19).
What are the main measures of productivity?
Economists use two main measures of productivity:
- Labour productivity is the ratio of output to hours worked.
- Multifactor productivity (MFP) is the ratio of output to the combination of all inputs, including labour and capital.
Usually, the growth in labour productivity exceeds the growth in multifactor productivity. The additional contribution comes from capital deepening: the accumulation of more and better capital equipment over time, which helps to make people more productive.
How do we measure outputs and inputs?
The output of some businesses can be measured in physical units, such as the number of shoes or tons of steel.
When thinking about entire industries or the whole economy, the range of outputs need to be added together. The Australian Bureau of Statistics (ABS) calculates productivity using a measure of output called gross value added (GVA), which is the value of the output produced by a firm, minus the intermediate inputs used (materials, services and energy used in production).
When it comes to inputs, two are typically measured:
- Labour, typically measured as hours worked by employed people.
- Capital services, measured as the flow of services coming from the capital stock – it is a measure of how much output is derived from the capital stock. The capital stock includes the buildings, machinery and equipment, livestock and plantations used to produce goods and services. It also includes intangible assets such as software, research and development and mineral exploration.
In what parts of the economy is productivity measured?
The most accurate estimates of productivity are for industries where prices are set in markets — known as the market sector. Market prices provide a measure of the quality of different products and makes it easier to measure output in terms of gross value added.
The non-market sector comprises the health, education and public administration industries. Productivity in these industries is hard to measure as their outputs are largely provided by government and there are often no information on prices.
Labour productivity can also be measured for the whole economy (in terms of real GDP per hour worked). Labour productivity measured in this way contributes to growth in living standards (commonly measured as GDP per person) but is a poorer indicator of technological change and efficiency improvement because of the difficulty in measuring output in health, education and public administration.
How does productivity measurement work in practice?
Suppose Ben works in a chocolate factory. Ben’s boss, Colin, wants to measure the labour productivity of his workforce to make operational improvements at the factory. Colin estimates that during a 40-hour work week, Ben produces 2000 chocolate bars. So Colin calculates Ben’s labour productivity as:
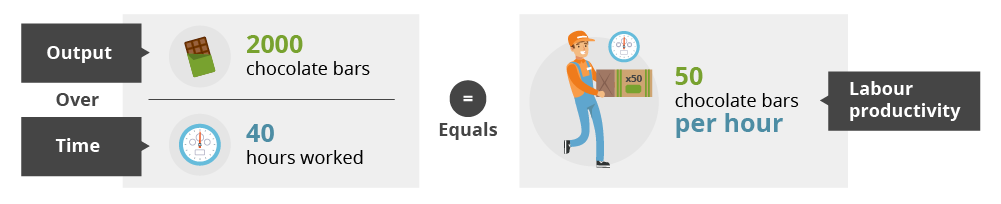
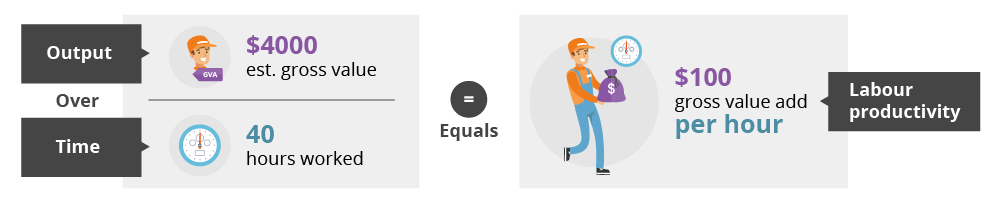
While this allows Ben’s performance to be compared to other employees in the chocolate bar branch, Colin cannot compare Ben to employees in the chocolate biscuit division. To allow for comparison, Colin estimates the gross value added of Ben producing 2000 chocolate bars is $4000, or $2 profit per bar. Colin then calculates Ben’s labour productivity as:
How can productivity be compared across countries?
While productivity growth can be compared readily across countries, productivity level comparisons require estimates of relative prices across countries. For example, if the cost of a hamburger in Japan is higher than the cost of a hamburger in Australia then the value of output in Japan will appear higher. These price differences may reflect differences in, say, fast food worker wages and store rents, rather than differences in quality of food and service.
To ensure labour productivity levels are comparable between countries, output is converted to US dollars per hour worked, based on exchange rates at purchasing power parity.
After making these adjustments, Australia’s labour productivity is high by international standards but is middling among other wealthy nations.
Australia's productivity performance ranks 16th of 24 countries in the OECD
Labour productivity in 2022 (denominated in USD at 2022 PPP )a
![]()
a Currencies converted to US dollars using current PPPs. b Only the 24 longest standing OECD countries were considered.
Source: OECD Stat database.
