Contextual information
Proportion of people reported experiencing one or more barriers accessing health services
Dashboard snapshot: The data below are the most recent at the time of preparing the July 2023 report. Please go to the dashboard to access the current data.
Measure 1
Proportion of people reporting they did not visit a health service provider when needed by type of service
Nationally in 2018-19, one in eight Aboriginal and Torres Strait Islander people reported not seeing a GP or clinic doctor on at least one occasion when needed in the previous 12 months (12.5 per cent). This increased to almost one in five for not seeing a dentist when needed (18.9 per cent), but was less than one in 10 for those not seeing a counsellor (9.6 per cent), other health professionals (9.0 per cent) or going to hospital (6.2 per cent) when needed (figure SE14e.1).
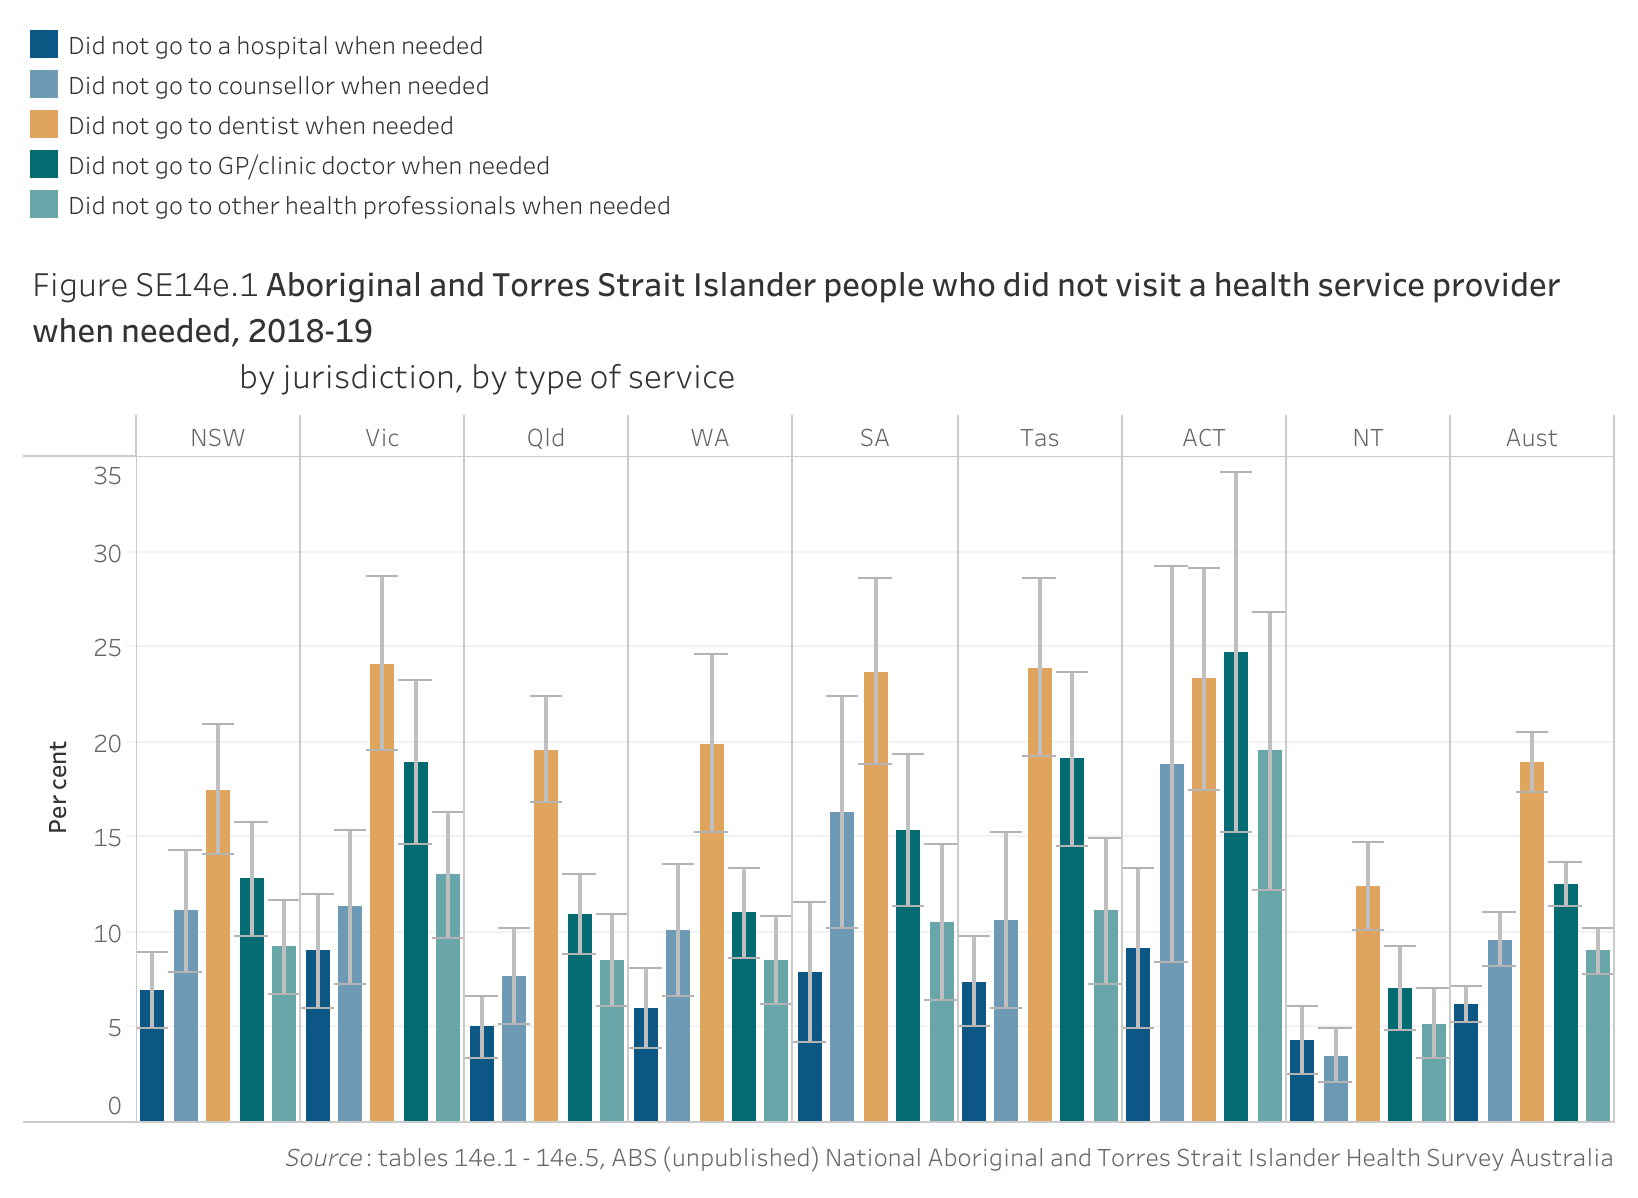
| Description4 | NSW | Vic | Qld | WA | SA | Tas | ACT | NT | Aust |
|---|---|---|---|---|---|---|---|---|---|
| Did not go to a hospital when needed | 6.9 | 9.0 | 5.0 | 6.0 | 7.9 | 7.4 | 9.1 | 4.3 | 6.2 |
| Did not go to counsellor when needed | 11.1 | 11.3 | 7.7 | 10.1 | 16.3 | 10.6 | 18.8 | 3.5 | 9.6 |
| Did not go to dentist when needed | 17.5 | 24.1 | 19.6 | 19.9 | 23.7 | 23.9 | 23.3 | 12.4 | 18.9 |
| Did not go to GP/clinic doctor when needed | 12.8 | 18.9 | 10.9 | 11.0 | 15.3 | 19.1 | 24.7 | 7.0 | 12.5 |
| Did not go to other health professionals when needed | 9.2 | 13.0 | 8.5 | 8.5 | 10.5 | 11.1 | 19.5 | 5.2 | 9.0 |
Measure 2
Proportion of people reporting a specific type of barrier/s to accessing a health service provider by type of service
The reasons for not visiting health care professionals when needed in 2018-19 differed by service type (figure SE14e.2). The most commonly reported factors for not visiting GPs/clinic doctors were being too busy (4.1 per cent) and other reasons (5.8 per cent) — including people who ultimately decided not to seek care (there is no information available on why they decided not to). Cost was a top reason for not going to the dentist (7.9 per cent).
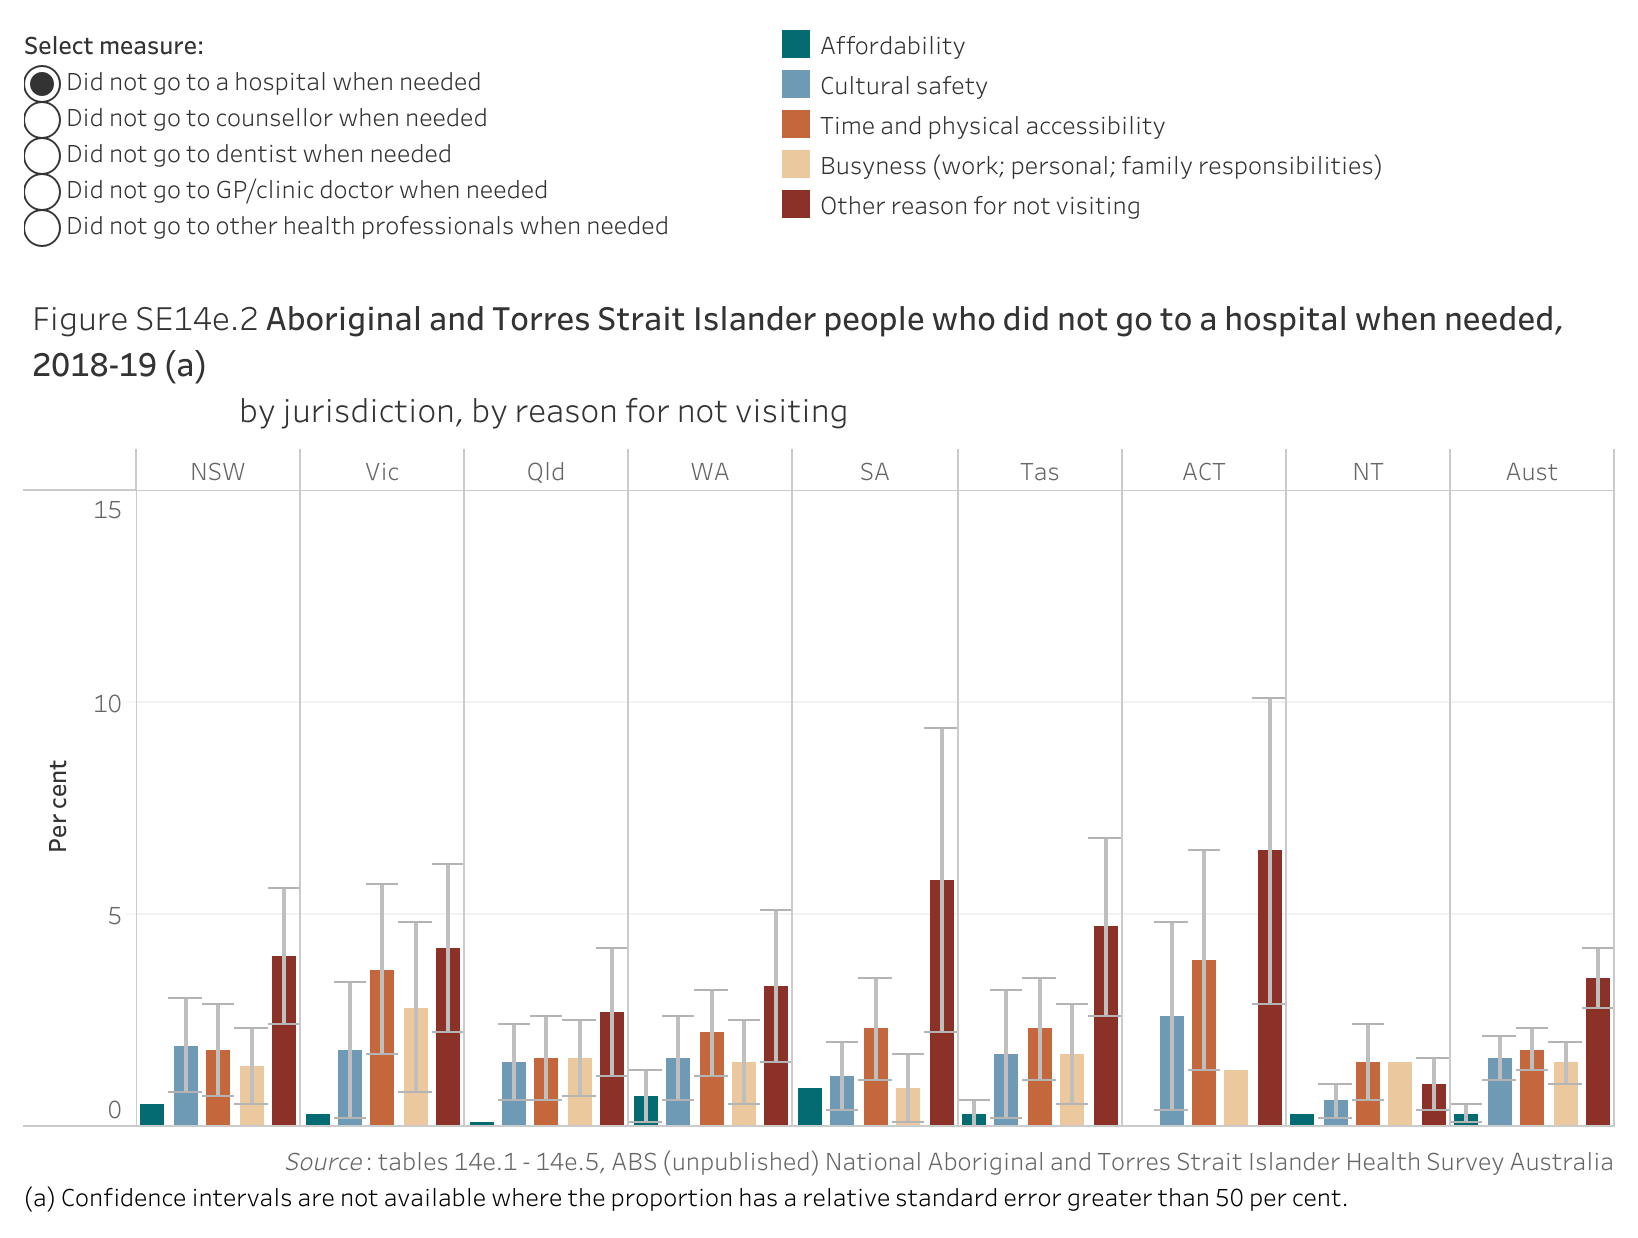
| Description5 | NSW | Vic | Qld | WA | SA | Tas | ACT | NT | Aust |
|---|---|---|---|---|---|---|---|---|---|
| Affordability | 0.5 | 0.3 | 0.1 | 0.7 | 0.9 | 0.3 | – | 0.3 | 0.3 |
| Cultural safety | 1.9 | 1.8 | 1.5 | 1.6 | 1.2 | 1.7 | 2.6 | 0.6 | 1.6 |
| Time and physical accessibility | 1.8 | 3.7 | 1.6 | 2.2 | 2.3 | 2.3 | 3.9 | 1.5 | 1.8 |
| Busyness (work; personal; family responsibilities) | 1.4 | 2.8 | 1.6 | 1.5 | 0.9 | 1.7 | 1.3 | 1.5 | 1.5 |
| Other reason for not visiting | 4.0 | 4.2 | 2.7 | 3.3 | 5.8 | 4.7 | 6.5 | 1.0 | 3.5 |
– Nil or rounded to zero.
Indicator data specifications
Related outcome: | Aboriginal and Torres Strait Islander people enjoy high levels of social and emotional wellbeing. |
|---|---|
Related target: | Significant and sustained reduction in suicide of Aboriginal and Torres Strait Islander people towards zero. |
Indicator: | Proportion of people who reported experiencing one or more barriers accessing health services. |
Measure: | There are two measures for this indicator. Measure 1 is the proportion of people reporting they did not visit a health service provider when needed in the previous 12 months by type of service (GP/clinic doctor, counsellor, dentist, other health professional, hospital), defined as: Numerator — number Aboriginal and Torres Strait Islander people reporting they did not visit a health service provider when needed in the past 12 months, by type of service Denominator — total number of Aboriginal and Torres Strait Islander people in the population and is presented as a percentage. Measure 2 is the proportion of people reporting a specific type of barrier(s) to accessing a health service provider by type of service (GP/clinic doctor, counsellor, dentist, other health professional, hospital), defined as: Numerator — number of Aboriginal and Torres Strait Islander people reporting they did not visit a health service provider in the previous 12 months due to a specific barrier (e.g. affordability, cultural safety), by type of service Denominator — total number of Aboriginal and Torres Strait Islander people in the population and is presented as a percentage. |
Indicator established: | National Agreement on Closing the Gap July 2020 |
Latest dashboard update for the indicator: | 30 June 2022 |
Indicator type: | Contextual information |
Interpretation of change: | For both measures, a low or decreasing proportion is desirable. |
Data source: | Name: National Aboriginal and Torres Strait Islander Health Survey (NATSIHS) Frequency: Six-yearly Documentation (links): National Aboriginal and Torres Strait Islander Health Survey, 2018-19 financial year | Australian Bureau of Statistics (abs.gov.au) |
Data provider: | Provider name: Australian Bureau of Statistics Provider area: Centre for Aboriginal and Torres Strait Islander Statistics |
Baseline year: | Both measures 2018-19 |
Latest reporting period | Both measures 2018-19 |
Disaggregations: | State and territory, and Australia |
Computation: | Numerator divided by Denominator multiplied by 100 Counting rules Data relate to Aboriginal and Torres Strait Islander people living in private dwellings in remote and non-remote areas of Australia, including discrete Indigenous communities. Geographical variables are based on a person's place of usual residence. The scope of people differs across service types by age, with data collected for the NATSIHS for those aged:
ABS TableBuilder has been used to source data for this indicator (all measures). Numbers in TableBuilder are rounded to the nearest 100. Proportions are calculated from rounded values. Measure 1 A person is counted for each service type that they report not visiting when needed in the previous 12 months. For example, if a person reports not visiting a GP and a counsellor, they will be counted in both service types. Measure 2 The barriers for not visiting a health care professional were grouped by the Productivity Commission into five categories:
The sum of proportions across barriers may exceed the total proportion of people who did not visit a health service provider when needed in the past 12 months as people may have reported more than one barrier to going to a health service provider. Supporting calculations
|
Data quality considerations: | Data for these measures align with similar measures in the Overcoming Indigenous Disadvantage report and the Aboriginal and Torres Strait Islander Health Performance Framework report. Estimates that have a relative standard error between 25 per cent and 50 per cent should be used with caution. Estimates with a relative standard error of 50 per cent or more are considered too unreliable for general use. The final sample has been weighted to population benchmarks which align with the scope of the survey to account for under coverage. See NATSIHS explanatory notes for further information: National Aboriginal and Torres Strait Islander Health Survey methodology, 2018-19 financial year | Australian Bureau of Statistics (abs.gov.au) Data values have been randomly adjusted to avoid the release of confidential data. Discrepancies may occur between sums of the component items and totals. |
Future reporting: | Additional disaggregations required for future reporting:
|