Closing the Gap Annual Data Compilation Report July 2023
Attachment C
Summary of progress across socio‑economic outcome areas Dashboard snapshots and data for download
The data below are the most recent at the time of preparing the July 2023 report. Please go to the dashboard to access the current data.
Socio-economic outcome areas
Summary snapshots for the 17 socio-economic outcome areas are included below. Information relating to data and measurement issues can be found in section 3 and attachment A.
|
Legend
|
Good improvement and on track
|
Improvement but not on track (National)
|
Improvement
|
No change (state level)
|
Worsening
|
No assessment or Not applicable
|
na
|
–
|
|
Good improvement and on track
|
Improvement but not on track (national)
|
Improvement
|
No change (state and territory level)
|
Worsening
|
No assessment
or
Not applicable
|
Not available
|
Nil or rounded to zero
|
To view each socio-economic outcome area, you can scroll down the page or use the navigation pane on the left hand side to move between areas.
Socio-economic outcome area 1
Aboriginal and Torres Strait Islander people enjoy long and healthy lives
Nationally (based on the four jurisdictions with available data), Aboriginal and Torres Strait Islander males born in 2015–2017 are expected to live to 71.6 years, with females around 4 years longer. The gap in life expectancy compared to non-Indigenous people has narrowed for males and females since 2005–2007 (the baseline).
While this is an improvement, the national target is not on track to be met for males or females (noting this assessment should be used with caution as it is based on a limited number of data points). The average annual changes to date are 0.28 years per year for males and 0.18 for females, just over or around half of what is required (0.46 and 0.38 respectively) to meet the target.
|
Target 1
|
Unit
|
NSW
|
Vic
|
Qld
|
WA
|
SA
|
Tas
|
ACT
|
NT
|
Aust
|
National Target
|
|
Progress
|
Level
|
Improvement
|
No assessment
|
Improvement
|
Improvement
|
No assessment
|
No assessment
|
No assessment
|
Improvement
|
Improvement but not on track (National)
|
|
|
Baseline
|
Yrs
|
10.5
|
na
|
11.8
|
14.7
|
na
|
na
|
na
|
14.0
|
11.4
|
0
|
|
Current year
|
Yrs
|
9.3
|
na
|
7.8
|
13.4
|
na
|
na
|
na
|
11.5
|
8.6
|
0
|
|
Annual change
|
Yrs/yr
|
-0.12
|
No assessment
|
-0.40
|
-0.13
|
No assessment
|
No assessment
|
No assessment
|
-0.25
|
-0.28
|
-0.46
|
|
Progress
|
Level
|
Improvement
|
No assessment
|
Improvement
|
Improvement
|
No assessment
|
No assessment
|
No assessment
|
Worsening
|
Improvement but not on track (National)
|
|
|
Baseline
|
Yrs
|
8.6
|
na
|
10.0
|
12.9
|
na
|
na
|
na
|
11.6
|
9.6
|
0
|
|
Current year
|
Yrs
|
7.6
|
na
|
6.8
|
12.0
|
na
|
na
|
na
|
12.8
|
7.8
|
0
|
|
Annual change
|
Yrs/yr
|
-0.10
|
No assessment
|
-0.32
|
-0.09
|
No assessment
|
No assessment
|
No assessment
|
0.12
|
-0.18
|
-0.38
|
Nationally, Aboriginal and Torres Strait Islander males and females born in major cities and regional areas had higher life expectancy, than those born in more remote areas, and higher life expectancy in the least disadvantaged socio-economic areas compared to the most disadvantaged areas.
Figure C.1 – Estimated life expectancy at birth of Aboriginal and Torres Strait Islander people, 2015–2017
by sex, by remoteness area
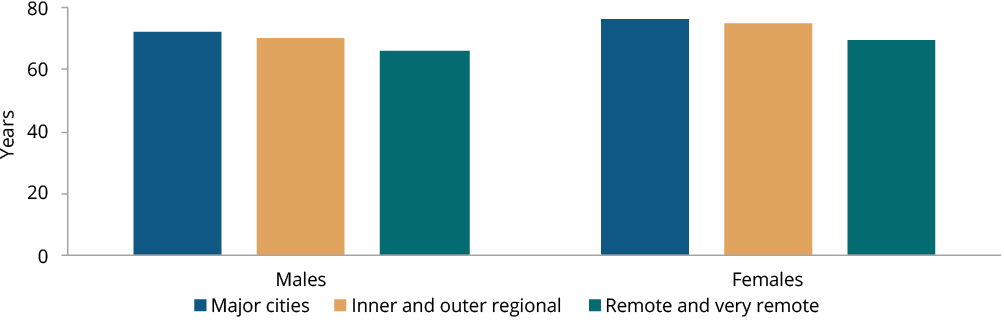
Source: table CtG1A.2, ABS Life Tables for Aboriginal and Torres Strait Islander Australians.
Figure C.2 – Estimated life expectancy at birth of Aboriginal and Torres Strait Islander people, 2015–2017
by sex, by Index of Relative Socio-economic Disadvantage (IRSD) quintile
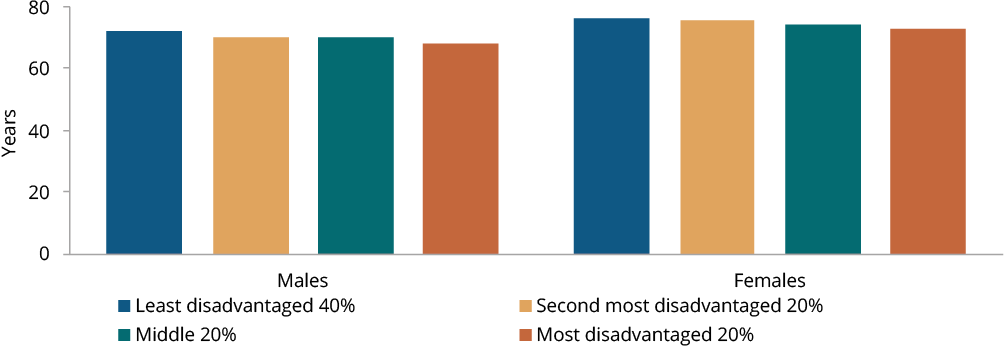
Source: CtG1A.3, ABS Life Tables for Aboriginal and Torres Strait Islander Australians.
Supporting indicators for Socio-Economic Outcome (SEO) 1
The supporting indicators currently reported for this outcome area are leading causes of death by age group and access/use of health services.
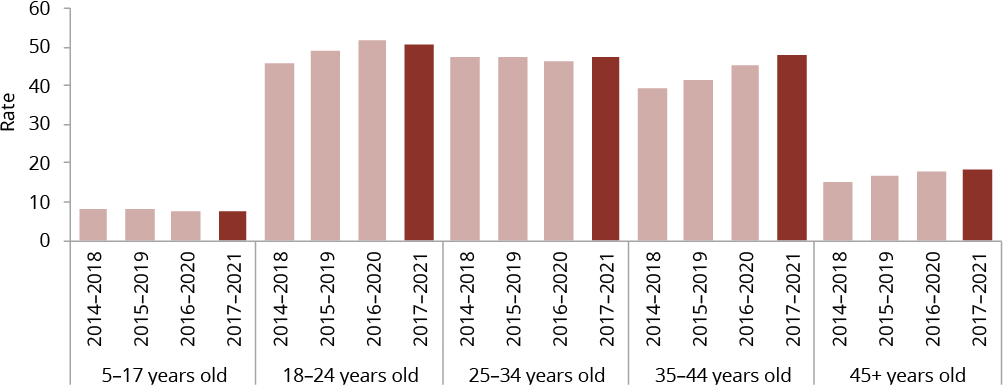
From 2014–2018 to 2017–2021, death rates have increased across most age groups for Aboriginal and Torres Strait Islander people, with gaps widening to the rates for non-Indigenous people. Of note across the leading causes of death, there have been decreases in the rates of death from heart disease for Aboriginal and Torres Strait Islander people in some age groups (though greater decreases for non-Indigenous people) and increases in rates of death from self-harm for those aged 35–49 years (with decreases for non-Indigenous people).
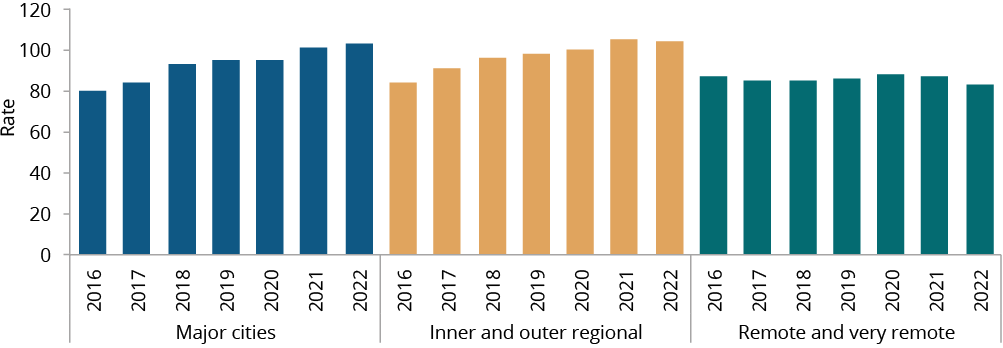
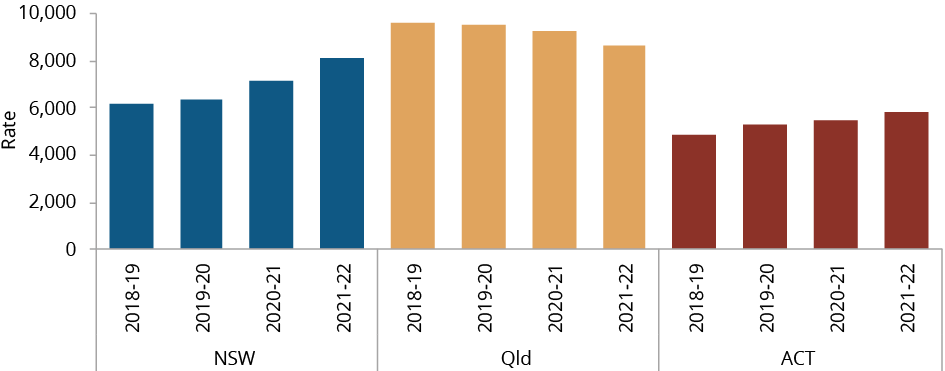
In recent years, attendance for Indigenous-specific health checks has decreased. Following a peak in 2018-19, the rate of Aboriginal and Torres Strait Islander people accessing Indigenous-specific health checks has decreased and in 2021-22 was below the 2016-17 baseline.
Figure C.3 – Rate of Aboriginal and Torres Strait Islander-specific health checks or assessments, per 1,000 Aboriginal and Torres Strait Islander people
by jurisdiction, by year
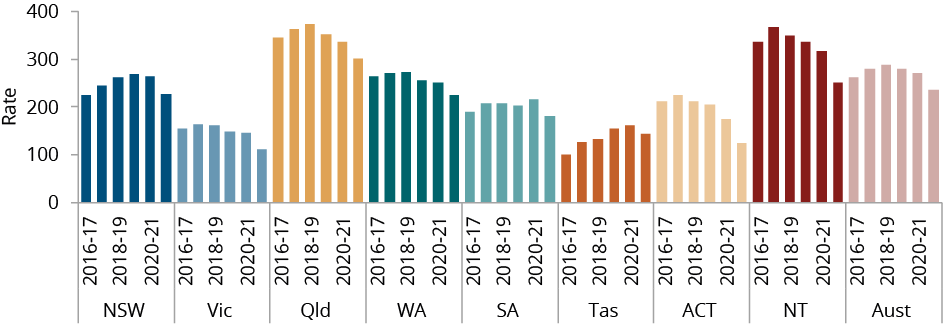
Source: table SE1e.1, Derived from Australian Government Department of Health and Aged Care (unpublished) Medicare Benefits Schedule (MBS) statistics; ABS Estimates and Projections Aboriginal and Torres Strait Islander Australians.
Dashboard snapshot
Data for download
Socio-economic outcome area 2
Aboriginal and Torres Strait Islander children are born healthy and strong
Nationally in 2020, 89.0% of Aboriginal and Torres Strait Islander babies born were of a healthy birthweight. This is an increase from 88.8% in 2017 (the baseline year).
While this is an improvement, the national target is not on track to be met (noting this assessment should be used with caution as it is based on a limited number of data points). The average annual change since the baseline is 0.12 percentage points (pp), which is around three quarters of what is required (0.16 pp) to meet the target.
|
Target 2
|
Unit
|
NSW
|
Vic
|
Qld
|
WA
|
SA
|
Tas
|
ACT
|
NT
|
Aust
|
National Target
|
|
Progress
|
Level
|
Worsening
|
Improvement
|
Improvement
|
Improvement
|
Improvement
|
Improvement
|
Worsening
|
Worsening
|
Improvement but not on track (National)
|
|
|
Baseline
|
%
|
90.4
|
88.8
|
89.1
|
86.9
|
88.4
|
88.5
|
88.6
|
85.6
|
88.8
|
91.0
|
|
Current year
|
%
|
89.9
|
89.5
|
89.4
|
88.0
|
89.8
|
90.1
|
87.7
|
83.8
|
89.0
|
91.0
|
|
Annual change
|
pp
|
-0.09
|
0.31
|
0.11
|
0.38
|
0.74
|
0.45
|
-0.47
|
-0.52
|
0.12
|
0.16
|
The proportions of babies born of a healthy birthweight were higher in major cities and regional areas compared to more remote areas, and higher for babies born in the least disadvantaged areas of Australia compared to the most disadvantaged areas. The proportions for boys and girls have remained relatively unchanged since the baseline year.
Figure C.4 – Proportion of Aboriginal and Torres Strait Islander live-born singleton babies of healthy birthweight (2,500–4,499g)
by remoteness area, by year
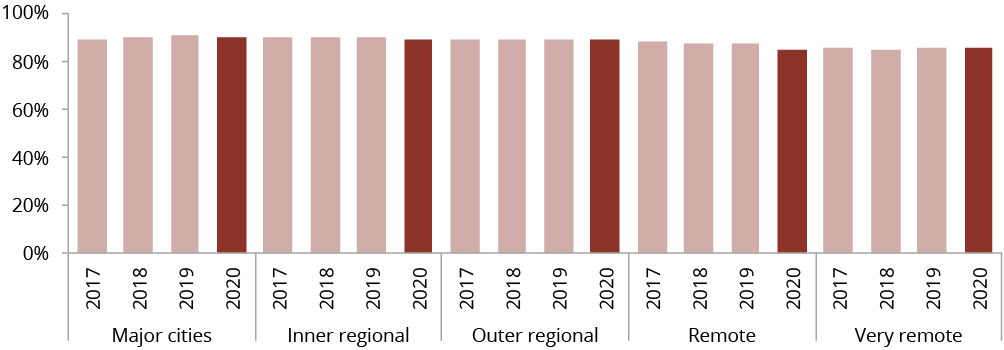
Source: table CtG2A.3, Australian Institute of Health and Welfare (AIHW) (unpublished) National Perinatal Data Collection.
Figure C.5 – Proportion of Aboriginal and Torres Strait Islander live-born singleton babies of healthy birthweight (2,500–4,499g)
by Index of Relative Socio-economic Disadvantage (IRSD) quintile, by year
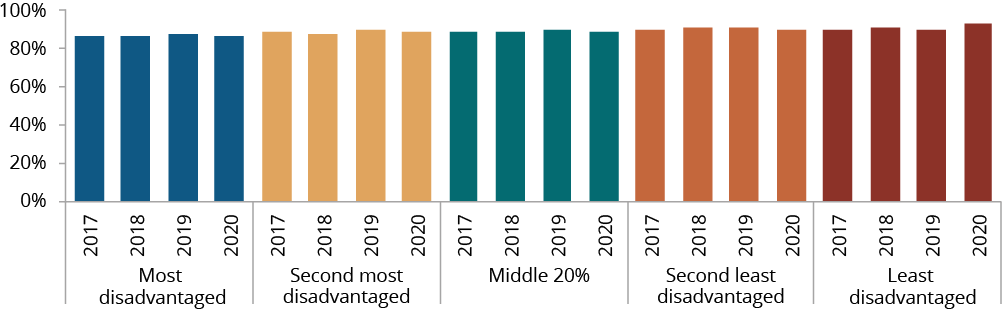
Source: table CtG2A.4, AIHW (unpublished) National Perinatal Data Collection.
Supporting indicators for SEO 2
The supporting indicator currently reported for this outcome area is use of antenatal care.
Nationally from 2017 to 2020, the proportions of Aboriginal and Torres Strait Islander women who had five or more antenatal visits during their pregnancy (of at least 32 weeks) and/or at least one antenatal visit in their first trimester have both increased (though less so but off a higher base for the former).
Figure C.6 – Proportion of Aboriginal and Torres Strait Islander women who gave birth at 32 weeks or more gestation and attended five or more antenatal visits
by jurisdiction, by year
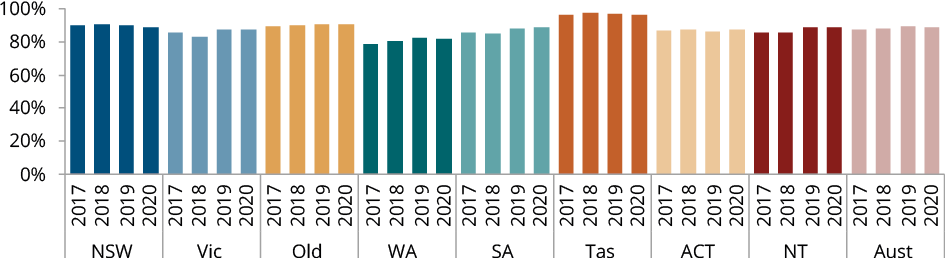
Source: table SE2d.1, AIHW (unpublished) National Perinatal Data Collection
Figure C.7 – Proportion of Aboriginal and Torres Strait Islander women who gave birth and attended at least one antenatal visit in the first trimester
by jurisdiction, by year
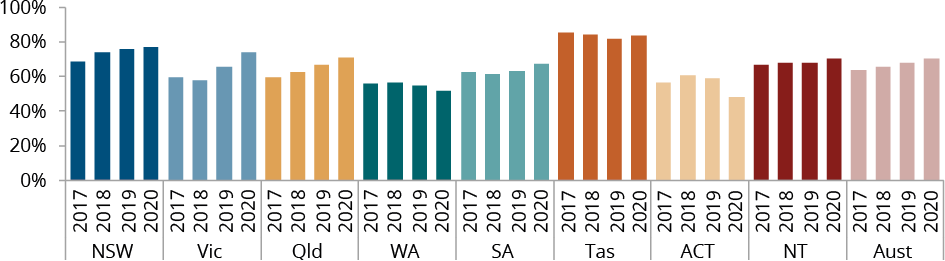
Source: table SE2d.2, AIHW (unpublished) National Perinatal Data Collection.
Dashboard snapshot
Data for download
Socio-economic outcome area 3
Aboriginal and Torres Strait Islander children are engaged in high quality, culturally appropriate early childhood education in their early years
Nationally in 2022, 99.2% of Aboriginal and Torres Strait Islander children in the YBFS age cohort were enrolled in a preschool program. This is an increase from 76.7% in 2016 (the baseline year).
Nationally, the target shows good improvement and is on track to be met (noting this assessment is made with a high level of confidence). The average annual change is 3.72 percentage points (pp), which is almost twice what is required (2.03 pp) to meet the target.
|
Target 3
|
Unit
|
NSW
|
Vic
|
Qld
|
WA
|
SA
|
Tas
|
ACT
|
NT
|
Aust
|
National Target
|
|
Progress
|
Level
|
Improvement
|
Improvement
|
Improvement
|
Improvement
|
Improvement
|
Improvement
|
Improvement
|
Worsening
|
Good improvement and on track
|
|
|
Baseline
|
%
|
60.1
|
88.1
|
82.2
|
94.8
|
96.3
|
90.9
|
85.4
|
79.5
|
76.7
|
95.0
|
|
Current year
|
%
|
95.8
|
125.8
|
95.2
|
109.2
|
115.5
|
112.7
|
113.7
|
68.7
|
99.2
|
95.0
|
|
Annual change
|
pp
|
5.58
|
6.26
|
2.47
|
2.61
|
2.27
|
3.63
|
6.41
|
-1.12
|
3.72
|
2.03
|
In 2022, similar proportions of Aboriginal and Torres Strait Islander boys and girls were enrolled in a YBFS preschool program.
Figure C.8 – Proportion of Aboriginal and Torres Strait Islander children in the state-specific YBFS age cohort who are enrolled in a preschool program
by sex, by year
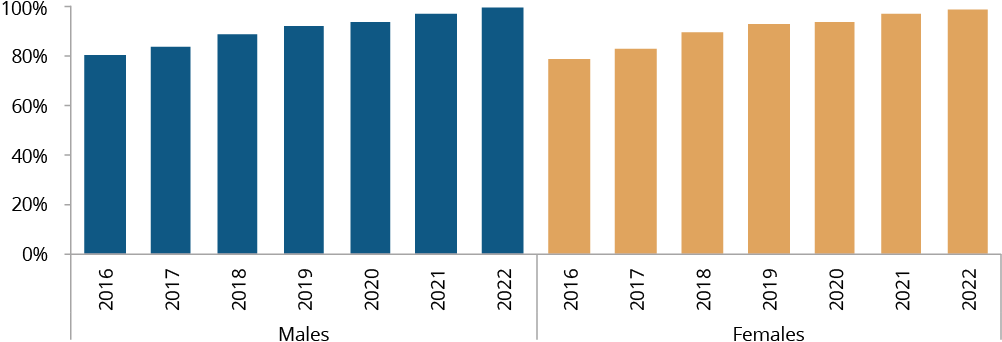
Source: table CtG3A.3, Derived from ABS (unpublished) Preschool Education Australia; ABS (unpublished) Estimates and Projections Aboriginal and Torres Strait Islander Australians. YBFS = Year before full-time schooling.
Preschool enrolments in both major cities and regional areas have increased, while enrolments in remote and very remote areas have decreased. The data by the socio-economic status of the locality is currently only available for 2016, and shows that the enrolment rate was highest in the least disadvantaged areas. In 2022, the rates of disability were higher for Aboriginal and Torres Strait Islander children enrolled in a state and territory government-funded preschool program in the YBFS, than for non-Indigenous children. Disability is defined differently across jurisdictions and the data is sourced from different data sources to the other data for this target.
Figure C.9 – Rate of Aboriginal and Torres Strait Islander children in the state-specific YBFS age cohort who are enrolled in a preschool program, per 100 children aged 4 years in the community
by remoteness area, by year
Source: table CtG3A.5, Derived from ABS (unpublished) Preschool Education Australia; ABS (unpublished) Estimates and Projections Aboriginal and Torres Strait Islander Australians. YBFS = Year before full-time schooling.
Supporting indicators for SEO 3
The supporting indicator currently reported for this outcome area is the number of Aboriginal and Torres Strait Islander-focused integrated early years services.
In 2022, there were 108 Aboriginal and Torres Strait Islander community-controlled early years services; this number has increased annually since 2016. There were 67 government and/or non-Indigenous controlled services reported in 2022, the first year of available data.
Figure C.10 – Number of Aboriginal and Torres Strait Islander-focused integrated early years services
by year, by governance structurea
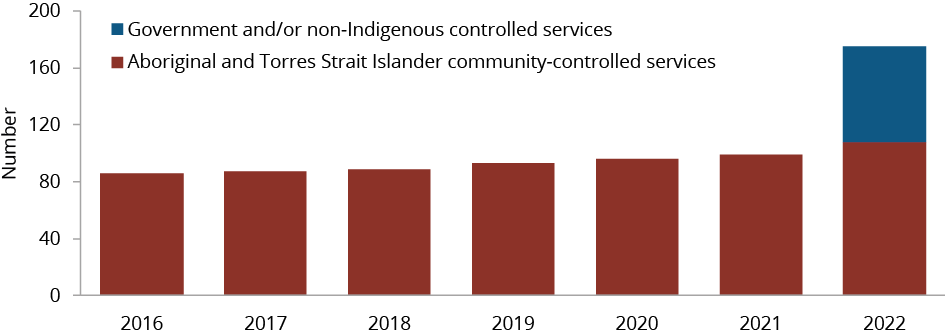
Source: table SE3b.1, SNAICC (unpublished) Register of Aboriginal and Torres Strait Islander-focused integrated early years services.
aData for government and/or non-Indigenous controlled services are not available prior to 2022.
Dashboard snapshot
Data for download
Socio-economic outcome area 4
Aboriginal and Torres Strait Islander children thrive in their early years
Nationally in 2021, 34.3% of Aboriginal and Torres Strait Islander children commencing school were assessed as being developmentally on track in all five Australian Early Development Census (AEDC) domains. This is a decrease from 35.2% in 2018 (the baseline year).
Nationally, the target is worsening (noting this assessment should be used with caution as it is based on a limited number of data points). The average annual change is a decrease of 0.29 percentage points (pp), with an average annual increase of 1.52 pp required to meet the target.
|
Target 4
|
Unit
|
NSW
|
Vic
|
Qld
|
WA
|
SA
|
Tas
|
ACT
|
NT
|
Aust
|
National Target
|
|
Progress
|
Level
|
Worsening
|
Improvement
|
Improvement
|
Worsening
|
Improvement
|
Improvement
|
Improvement
|
Worsening
|
Worsening
|
|
|
Baseline
|
%
|
42.2
|
35.1
|
33.5
|
31.4
|
29.0
|
37.5
|
26.4
|
18.2
|
35.2
|
55.0
|
|
Current year
|
%
|
38.8
|
35.6
|
33.8
|
31.3
|
31.3
|
38.3
|
27.3
|
16.4
|
34.3
|
55.0
|
|
Annual change
|
pp
|
-1.14
|
0.17
|
0.11
|
-0.04
|
0.75
|
0.26
|
0.30
|
-0.60
|
-0.29
|
1.52
|
The proportion of Aboriginal and Torres Strait Islander children assessed as being developmentally on track when commencing school in 2021 was higher for girls (41.6%) than boys (27.1%). The proportion declined across areas as remoteness increased, with the largest decrease from remote to very remote areas. The proportion also declined for children living in more disadvantaged areas. Nationally in 2021, the proportions of Aboriginal and Torres Strait Islander children commencing school with a medically diagnosed special need or who had been identified by teachers as requiring further assessment to determine if they have a developmental difficulty that affects their ability to do schoolwork in a regular classroom, had increased from 2018.
Figure C.11 – Proportion of Aboriginal and Torres Strait Islander children assessed as developmentally on track in all five domains of the AEDC
by remoteness area, by year
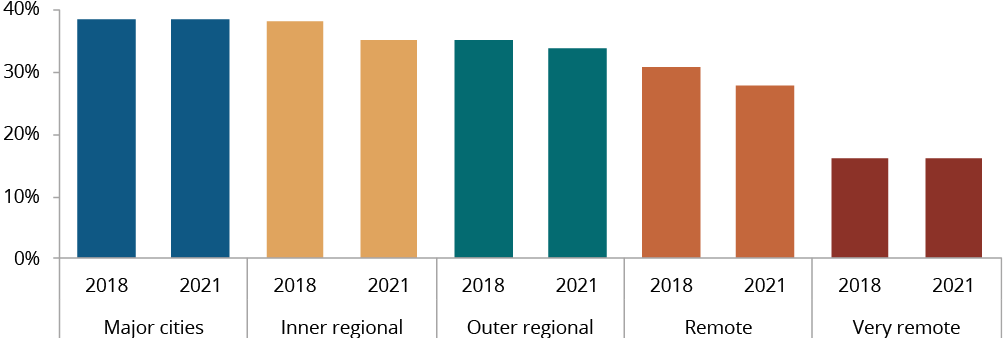
Source: table CtG4A.3, Australian Government Department of Education Skills and Employment Australian Early Development Census (AEDC).
Figure C.12 – Proportion of Aboriginal and Torres Strait Islander children assessed as developmentally on track in all five domains of the AEDC
by Index of Relative Socio-economic Disadvantage (IRSD) quintile, by year
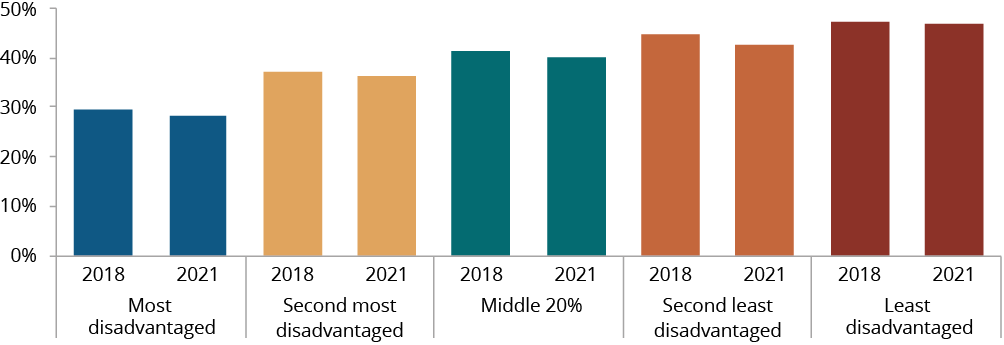
Source: table CtG4A.4 Australian Government Department of Education Skills and Employment (unpublished) Australian Early Development Census (AEDC).
Supporting indicators for SEO 4
The supporting indicator currently reported for this outcome area is the AEDC Multiple Strengths Indicator which measures strengths in children irrespective of whether they are or are not developmentally on track in all five Australian Early Development Census (AEDC) domains.
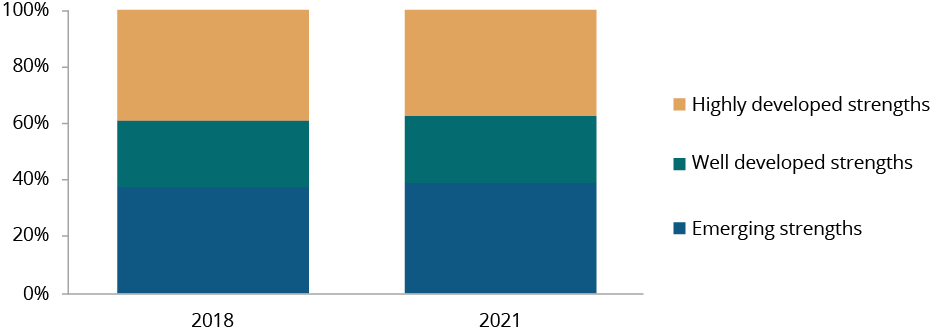
The proportion of Aboriginal and Torres Strait Islander children commencing school assessed as having highly developed strengths decreased slightly from 2018 to 2021 (1.3 percentage points), with corresponding increases in the proportion assessed as having emerging strengths and well developed strengths.
Figure C.13 – Proportion of Aboriginal and Torres Strait Islander children in the first year of full-time schooling assessed in the AEDC as having highly developed, well developed and emerging strengths
by year
Source: table SE4d.1, Australian Government Department of Education Skills and Employment (unpublished) Australian Early Development Census.
Dashboard snapshot
Data for download
Socio-economic outcome area 5
Aboriginal and Torres Strait Islander students achieve their full learning potential
Nationally in 2021, 68.1% of Aboriginal and Torres Strait Islander people aged 20–24 years had attained a Year 12 or equivalent or above qualification (referred to here as Year 12 attainment). This is an increase from 63.2% in 2016 (the baseline year).
While there has been improvement, the national target is not on track to be met (noting this assessment should be used with caution as it is based on a limited number of data points). The average annual change is 0.98 percentage points (pp) which is less than half of what is required (2.19 pp) to meet the target.
|
Target 5
|
Unit
|
NSW
|
Vic
|
Qld
|
WA
|
SA
|
Tas
|
ACT
|
NT
|
Aust
|
National Target
|
|
Progress
|
Level
|
Improvement
|
Improvement
|
Improvement
|
Improvement
|
Improvement
|
Improvement
|
Improvement
|
Improvement
|
Improvement but not on track (National)
|
|
|
Baseline
|
%
|
64.3
|
69.6
|
69.5
|
57.4
|
61.4
|
62.7
|
77.4
|
37.5
|
63.2
|
96.0
|
|
Current year
|
%
|
69.3
|
72.6
|
75.0
|
61.1
|
64.6
|
68.1
|
82.1
|
40.2
|
68.1
|
96.0
|
|
Annual change
|
pp
|
1.01
|
0.60
|
1.09
|
0.73
|
0.63
|
1.07
|
0.94
|
0.53
|
0.98
|
2.19
|
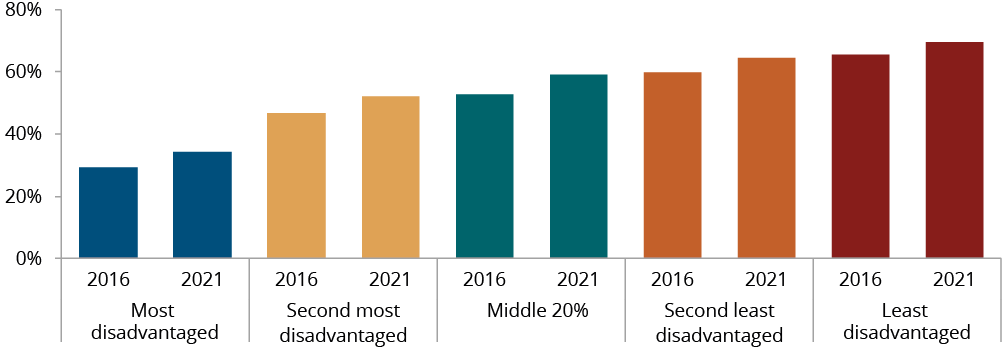
Nationally in 2021, Aboriginal and Torres Strait Islander females had higher Year 12 attainment rates than males, with the female rate higher in 2016 and increasing more than for males. Since the baseline year, rates have increased in all socio-economic and remoteness areas, though by less than one percentage point in very remote areas. Attainment was highest in major cities and the least disadvantaged socio-economic areas of Australia, and declined as remoteness and location disadvantage increased. A lower proportion of people with a need for assistance with core activities had attained Year 12 compared with people who did not require assistance (64.3% and 69.6% respectively). Attainment was mainly driven by completion of schooling at Year 12 or equivalent (59.5%), compared to people who had not completed school but had obtained a non-school qualification at Certificate level III or above (8.6%).
Figure C.14 – Proportion of Aboriginal and Torres Strait Islander people, aged 20–24 years, who have attained Year 12 or equivalent or above
by remoteness area, by year
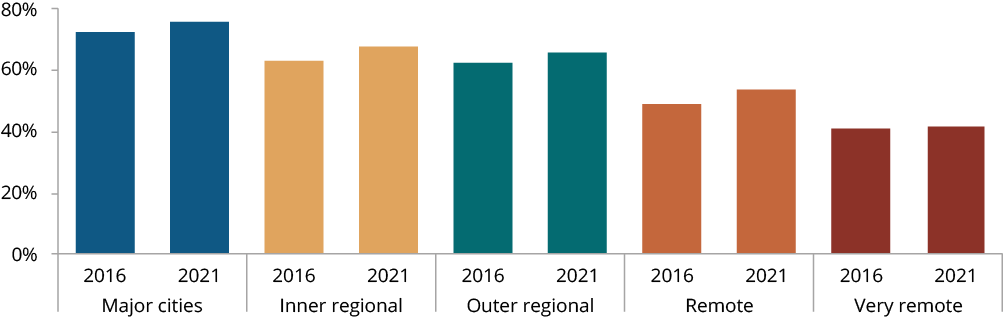
Source: table CtG5A.3, ABS (unpublished) Census of Population and Housing.
Figure C.15 – Proportion of Aboriginal and Torres Strait Islander people, aged 20–24 years, who have attained Year 12 or equivalent or above
by Index of Relative Socio-economic Disadvantage (IRSD) quintile, by year
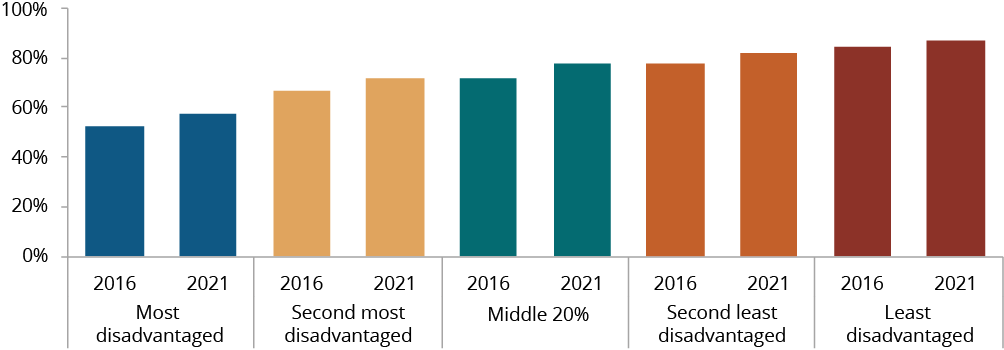
Source: table CtG5A.4, ABS (unpublished) Census of Population and Housing.
Supporting indicators for SEO 5
There are currently no supporting indicators for target 5 reported on the dashboard.
Dashboard snapshot
Data for download
Socio-economic outcome area 6
Aboriginal and Torres Strait Islander students reach their full potential through further education pathways
Nationally in 2021, 47.0% of Aboriginal and Torres Strait Islander people aged 25–34 years had completed non-school qualifications at Certificate level III or above. This is an increase from 42.3% in 2016 (the baseline year).
While there has been improvement, the national target is not on track to be met (noting this assessment should be used with caution as it is based on a limited number of data points). The average annual change of 0.95 percentage points (pp) is around half of what is required (1.85 pp) to meet the target.
|
Target 6
|
Unit
|
NSW
|
Vic
|
Qld
|
WA
|
SA
|
Tas
|
ACT
|
NT
|
Aust
|
National Target
|
|
Progress
|
Level
|
Improvement
|
Improvement
|
Improvement
|
Improvement
|
Improvement
|
Improvement
|
Improvement
|
Improvement
|
Improvement but not on track (National)
|
|
|
Baseline
|
%
|
48.3
|
56.5
|
42.4
|
33.8
|
39.8
|
47.0
|
62.1
|
18.1
|
42.3
|
70.0
|
|
Current year
|
%
|
54.1
|
58.5
|
47.2
|
37.1
|
42.2
|
51.2
|
64.7
|
19.0
|
47.0
|
70.0
|
|
Annual change
|
pp
|
1.15
|
0.40
|
0.97
|
0.67
|
0.48
|
0.85
|
0.52
|
0.18
|
0.95
|
1.85
|
Nationally in 2021, Aboriginal and Torres Strait Islander females had higher proportions who had completed non-school qualifications at Certificate level III or above than males, with the female rate of completion higher in 2016 and increasing more than for males. Rates were higher in major cities and the least socio-economically disadvantaged areas and declined as remoteness and location disadvantage increased. Since 2016, rates have increased across all areas, except very remote areas. People with a need for assistance with core activities had lower rates for completion of Certificate level III or above (28.5%) compared with people who did not require assistance (49.8%). Of people aged 25–34 who completed a Certificate level III or above, the most common qualification completed was Certificate level III or IV (around 3 in 5 of the completed qualifications).
Figure C.16 – Proportion of Aboriginal and Torres Strait Islander people, aged 25–34 years, who have completed a non-school qualification of Certificate level III or above
by remoteness area, by year
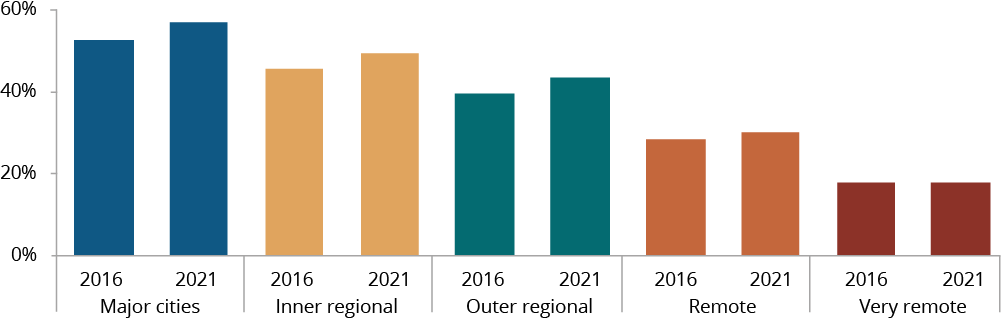
Source: table CtG6A.3, ABS (unpublished) Census of Population and Housing.
Figure C.17 – Proportion of Aboriginal and Torres Strait Islander people, aged 25–34 years, who have completed a non-school qualification of Certificate level III or above
by Index of Relative Socio-economic Disadvantage (IRSD) quintile, by year
Source: table CtG6A.4, ABS (unpublished) Census of Population and Housing.
Supporting indicators for SEO 6
The supporting indicators currently reported for this outcome area are rates of university and Vocational Education and Training commencement, attrition, and completion.
The number of Aboriginal and Torres Strait Islander people commencing a domestic bachelor’s degree at an Australian university has increased, while the number commencing a VET qualification at Certificate level III or above has decreased over time. Nationally in 2021, 5,460 Aboriginal and Torres Strait people commenced a domestic bachelor’s degree, up from 4,862 in 2016, while the number commencing a Certificate level III or above qualification was 36,950, a decrease from 39,750 in 2016.
The proportion of students staying on past their first year of their bachelor’s degree is increasing (the first year attrition rate decreased to 22.5% in 2021), with projected completion rates for Certificate level III or above at similar levels in recent years (35.7% projected for 2022 and 2023, for students who commenced in 2018 and 2019 respectively).
Dashboard snapshot
Data for download
Socio-economic outcome area 7
Aboriginal and Torres Strait Islander youth are engaged in employment or education
Nationally in 2021, 58.0% of Aboriginal and Torres Strait Islander people aged 15–24 years were fully engaged in employment, education or training. This is an increase from 57.2% in 2016 (the baseline year).
While there has been improvement, the national target is not on track to be met (noting this assessment should be used with caution as it is based on a limited number of data points). The average annual change of 0.17 percentage points (pp) is around one-quarter of what is required (0.65 pp) to meet the target.
|
Target 7
|
Unit
|
NSW
|
Vic
|
Qld
|
WA
|
SA
|
Tas
|
ACT
|
NT
|
Aust
|
National Target
|
|
Progress
|
Level
|
Improvement
|
Improvement
|
Improvement
|
Improvement
|
Worsening
|
Improvement
|
Improvement
|
Worsening
|
Improvement but not on track (National)
|
|
|
Baseline
|
%
|
61.7
|
65.4
|
55.4
|
51.5
|
57.6
|
62.4
|
73.7
|
40.0
|
57.2
|
67.0
|
|
Current year
|
%
|
62.0
|
65.5
|
58.1
|
53.1
|
55.5
|
63.3
|
74.4
|
34.8
|
58.0
|
67.0
|
|
Annual change
|
pp
|
0.06
|
0.02
|
0.53
|
0.31
|
-0.42
|
0.18
|
0.14
|
-1.03
|
0.17
|
0.65
|
Nationally in 2021, a higher proportion of Aboriginal and Torres Strait Islander males were fully engaged in employment, education or training (59.2%) than females (56.9%). The proportion was highest for people aged 15 years (91.5%) and declined with each year of age to 19 years (42.9%), before remaining within a couple of percentage points to 24 years. Engagement decreased for people in areas with increasing remoteness and increasing socio-economic disadvantage. A lower proportion (44.8%) of people with a need for assistance with core activities were fully engaged compared with people who did not require assistance (59.0%). Most people fully engaged were engaged in full-time study.
Figure C.18 – Aboriginal and Torres Strait Islander people, aged 15–24 years, who are fully engaged in employment, education or training
by age, by year
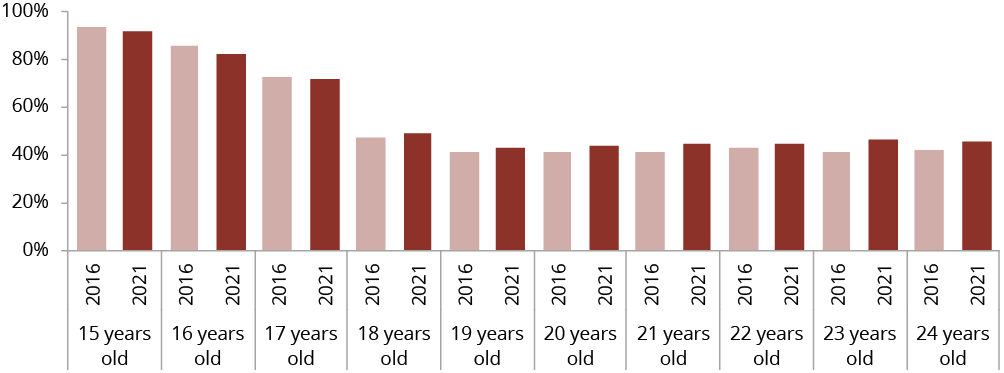
Source: table CtG7A.3, ABS (unpublished) Census of Population and Housing.
Figure C.19 – Aboriginal and Torres Strait Islander people, aged 15–24 years, who are fully engaged in employment, education or training
by Index of Relative Socio-economic Disadvantage (IRSD) quintile, by year
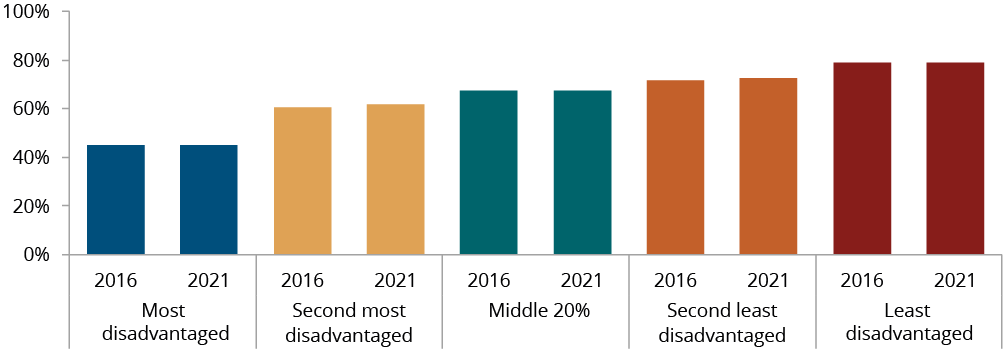
Source: table CtG7A.5, ABS (unpublished) Census of Population and Housing.
Supporting indicators for SEO 7
The supporting indicator currently reported for this outcome area is the proportion of youth not engaged in employment, education or training, by disability, long term health condition, caring responsibility and looking for work.
Nationally in 2021, for Aboriginal and Torres Strait Islander people aged 15–24 years, almost one-third of the young people not fully engaged were providing unpaid care and assistance, which was a larger proportion than those who had a need for assistance with core activities or who had a long-term health condition (both of which were less than 10%). For those not fully engaged, just over half were not in the labour force, with the other half partially engaged with part-time work or unemployed and looking for work.
Figure C.20 – Aboriginal and Torres Strait Islander people, aged 15–24 years, who are not fully engaged in employment; education or training
by labour force status, by year
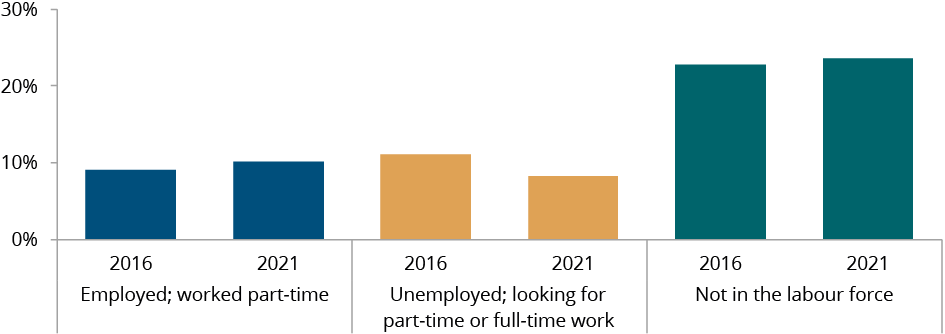
Source: table SE7a.4, ABS (unpublished) Census of Population and Housing.
Dashboard snapshot
Data for download
Socio-economic outcome area 8
Strong economic participation and development of Aboriginal and Torres Strait Islander people and communities
Nationally in 2021, 55.7% of Aboriginal and Torres Strait Islander people aged 25–64 years were employed. This is an increase from 51.0% in 2016 (the baseline year).
The national target shows improvement and is on track to be met (noting this assessment should be used with caution as it is based on a limited number of data points). The average annual change of 0.94 percentage points (pp) is above what is required (0.73 pp) to meet the target.
|
Target 8
|
Unit
|
NSW
|
Vic
|
Qld
|
WA
|
SA
|
Tas
|
ACT
|
NT
|
Aust
|
National Target
|
|
Progress
|
Level
|
Improvement
|
Improvement
|
Improvement
|
Improvement
|
Improvement
|
Improvement
|
Improvement
|
Worsening
|
Good improvement and on track
|
|
|
Baseline
|
%
|
54.6
|
57.3
|
52.1
|
44.7
|
46.4
|
59.0
|
70.1
|
35.4
|
51.0
|
62.0
|
|
Current year
|
%
|
59.6
|
62.0
|
57.2
|
49.8
|
50.1
|
62.4
|
73.0
|
34.3
|
55.7
|
62.0
|
|
Annual change
|
pp
|
1.00
|
0.94
|
1.04
|
1.01
|
0.74
|
0.69
|
0.58
|
-0.21
|
0.94
|
0.73
|
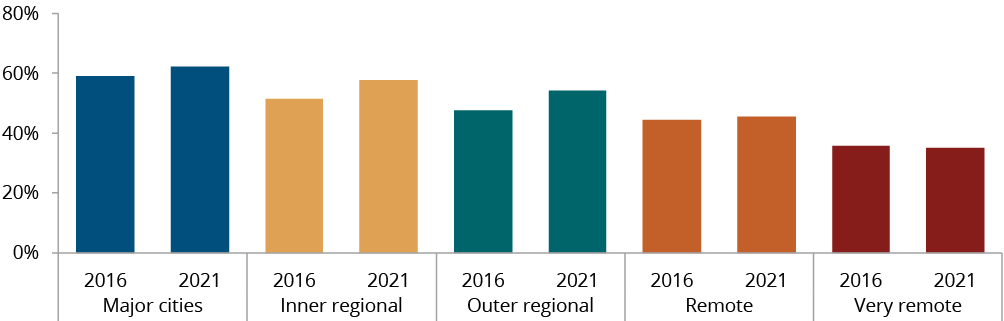
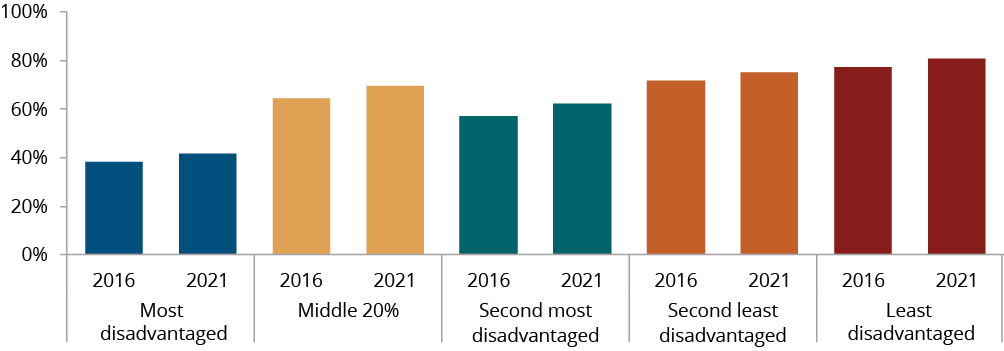
Nationally in 2021, the employment rate was higher for Aboriginal and Torres Strait Islander males (57.7%) than females (53.8%), though this gap has narrowed since 2016. For people aged 25–64 years, rates were similar across the 5-year age groups up to 49 years, but declined for each 5-year age group thereafter. The rate was highest in major cities and the least disadvantaged socio-economic areas and declined as remoteness and location disadvantage increased. Since the baseline year, rates have increased in all areas, except for very remote areas with a decrease of less than one percentage point. The employment rate for people without a need for assistance with core activities (61.7%) was more than four times the rate for people with a need for assistance (14.2%).
Figure C.21 – Aboriginal and Torres Strait Islander people, aged 25–64 years, who are employed
by remoteness area, by year
Source: table CtG8A.4, ABS (unpublished) Census of Population and Housing.
Figure C.22 – Aboriginal and Torres Strait Islander people, aged 25–64 years, who are employed
by Index of Relative Socio-economic Disadvantage (IRSD) quintile, by year
Source: table CtG8A.5, ABS (unpublished) Census of Population and Housing.
Supporting indicators for SEO 8
The supporting indicator currently reported for this outcome area is employment by occupation.
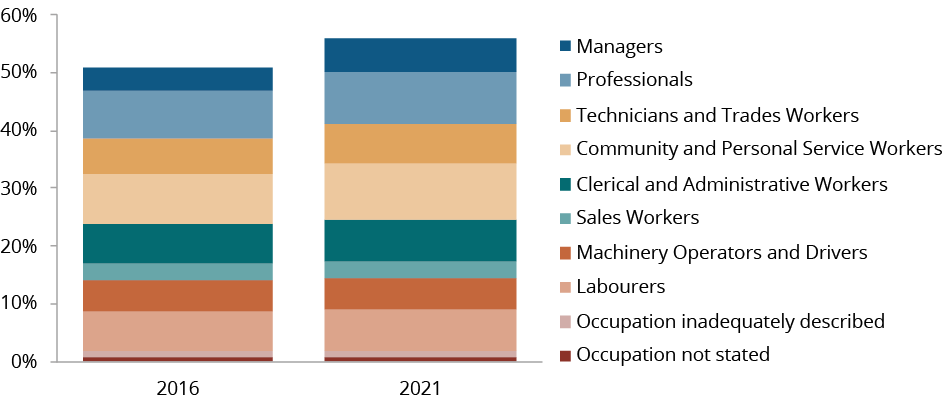
Nationally in 2021, the occupation contributing most to the employment rate for Aboriginal and Torres Strait Islander people was community or personal service worker, followed by professional. Since 2016, the employment rate has increased for all occupations groups, with the largest increase for managers (1.3 percentage points).
Figure C.23 – Aboriginal and Torres Strait Islander people, aged 25–64 years, who are employed
by occupation, by year
Source: table SE8d.1, ABS (unpublished) Census of Population and Housing.
Dashboard snapshot
Data for download
Socio-economic outcome area 9
Aboriginal and Torres Strait Islander people secure appropriate, affordable housing that is aligned with their priorities and need
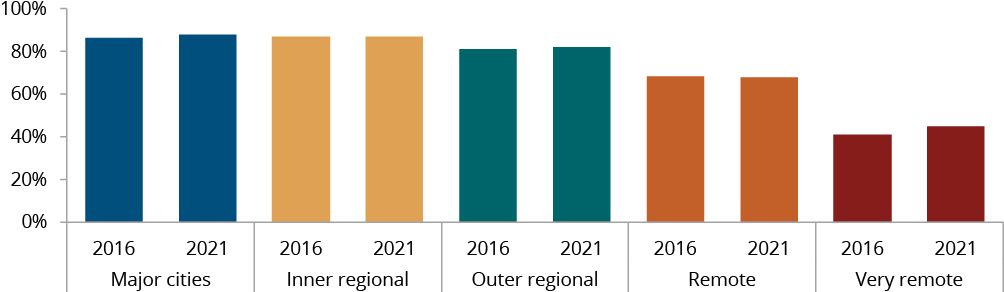
Nationally in 2021, 81.4% of Aboriginal and Torres Strait Islander people were living in appropriately sized (not overcrowded) housing. This is an increase from 78.9% in 2016 (the baseline year).
While there has been improvement, the national target is not on track to be met (noting this assessment should be used with caution as it is based on a limited number of data points). The average annual change is 0.51 percentage points (pp) which is below what is required (0.61 pp) to meet the target.
Target 9B is not able to be reported against as there is no data source currently available which includes all required data elements.
|
Target 9
|
Unit
|
NSW
|
Vic
|
Qld
|
WA
|
SA
|
Tas
|
ACT
|
NT
|
Aust
|
National Target
|
|
Progress
|
Level
|
Improvement
|
Improvement
|
Improvement
|
Improvement
|
Improvement
|
Worsening
|
Worsening
|
Improvement
|
Improvement but not on track (National)
|
|
|
Baseline
|
%
|
85.9
|
87.6
|
79.4
|
75.2
|
82.5
|
89.9
|
91.6
|
38.4
|
78.9
|
88.0
|
|
Current year
|
%
|
87.5
|
88.8
|
81.2
|
78.8
|
82.8
|
88.8
|
90.7
|
43.4
|
81.4
|
88.0
|
|
Annual change
|
pp
|
0.32
|
0.23
|
0.36
|
0.72
|
0.05
|
-0.22
|
-0.17
|
1.00
|
0.51
|
0.61
|
|
Progress
|
–
|
No assessment
|
No assessment
|
No assessment
|
No assessment
|
No assessment
|
No assessment
|
No assessment
|
No assessment
|
No assessment
|
|
Nationally in 2021, the proportion of Aboriginal and Torres Strait Islander males and females living in appropriately sized housing was between 81–82%, having increased at similar rates from 2016. Rates were just under 80% for all age groups under 25 years, with rates increasing for older age groups peaking at 91.8% for those aged 65 years or over. The rate was highest in major cities and the least socio-economically disadvantaged areas, and declined as remoteness and location disadvantage increased, with the largest declines from remote to very remote areas and from the second most to the most disadvantaged areas. A higher proportion (85.5%) of people with a need for assistance with core activities lived in appropriately sized housing compared with people who did not require assistance (81.4%). More than half of people living in overcrowded dwellings required one extra bedroom.
Figure C.24 – Aboriginal and Torres Strait Islander people living in appropriately sized (not overcrowded) dwellings
by remoteness area, by year
Source: table CtG9A.4, ABS (unpublished) Census of Population and Housing.
Figure C.25 – Aboriginal and Torres Strait Islander people living in appropriately sized (not overcrowded) dwellings
by Index of Relative Socio-economic Disadvantage (IRSD) quintile, by year
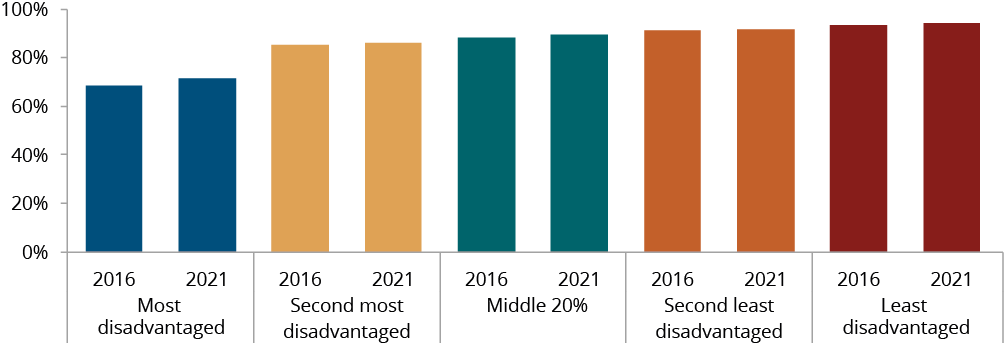
Source: table CtG9A.5, ABS (unpublished) Census of Population and Housing.
Supporting indicators for SEO 9
The supporting indicator currently reported for this outcome area is the proportion of households living in housing of an acceptable standard.
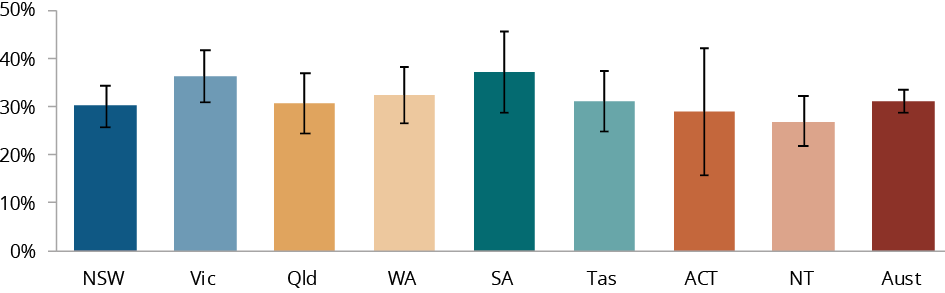
Nationally in 2018-19, four in five Aboriginal and Torres Strait Islander households reported living in houses classified as being of an acceptable standard. Houses of an acceptable standard have four working facilities (for washing people, clothes or bedding, for storing/preparing food, and a working sewerage system) and no more than two major structural problems. Two-thirds of households reported living in dwellings with no major structural problems and more than 95% of households reported living in dwellings with working facilities for washing people, clothes or bedding, and a working sewerage system. For storing and preparing food, the proportion was lower at 90.9%.
Figure C.26 – Proportion of Aboriginal and Torres Strait Islander households living in houses of an acceptable standard, 2018-19
by jurisdiction
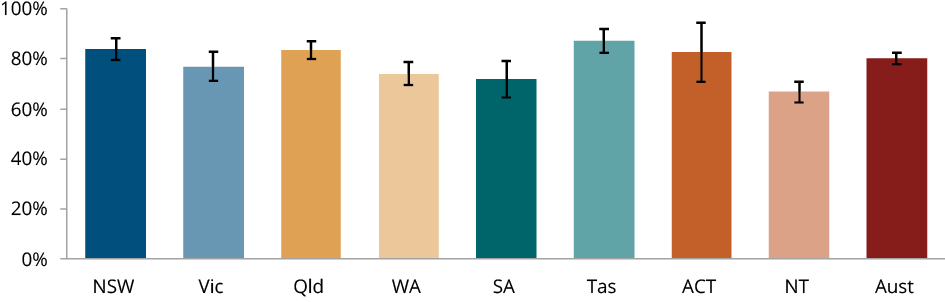
Source: table SE9e.1, ABS (unpublished) National Aboriginal and Torres Straight Islander Health Survey Australia. Error bars represent 95% confidence intervals.
Dashboard snapshot
Data for download
Socio-economic outcome area 10
Aboriginal and Torres Strait Islander adults are not overrepresented in the criminal justice system
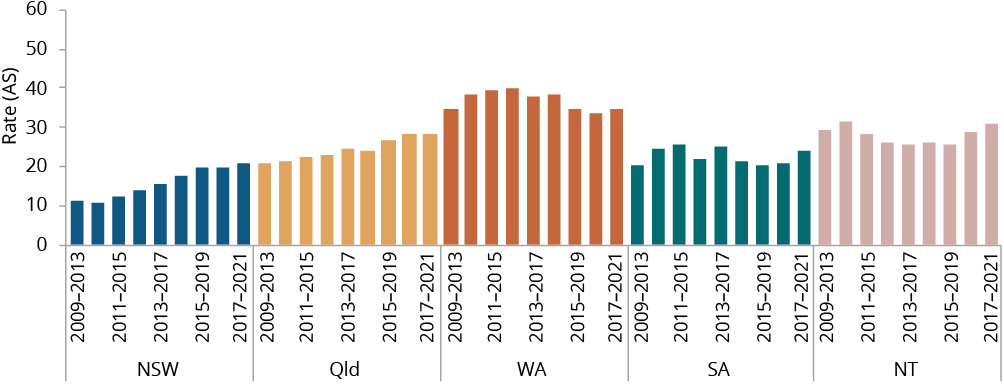
Nationally, at 30 June 2022, the age-standardised rate of Aboriginal and Torres Strait Islander prisoners was 2,151.1 per 100,000 adult population (or two in 100). This is an increase from 2,142.9 per 100,000 in 2019 (the baseline year).
Nationally, the target is worsening (noting this assessment should be used with caution as it is based on a limited number of data points). The average annual change is an increase of 16.03 per 100,000 people, with a decrease of 26.78 per 100,000 required to meet the target.
|
Target 10
|
Unit
|
NSW
|
Vic
|
Qld
|
WA
|
SA
|
Tas
|
ACT
|
NT
|
Aust
|
National Target
|
|
Progress
|
Level
|
Worsening
|
Improvement
|
Worsening
|
Improvement
|
Worsening
|
Improvement
|
Improvement
|
Worsening
|
Worsening
|
|
|
Baseline
|
Rate
|
1,868.9
|
2,114.3
|
1,814.5
|
3,581.8
|
2,395.5
|
729.7
|
1,703.9
|
2,450.8
|
2,142.9
|
1,821.5
|
|
Current year
|
Rate
|
1,878.3
|
1,605.1
|
2,046.9
|
3,213.6
|
2,451.0
|
682.1
|
1,543.8
|
2,771.7
|
2,151.1
|
1,821.5
|
|
Annual change
|
Rate
|
15.34
|
-146.25
|
95.08
|
-115.12
|
25.59
|
-9.98
|
-73.15
|
122.06
|
16.03
|
-26.78
|
Nationally the imprisonment rate for Aboriginal and Torres Strait Islander males is around ten times the rate for females, with the rate for males equivalent to around four in 100 and for females four in 1,000. Rates are highest for those aged 30–39 years, but rates for 25–39 year olds decreased from 2021 to 2022 and for 25–29 year olds are the lowest in four years and now below the rate for 40–44 year olds.
Figure C.27 – Age-standardised imprisonment rate of Aboriginal and Torres Strait Islander adults, per 100,000 people in the community
by sex, by year as at June 30
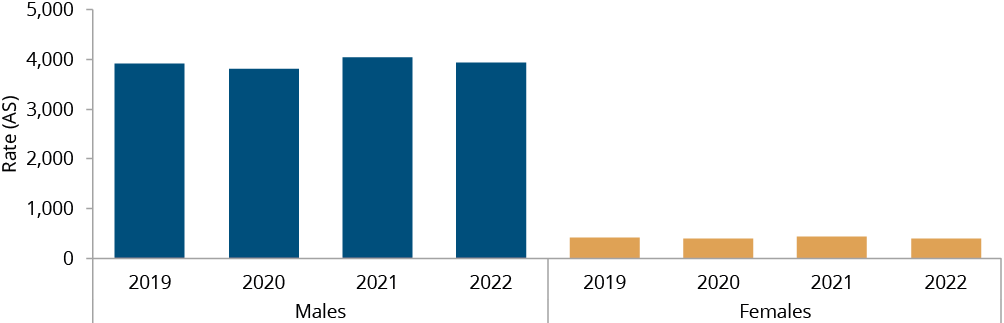
Source: table CtG10A.3, ABS Prisoners in Australia. AS = Age Standardised
Figure C.28 – Imprisonment rate of Aboriginal and Torres Strait Islander adults, per 100,000 people in the community
by age group, by year as at June 30
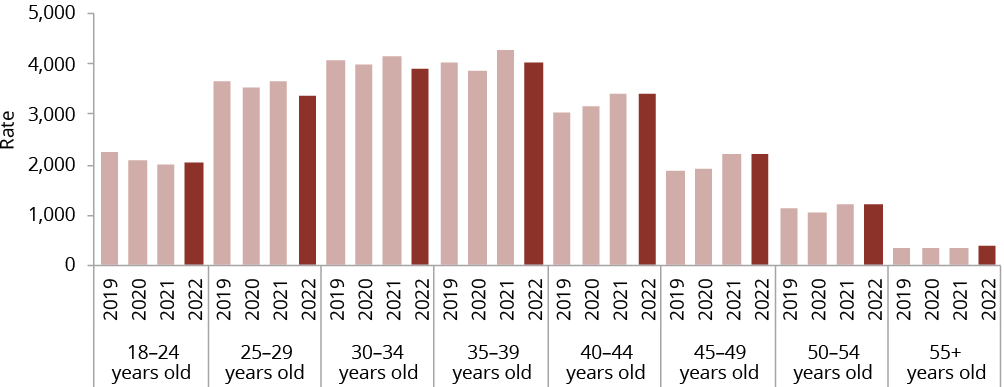
Source: table CtG10A.4, ABS (unpublished) Prisoners in Australia.
Supporting indicators for SEO 10
The supporting indicator currently reported for this outcome area is the proportion of Aboriginal and Torres Strait Islander people charged by police.
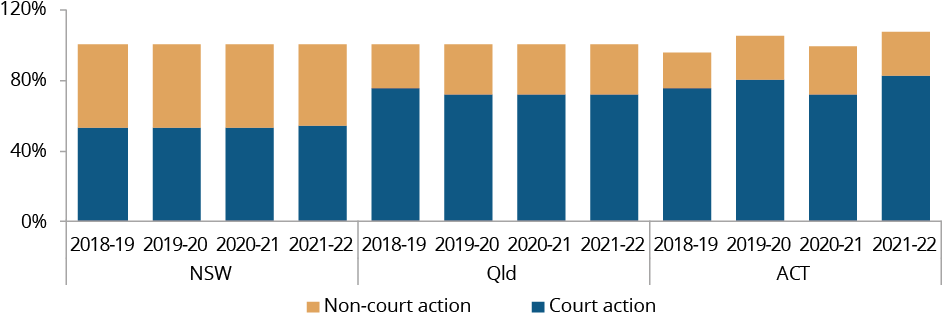
In 2021-22, across the three jurisdictions with available data, the rate of Aboriginal and Torres Strait Islander adults charged by police at least once in the previous 12 months ranged between 6 and 9 per 100 people. Since 2018-19, rates have increased for New South Wales and the Australian Capital Territory and decreased for Queensland. For adults proceeded against by police, the proportion proceeded against with court actions ranged from 95.1 to 99.0% (with 1.0 to 4.2% proceeded against with non-court actions).
Figure C.29 – Rate of Aboriginal and Torres Strait Islander adults charged by police at least once in the previous 12 months, per 100,000 people in the community
by jurisdiction, by year
Source: table SE10a.1, Derived from ABS (unpublished) Recorded Crime – Offenders; ABS (unpublished) National state and territory population – December; ABS Estimates and Projections Aboriginal and Torres Strait Islander Australians.
Dashboard snapshot
Data for download
Socio-economic outcome area 11
Aboriginal and Torres Strait Islander young people are not overrepresented in the criminal justice system
Nationally in 2021-22, the rate of Aboriginal and Torres Strait Islander young people aged 10–17 years in detention on an average day was 28.3 per 10,000 young people. This is a decrease from 32.0 per 10,000 young people in 2018-19 (the baseline year).
Nationally, the target shows good improvement and is on track to be met (noting this assessment should be used with caution as it is based on a limited number of data points). The average annual change is a decrease of 1.36 per 10,000 young people which is more than one and a half times what is required (a decrease of 0.81 per 10,000 young people) to meet the target.
|
Target 11
|
Unit
|
NSW
|
Vic
|
Qld
|
WA
|
SA
|
Tas
|
ACT
|
NT
|
Aust
|
National Target
|
|
Progress
|
Level
|
Improvement
|
Improvement
|
No change (state level)
|
Improvement
|
Improvement
|
Improvement
|
No change (state level)
|
Worsening
|
Good improvement and on track
|
|
|
Baseline
|
Rate
|
22.3
|
18.5
|
41.2
|
55.1
|
27.4
|
8.5
|
15.3
|
30.9
|
32.0
|
22.3
|
|
Current year
|
Rate
|
15.7
|
9.5
|
40.9
|
44.6
|
18.1
|
6.7
|
23.0
|
44.1
|
28.3
|
22.3
|
|
Annual change
|
Rate
|
-2.59
|
-3.34
|
–
|
-3.32
|
-3.21
|
-0.83
|
–
|
4.62
|
-1.36
|
-0.81
|
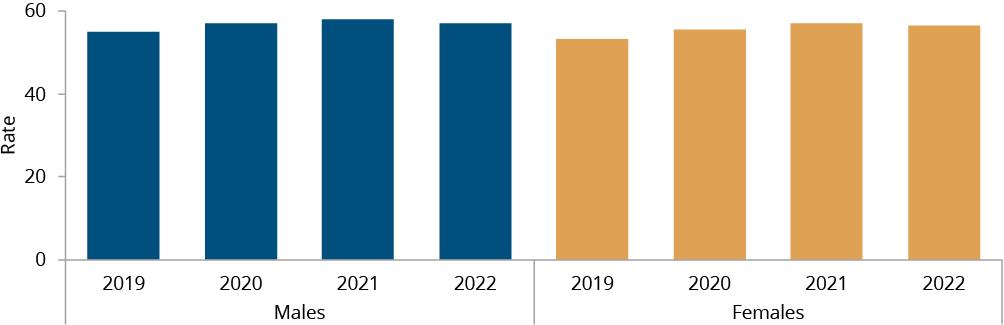
Figure C.30 – Rate of Aboriginal and Torres Strait Islander young people in detention on an average day, per 10,000 young people in the community
by sex, by year
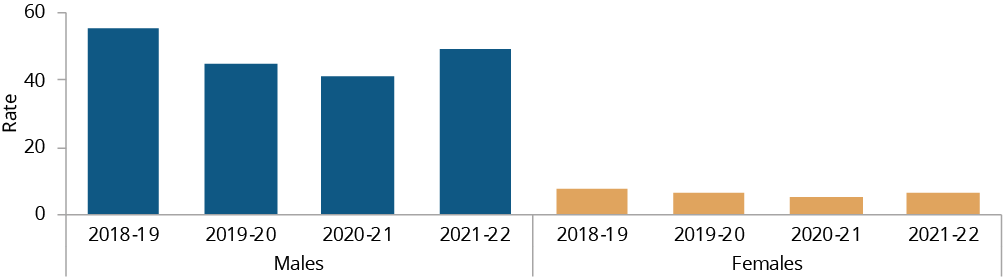
Source: table CtG11A.2, Derived from AIHW Youth justice in Australia, ABS Estimates and Projections.
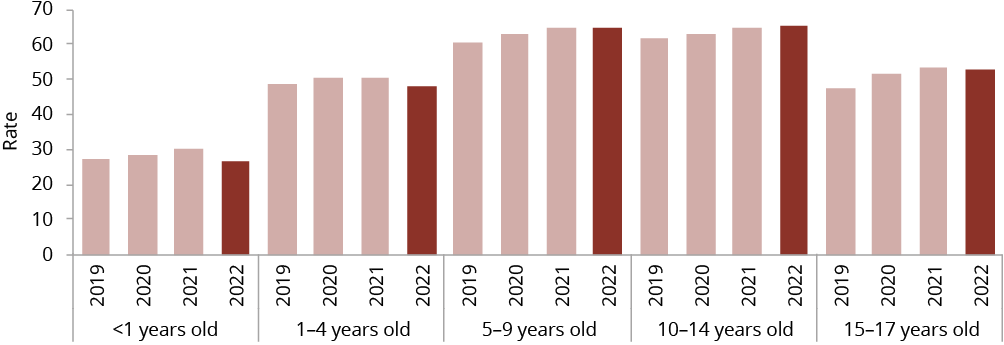
Figure C.31 – Rate of Aboriginal and Torres Strait Islander young people in detention on an average day, per 10,000 young people in the community
by age group, by year
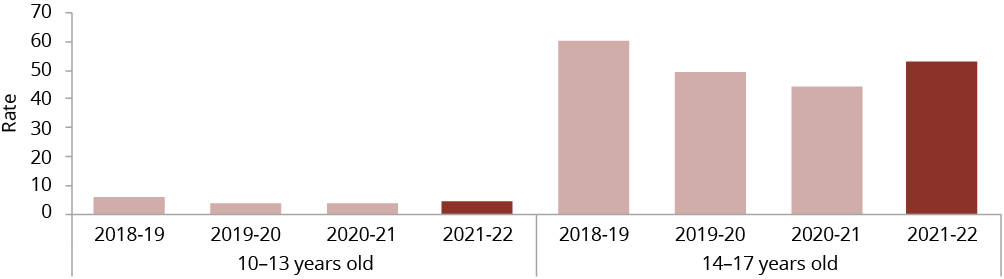
Source: table CtG11A.3, Derived from AIHW Youth justice in Australia, ABS (unpublished) Estimates and Projections Aboriginal and Torres Strait Islander Australians.
Rates of Aboriginal and Torres Strait Islander youth in detention is higher for males than females (a ratio of around 8:1), and higher for 14–17 year olds than 10–13 year olds (a ratio of around 12:1). Rates by age and sex have moved in similar patterns over the four years of available data.
Supporting indicators for SEO 11
The supporting indicator currently reported for this outcome area is the proportion of young alleged offenders involved in police proceedings.
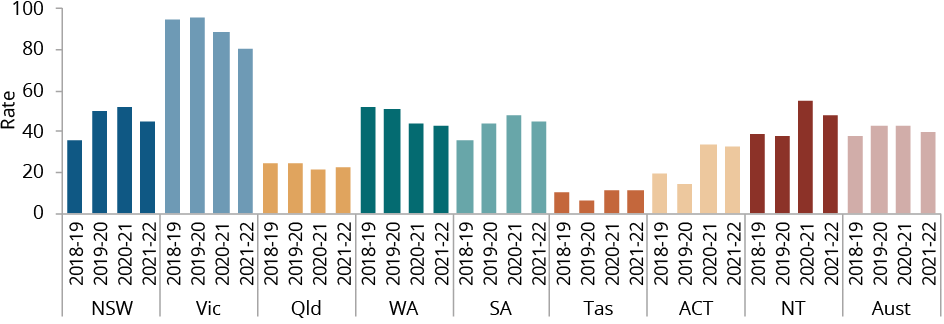
In 2021-22, across the five jurisdictions with available data, the rates of Aboriginal and Torres Strait Islander young people proceeded against by police ranged from 374.4 to 779.6 per 10,000. Since 2018-19, the direction of change for these rates has differed across jurisdictions. For young people proceeded against by police in these five jurisdictions there has been an increase for all in the proportion proceeded against three or more times. The data on the method of proceeding is only available for three jurisdictions, with the data showing the proportion proceeding to court ranging from around 50% (in New South Wales) to 70–80% (in Queensland and the Australian Capital Territory).
Figure C.32 – Aboriginal and Torres Strait Islander young people proceeded against by police, rate per 10 000 young people (10–17 years)
by jurisdiction, by year
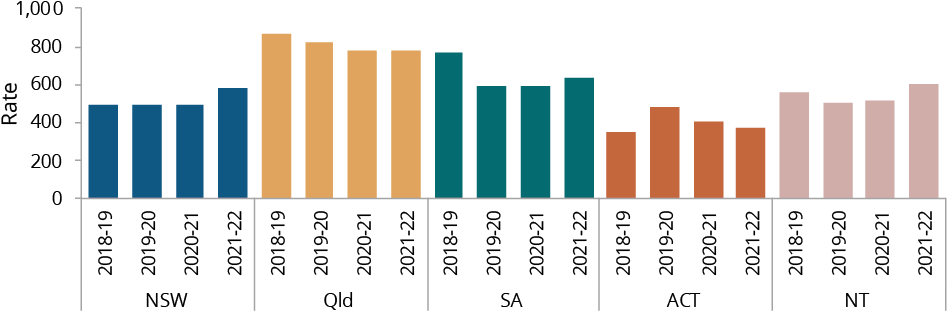
Source: table SE11c.1, Derived from ABS (unpublished) Recorded Crime – Offenders; ABS Estimates and Projections Aboriginal and Torres Strait Islander Australians.
Figure C.33 – Proceedings by police against Aboriginal and Torres Strait Islander young people, aged 10–17 years
by jurisdiction, by year, by method of proceedings
Source: table SE11c.4, ABS (unpublished) Recorded Crime – Offenders.
Dashboard snapshot
Data for download
Socio-economic outcome area 12
Aboriginal and Torres Strait Islander children are not overrepresented in the child protection system
Nationally, at 30 June 2022, the rate of Aboriginal and Torres Strait Islander children aged 0–17 years in out-of-home care was 56.8 per 1,000 children in the population. This in an increase from 54.2 per 1,000 children in 2019 (the baseline year). Nationally, the target is worsening (noting this assessment should be used with caution as it is based on a limited number of data points). The average annual change was an increase of 0.91 per 1,000 children, with an average annual decrease of 2.03 per 1,000 children required to meet the target.
|
Target 12
|
Unit
|
NSW
|
Vic
|
Qld
|
WA
|
SA
|
Tas
|
ACT
|
NT
|
Aust
|
National Target
|
|
Progress
|
Level
|
Improvement
|
Worsening
|
Worsening
|
Improvement
|
Worsening
|
Worsening
|
No change (state level)
|
Improvement
|
Worsening
|
|
|
Baseline
|
Rate
|
60.2
|
89.9
|
37.0
|
64.2
|
75.3
|
32.7
|
68.5
|
36.6
|
54.2
|
29.8
|
|
Current year
|
Rate
|
57.3
|
102.2
|
45.0
|
61.6
|
92.7
|
33.2
|
70.8
|
31.1
|
56.8
|
29.8
|
|
Annual change
|
Rate
|
-0.81
|
4.02
|
2.70
|
-1.01
|
5.74
|
0.27
|
–
|
-1.78
|
0.91
|
-2.03
|
Nationally, at 30 June 2022, the rate of Aboriginal and Torres Strait Islander children in out-of-home care was similar for males and females. Rates were higher for children aged 5–14 years, and in the most recent reporting period had continued to increase for those aged 10–14 years (decreases were reported for children in other age groups). Around one in five Aboriginal and Torres Strait Islander children in out-of-home care had a reported disability. However, this proportion needs to be considered with caution as an even higher proportion of children had an unknown disability status reported.
Figure C.34 – Rate of Aboriginal and Torres Strait Islander children, aged 0–17 years, in out-of-home care, per 1,000 children in the community
by sex, by year as at 30 June
Source: table CtG12A.2, Derived from AIHW (unpublished) Child protection Australia; ABS (unpublished) Estimates and Projections Aboriginal and Torres Strait Islander Australia.
Figure C.35 – Rate of Aboriginal and Torres Strait Islander children, aged 0–17 years, in out-of-home care, per 1,000 children in the community
by age group, by year as at 30 June
Source: table CtG12A.3, Derived from AIHW (unpublished) Child protection Australia; ABS (unpublished) Estimates and Projections Aboriginal and Torres Strait Islander Australians.
Supporting indicators for SEO 12
The supporting indicators currently reported for this outcome area are the proportion of children in out-of-home care who are Aboriginal and Torres Strait Islander children and the proportion of children who were the subject of substantiated abuse by type of abuse.
Nationally at 30 June 2022, 42.8% of children aged 0–17 years in out-of-home care were Aboriginal and Torres Strait Islander. In comparison, the proportion of children aged 0–17 years in the general population who were Aboriginal and Torres Strait Islander was 6.0%.
Nationally in 2021-22, 39.8 per 1,000 Aboriginal and Torres Strait Islander children aged 0–17 years were the subject of substantiated abuse. Emotional abuse was the most common type of abuse substantiated, and the only type to increase from 2018-19. All other types (physical and sexual abuse and neglect) recorded decreases.
Figure C.36 – Rate of Aboriginal and Torres Strait Islander children that were the subject of substantiated child protection notifications, per 1,000 children in the community
by jurisdiction, by year
Source: table SE12m.1, Derived from state and territory governments (unpublished); AIHW (unpublished) Child Protection National Minimum Data Set; ABS Estimates and Projections Aboriginal and Torres Strait Islander Australians.
Dashboard snapshot
Data for download
Socio-economic outcome area 13
Aboriginal and Torres Strait Islander families and households are safe
Nationally in 2018-19, 8.4% of Aboriginal and Torres Strait Islander females aged 15 years or over experienced domestic physical or threatened physical harm. There is no new data available since 2018-19 (the baseline year), and therefore an assessment of progress is not available.
|
Target 13
|
Unit
|
NSW
|
Vic
|
Qld
|
WA
|
SA
|
Tas
|
ACT
|
NT
|
Aust
|
National Target
|
|
Progress
|
|
No assessment
|
No assessment
|
No assessment
|
No assessment
|
No assessment
|
No assessment
|
No assessment
|
No assessment
|
No assessment
|
No assessment
|
|
Baseline
|
%
|
10.0
|
7.5
|
6.4
|
9.0
|
7.2
|
8.3
|
7.4
|
7.5
|
8.4
|
4.2
|
There are currently no disaggregations reported for this target.
Supporting indicators for SEO 13
The supporting indicators currently reported for this outcome area are the proportion of Aboriginal and Torres Strait Islander women reporting family violence is common in their communities, and the rates of family violence before entry to out-of-home care. But, there is no nationally representative data available for reporting on either of these indicators.
There is contextual data provided for the first of these indicators, which was sourced from the 2017 National Community Attitudes towards Violence Against Women Survey. However, the number of Aboriginal and Torres Strait Islander women who were surveyed was too small to draw conclusions at the national level from responses. Of the 48 Aboriginal and Torres Strait Islander women who were asked whether they thought violence against women is ‘common in our community’, 45 reported it is common.
Dashboard snapshot
Data for download
Socio-economic outcome area 14
Aboriginal and Torres Strait Islander people enjoy high levels of social and emotional wellbeing
In 2021, the age-standardised suicide rate for Aboriginal and Torres Strait Islander people was 27.1 per 100,000 people (for NSW, Qld, WA, SA and the NT combined). This is an increase from 25.1 per 100,000 people in 2018 (the baseline year). There is no specified trajectory or expected timeline for achieving zero suicide. A target of a 75% reduction in the suicide rate is presented here.
Nationally, the age-standardised suicide rate is worsening (noting this assessment should be used with caution as it is based on a limited number of data points). There is no assessment of progress at the state and territory level as these rates are reported in five-year aggregates.
|
Target 14
|
Unit
|
NSW
|
Vic
|
Qld
|
WA
|
SA
|
Tas
|
ACT
|
NT
|
Aust
|
National Target
|
|
Progress
|
Level
|
No assessment
|
No assessment
|
No assessment
|
No assessment
|
No assessment
|
No assessment
|
No assessment
|
No assessment
|
Worsening
|
|
|
Baseline
|
Rate (AS)
|
No assessment
|
No assessment
|
No assessment
|
No assessment
|
No assessment
|
No assessment
|
No assessment
|
No assessment
|
25.1
|
6.3
(-75% shown)
|
|
Current year
|
Rate (AS)
|
No assessment
|
No assessment
|
No assessment
|
No assessment
|
No assessment
|
No assessment
|
No assessment
|
No assessment
|
27.1
|
6.3
(-75% shown)
|
|
Annual change
|
Rate (AS)
|
No assessment
|
No assessment
|
No assessment
|
No assessment
|
No assessment
|
No assessment
|
No assessment
|
No assessment
|
0.64
|
-1.45
|
Across states and territories, the rates have increased over time for two jurisdictions, with the rates fluctuating for three jurisdictions. The rates were highest for Aboriginal and Torres Strait Islander people aged 18–44 years and those living in remote and very remote areas. Over time, the rate for males has remained more than double the rate for females.
Figure C.37 – Age-standardised mortality rates due to suicide, per 100,000 Aboriginal and Torres Strait Islander people
by jurisdiction, by year
Source: table CtG14A.2, ABS Causes of Death Australia. AS = Age Standardised
Figure C.38 – Mortality rates due to suicide, per 100,000 Aboriginal and Torres Strait Islander people, total (NSW, Qld, WA, SA and the NT combined)
by age group, by year
Source: table CtG14A.3, ABS Causes of Death Australia.
Supporting indicators for SEO 14
The supporting indicators currently reported for this outcome area are the proportion of Aboriginal and Torres Strait Islander people who reported experiencing psychological distress and the proportion who reported experiencing one or more barriers accessing health services.
Nationally in 2018-19, almost one-third of Aboriginal and Torres Strait Islander people aged 18 years or over reported having high/very high levels of psychological distress. During the same period, one in eight Aboriginal and Torres Strait Islander people (12.5%) reported not seeing a GP or clinic doctor on at least one occasion when needed in the previous 12 months. One of the most common reasons for not seeing a GP was being too busy, followed by time and physical accessibility.
Figure C.39 – Proportion of Aboriginal and Torres Strait Islander people, aged 18 years or over, with high/very high levels of psychological distress, 2018-19
by jurisdiction
Source: table SE14d.1, ABS (unpublished) National Aboriginal and Torres Strait Islander Health Survey Australia. Error bars represent 95% confidence intervals.
Dashboard snapshot
Data for download
Socio-economic outcome area 15
Aboriginal and Torres Strait Islander people maintain a distinctive cultural, spiritual, physical and economic relationship with their land and waters
As at 30 June 2022, 4,138,356 km2 of the land mass of Australia and 91,111 km2 of the sea country of Australia were subject to Aboriginal and Torres Strait Islander people’s rights or interests.
Nationally, the land mass target shows good improvement since 2020 (the baseline year) and is on track to be met, while the sea country target shows improvement since 2020 but is not on track to be met (noting these assessments should be used with caution as they are based on a limited number of data points). The average annual change in land mass is 114,984.5 km2, which is almost twice what is required to meet the target (59,004). The average annual change for sea country is 429.5 km2, which is around one-third of what is required to meet the target (1,354).
|
Target 15
|
Unit
|
NSW
|
Vic
|
Qld
|
WA
|
SA
|
Tas
|
ACT
|
NT
|
Aust
|
National Target
|
|
Progress
|
Level
|
Improvement
|
Improvement
|
Improvement
|
Improvement
|
Improvement
|
No change (state level)
|
No change (state level)
|
Improvement
|
Good improvement and on track
|
|
|
Baseline
|
sq km
|
6,382
|
14,934
|
530,144
|
1,659,351
|
752,905
|
631
|
–
|
943,999
|
3,908,387
|
4,498,431
|
|
Current year
|
sq km
|
6,443
|
14,942
|
570,423
|
1,800,999
|
753,612
|
631
|
–
|
991,306
|
4,138,356
|
4,498,431
|
|
Annual change
|
sq km
|
30.50
|
4.00
|
20,139.50
|
70,824.00
|
353.50
|
–
|
–
|
23,653.50
|
114,984.50
|
59,004.00
|
|
Progress
|
Level
|
No change (state level)
|
Improvement
|
Improvement
|
Improvement
|
Improvement
|
No change (state level)
|
No assessment
|
Improvement
|
Improvement but not on track (National)
|
|
|
Baseline
|
sq km
|
20
|
265
|
24,108
|
40,076
|
373
|
–
|
No assessment
|
3,249
|
90,252
|
103,790
|
|
Current year
|
sq km
|
20
|
267
|
24,829
|
40,147
|
437
|
–
|
No assessment
|
3,250
|
91,111
|
103,790
|
|
Annual change
|
sq km
|
–
|
1.00
|
360.50
|
35.50
|
32.00
|
–
|
No assessment
|
0.50
|
429.50
|
1,354.00
|
Disaggregations are not specified in the Agreement for this target other than by state and territory.
Supporting indicators for SEO 15
The supporting indicator currently reported for this outcome area is Aboriginal and Torres Strait Islander people’s owned land and water titles.
Nationally as at June 2022, 16.1% of Australia’s land area was owned or controlled by Aboriginal and Torres Strait Islander people, which is unchanged from the previous two years. Reporting for the proportion of water owned or controlled by Aboriginal and Torres Strait Islander people is currently under development.
Figure C.40 – Proportion of land subject to Aboriginal and Torres Strait Islander people’s rights and interests
by jurisdiction, by year as at 30 June
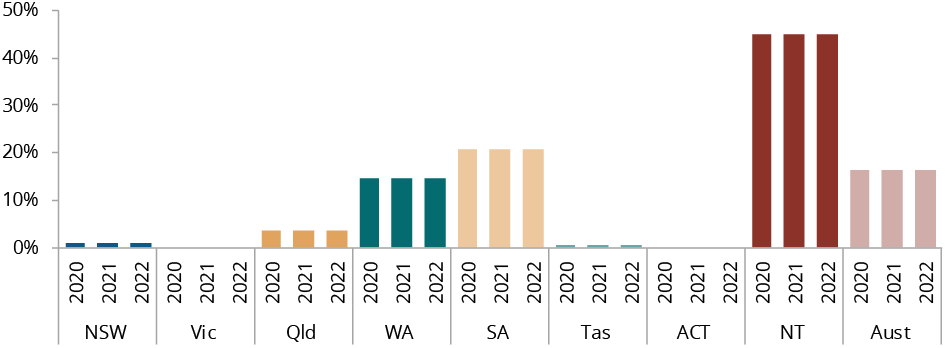
Source: table SE15a.1, Indigenous Land and Sea Corporation (unpublished).
Dashboard snapshot
Data for download
Socio-economic outcome area 16
Aboriginal and Torres Strait Islander cultures and languages are strong, supported and flourishing
Nationally in 2018-19, there were 123 Aboriginal and Torres Strait Islander languages being spoken with 14 considered strong. There is no new data since 2018-19 (the baseline year), and therefore an assessment of progress is not available.
|
Target 16
|
Unit
|
NSW
|
Vic
|
Qld
|
WA
|
SA
|
Tas
|
ACT
|
NT
|
Aust
|
National Target
|
|
Progress
|
|
No assessment
|
No assessment
|
No assessment
|
No assessment
|
No assessment
|
No assessment
|
No assessment
|
No assessment
|
No assessment
|
|
|
Baseline
|
No.
|
13
|
4
|
26
|
31
|
16
|
4
|
1
|
35
|
123
|
A sustained increase
|
There are currently no disaggregations reported for this target.
Supporting indicators for SEO 16
The supporting indicators currently reported for this outcome area are the number and age profile of the speakers of Aboriginal and Torres Strait Islander languages and the number of Aboriginal and Torres Strait Islander people accessing Commonwealth-funded Indigenous Language Centres to maintain and preserve languages.
Nationally in 2018-19, of the 141 Aboriginal and Torres Strait Islander languages for which there was data available, 60 languages reported having no speakers aged 0–19 years. For people aged 60 years and over, 18 languages reported as having no speakers. From 2016 to 2021, the number of people who spoke an Aboriginal or Torres Strait Islander language at home increased by 20.7%, with increases across all age groups.
Figure C.41 – Number of Aboriginal and Torres Strait Islander languages being spoken, 2018-19
by estimated number of speakers
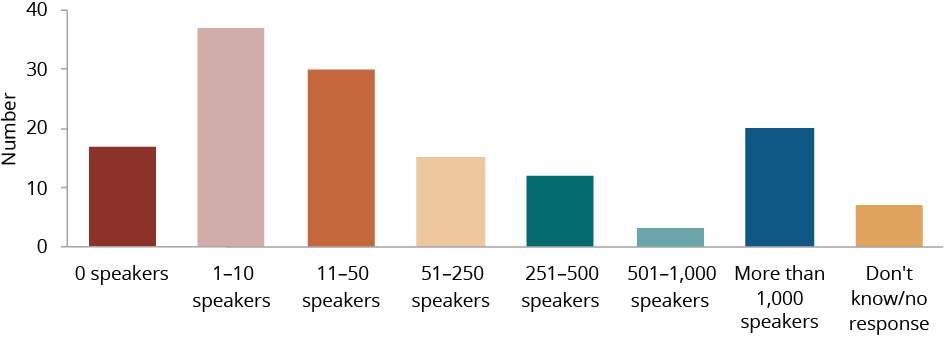
Source: table SE16c.1, Australian Institute of Aboriginal and Torres Strait Islander Studies National Indigenous Languages Survey.
Figure C.42 – Number of Aboriginal and Torres Strait Islander people who used an Aboriginal or Torres Strait Islander language at home
by year, by age group
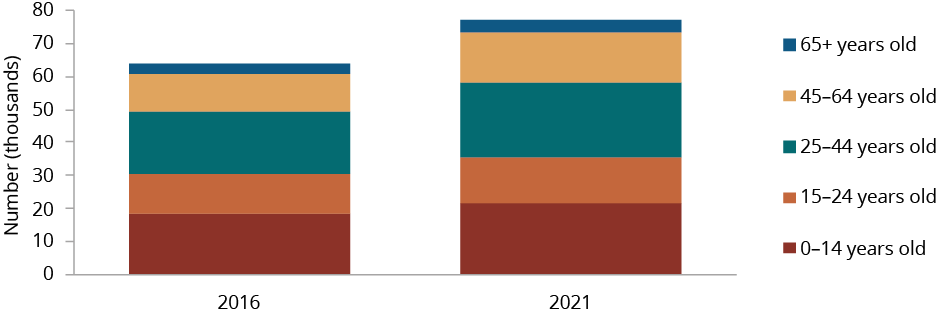
Source: table SE16c.2–SE16c.3, ABS (unpublished) Census of Population and Housing.
Nationally, as at 30 June 2022, there were 23 Commonwealth-funded Indigenous Language Centres, of which 22 were Aboriginal and Torres Strait Islander community-controlled. In 2021-22, 28,663 activities were accessed at these Centres.
Dashboard snapshot
Data for download
Socio-economic outcome area 17
Aboriginal and Torres Strait Islander people have access to information and services enabling participation in informed decision-making regarding their own lives
Nationally in 2014-15, 73.5% of Aboriginal and Torres Strait Islander people aged 15 years or over accessed the internet in their homes. There is no comparable data for non-Indigenous people. This means that estimating a trajectory to achieve parity is not currently possible. Also, there is no new data since 2014-15 (the baseline year). As a result, an assessment of progress is not available.
|
Target 17
|
Unit
|
NSW
|
Vic
|
Qld
|
WA
|
SA
|
Tas
|
ACT
|
NT
|
Aust
|
National Target
|
|
Progress
|
|
No assessment
|
No assessment
|
No assessment
|
No assessment
|
No assessment
|
No assessment
|
No assessment
|
No assessment
|
No assessment
|
No assessment
|
|
Baseline
|
%
|
79.9
|
89.5
|
76.1
|
66.0
|
73.4
|
85.0
|
91.1
|
40.9
|
73.5
|
Equal levels
|
There are currently no disaggregations reported for this target.
Supporting indicators for SEO 17
The supporting indicators currently reported for this outcome area are the proportion of Aboriginal and Torres Strait Islander people using the internet to access government services for private purposes, and the number and location of community broadcast licenses with an Indigenous interest.
Nationally in 2014-15, almost half of all Aboriginal and Torres Strait Islander people aged 15 years or older used the internet to access government information or services for private purposes (48.8%).
Figure C.43 – Number of community radio broadcasting licences with an Aboriginal and Torres Strait Islander interest
by temporary and long-term licence, by year as at June 30
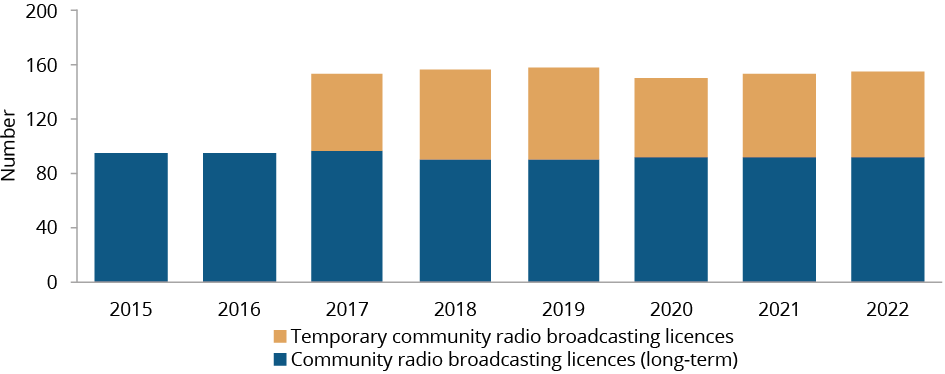
Source: table SE17g.1, Australian Communications and Media Authority (unpublished).
Nationally at 30 June 2022, there were 155 community broadcasting licences with an Aboriginal and Torres Strait Islander interest, of which 92 were long-term community radio broadcasting licences, and 63 were temporary community radio broadcasting licences.
Dashboard snapshot
Data for download
2023 Report