Target 6
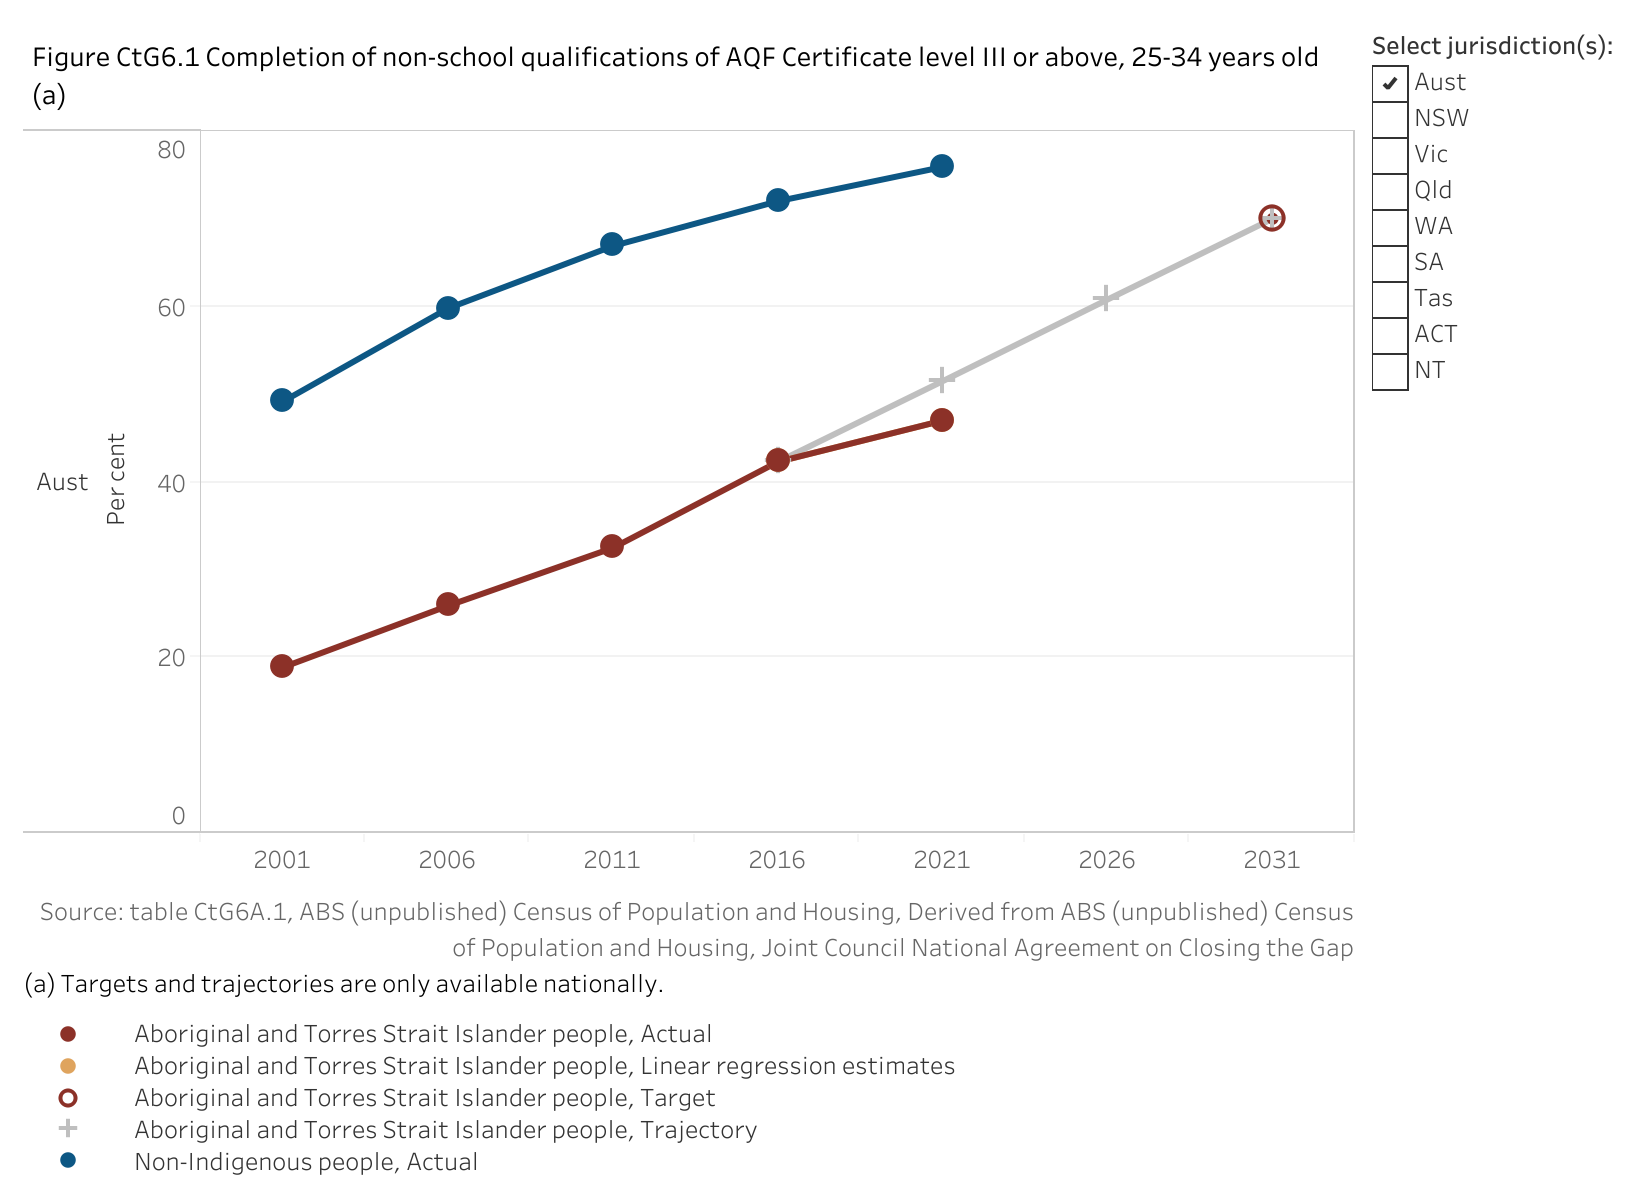
By 2031, increase the proportion of Aboriginal and Torres Strait Islander people aged 25-34 years who have completed a tertiary qualification (Certificate III and above) to 70 per cent.
Dashboard snapshot: The data below are the most recent at the time of preparing the July 2023 report. Please go to the dashboard to access the current data.
Nationally in 2021, 47.0 per cent of Aboriginal and Torres Strait Islander people aged 25–34 years had completed non-school qualifications of Certificate III or above (figure CtG6.1).
This is an increase from 42.3 per cent in 2016 (the baseline year).
Nationally, based on progress from the baseline, the target shows improvement but is not on track to be met. However, this assessment should be used with caution as it is based on a limited number of data points. Please see the How to interpret the data page for more information.
The assessment below reflects progress from the baseline (improvement, worsening or no change). For the national assessment, the target outcome shows improvement but is not on track to be met.
| NSW | Vic | Qld | WA | SA | Tas | ACT | NT | Aust | |
|---|---|---|---|---|---|---|---|---|---|
| Assessment of progress 2016 to 2021 |  | | | | | | | |  |
improvement  no change
  worsening not applicable as required data not available.
  good improvement and target on track to be met. improvement but target not on track to be met.
Note: These assessments of progress should be used with caution as they are based on a limited number of data points.
Disaggregations
By sex
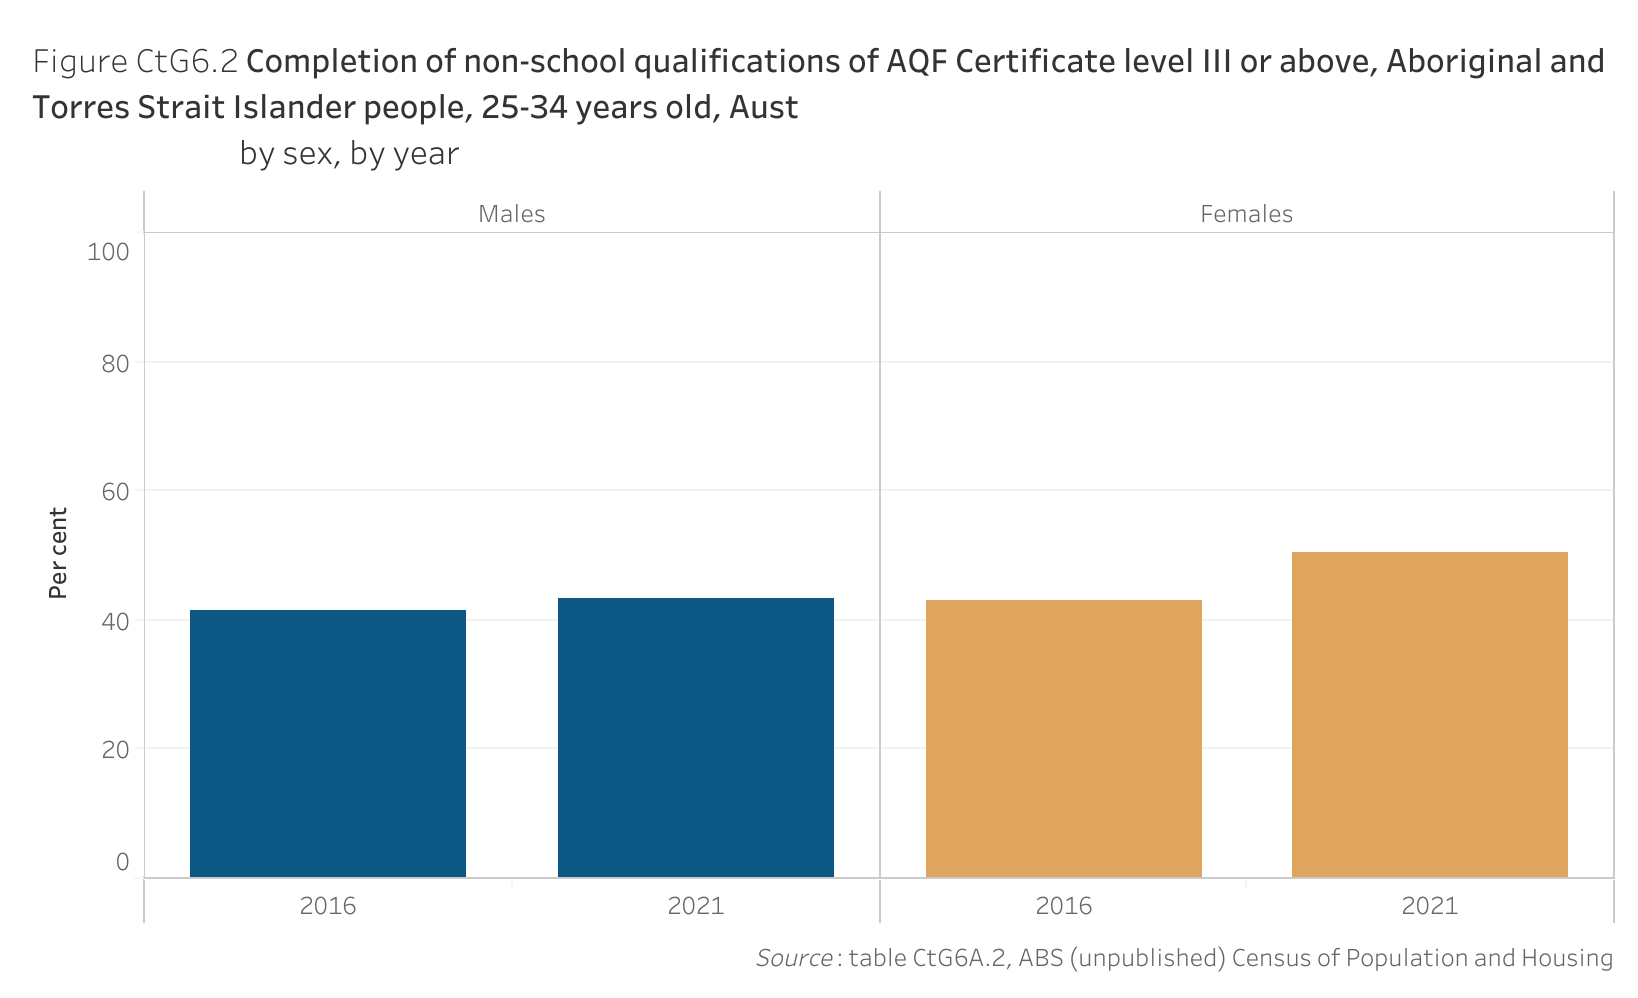
Nationally in 2021, a higher proportion of Aboriginal and Torres Strait Islander females aged 25–34 years had obtained a non-school qualification at Certificate III or above (50.6 per cent) compared to males (43.3 per cent) (figure CtG6.2). The proportions increased by around 8 percentage points for females and 2 percentage points for males since the 2016 baseline year.
| Sex | 2016 | 2021 |
|---|---|---|
| Males | 41.6 | 43.3 |
| Females | 43.0 | 50.6 |
By remoteness area
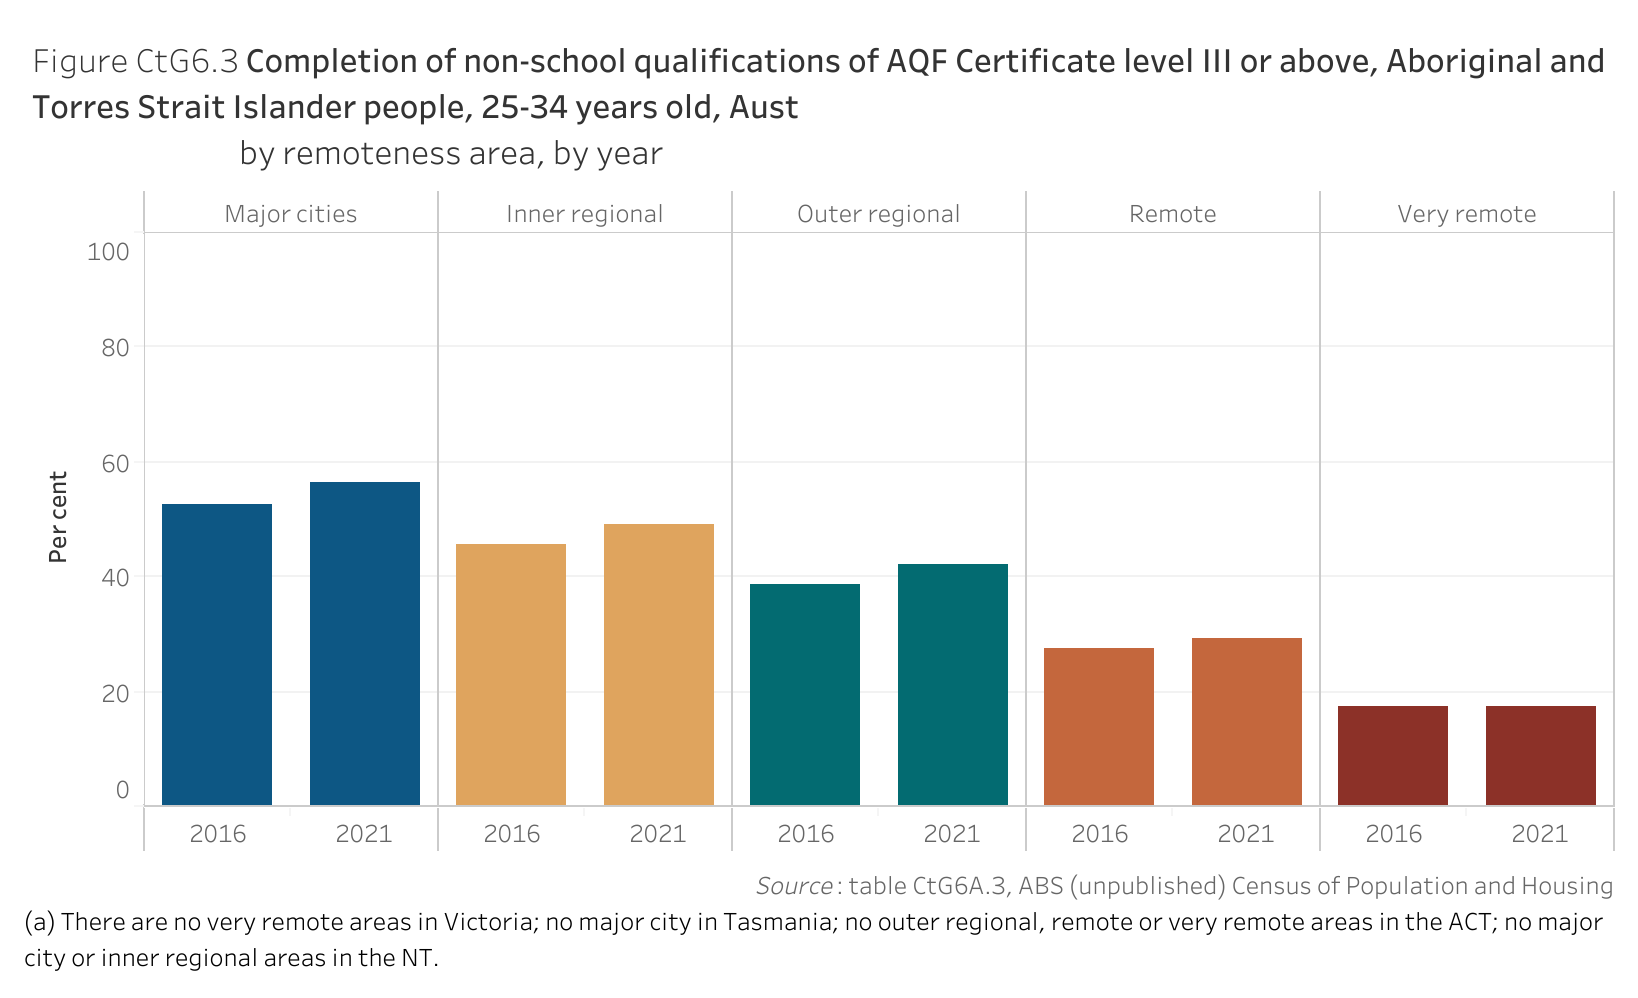
Nationally in 2021, the proportion of Aboriginal and Torres Strait Islander people aged 25–34 years who have obtained a non-school qualification at Certificate III or above was highest in major cities (56.6 per cent) (figure CtG6.3). The proportions declined as remoteness increased, down to 17.4 per cent for people living in very remote areas. The proportions have increased in all remoteness areas since the 2016 baseline year, other than for people living in very remote areas (where the proportion declined from 17.5 per cent in 2016 to 17.4 per cent in 2021).
| Remoteness | 2016 | 2021 |
|---|---|---|
| Major cities | 52.5 | 56.6 |
| Inner regional | 45.6 | 49.1 |
| Outer regional | 38.6 | 42.0 |
| Remote | 27.6 | 29.1 |
| Very remote | 17.5 | 17.4 |
By Index of Relative Socioeconomic Disadvantage (IRSD) quintile
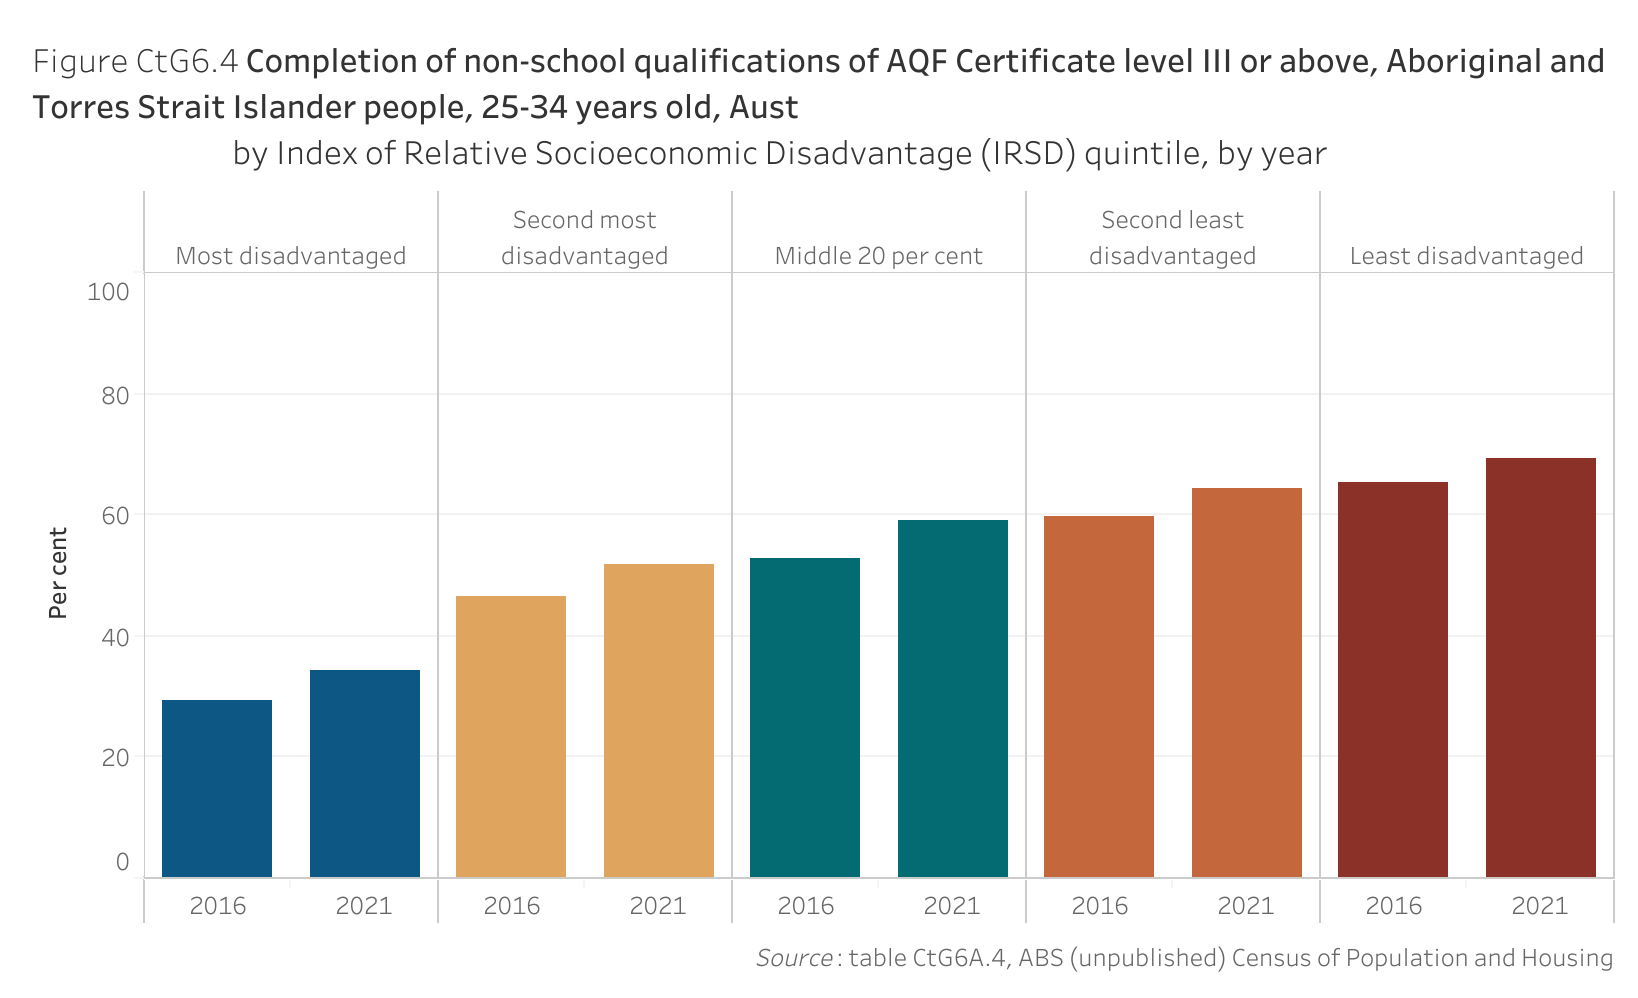
Nationally in 2021, the proportion of Aboriginal and Torres Strait Islander people aged 25–34 years who have obtained a non-school qualification at Certificate III or above was highest in the least disadvantaged socioeconomic areas of Australia (69.4 per cent) (figure CtG6.4). The proportions declined in more disadvantaged areas, down to 34.4 per cent for people living in the most disadvantaged socioeconomic areas of Australia. The proportions have increased in all socioeconomic areas since the 2016 baseline year.
| Description6 | 2016 | 2021 |
|---|---|---|
| Most disadvantaged | 29.4 | 34.4 |
| Second most disadvantaged | 46.6 | 51.9 |
| Middle 20 per cent | 52.8 | 59.0 |
| Second least disadvantaged | 59.6 | 64.3 |
| Least disadvantaged | 65.3 | 69.4 |
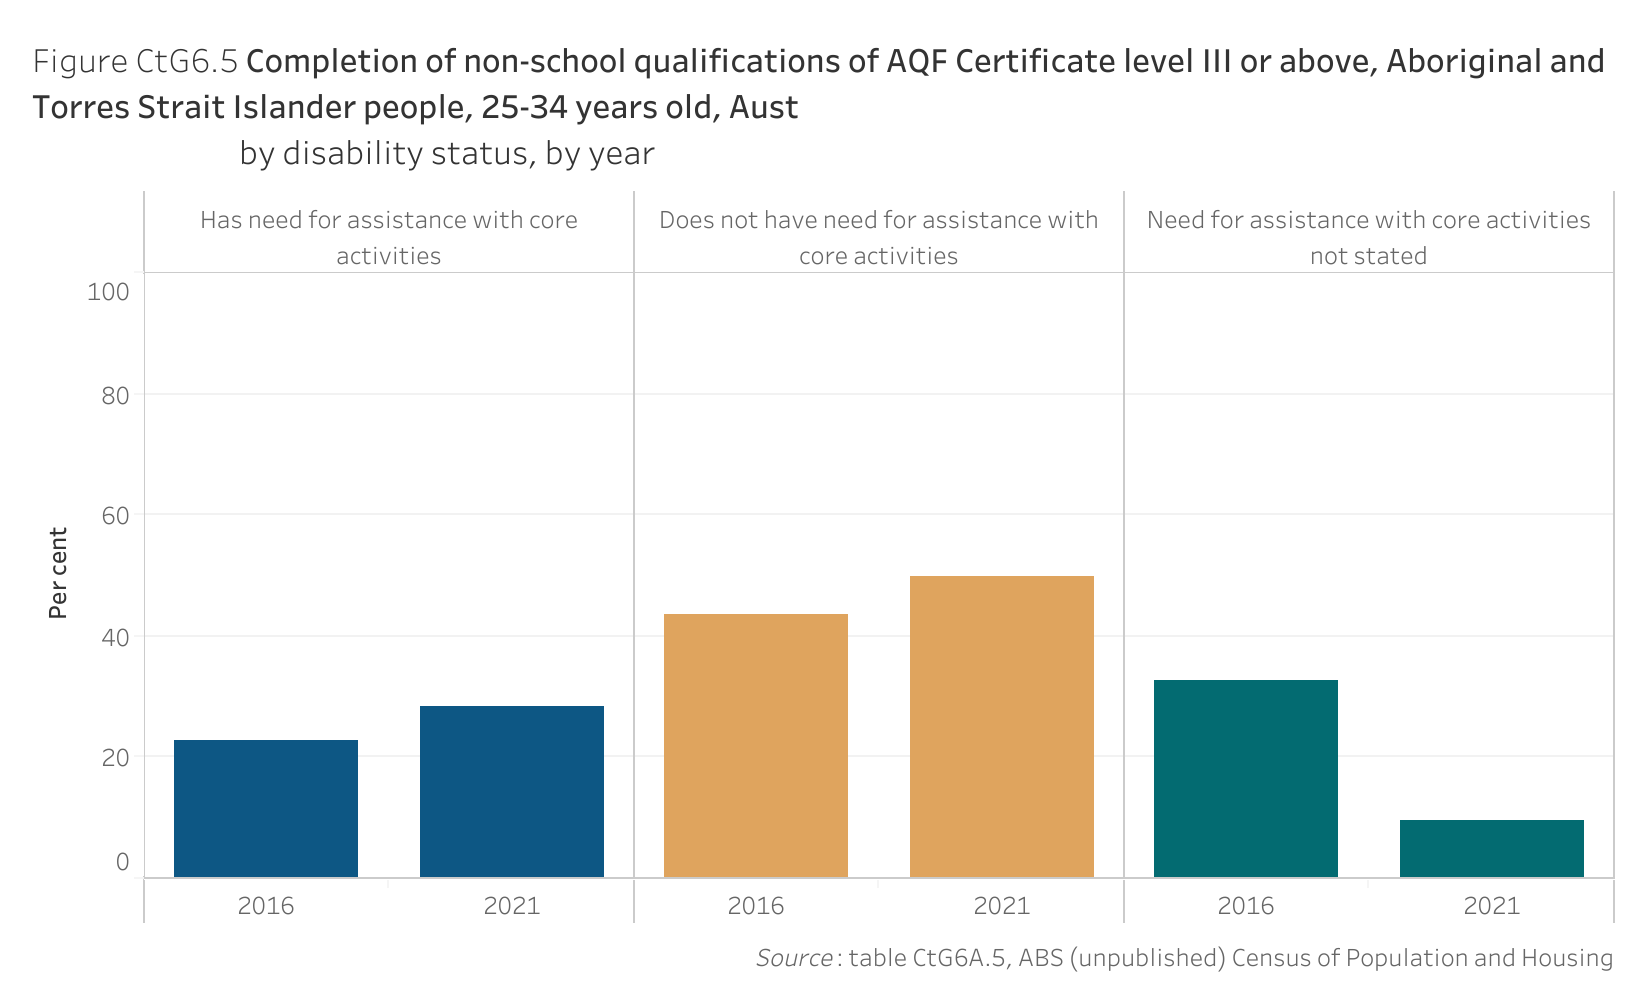
By disability status
Nationally in 2021, a lower proportion of Aboriginal and Torres Strait Islander people aged 25–34 years with a need for assistance with core activities had obtained a non-school qualification at Certificate III or above (28.5 per cent) compared to persons who do not have a need for assistance (49.8 per cent) (figure CtG6.5). The proportions increased by around 6 percentage points for both groups since the 2016 baseline year.
| Description6 | 2016 | 2021 |
|---|---|---|
| Has need for assistance with core activities | 22.7 | 28.5 |
| Does not have need for assistance with core activities | 43.4 | 49.8 |
| Need for assistance with core activities not stated | 32.6 | 9.6 |
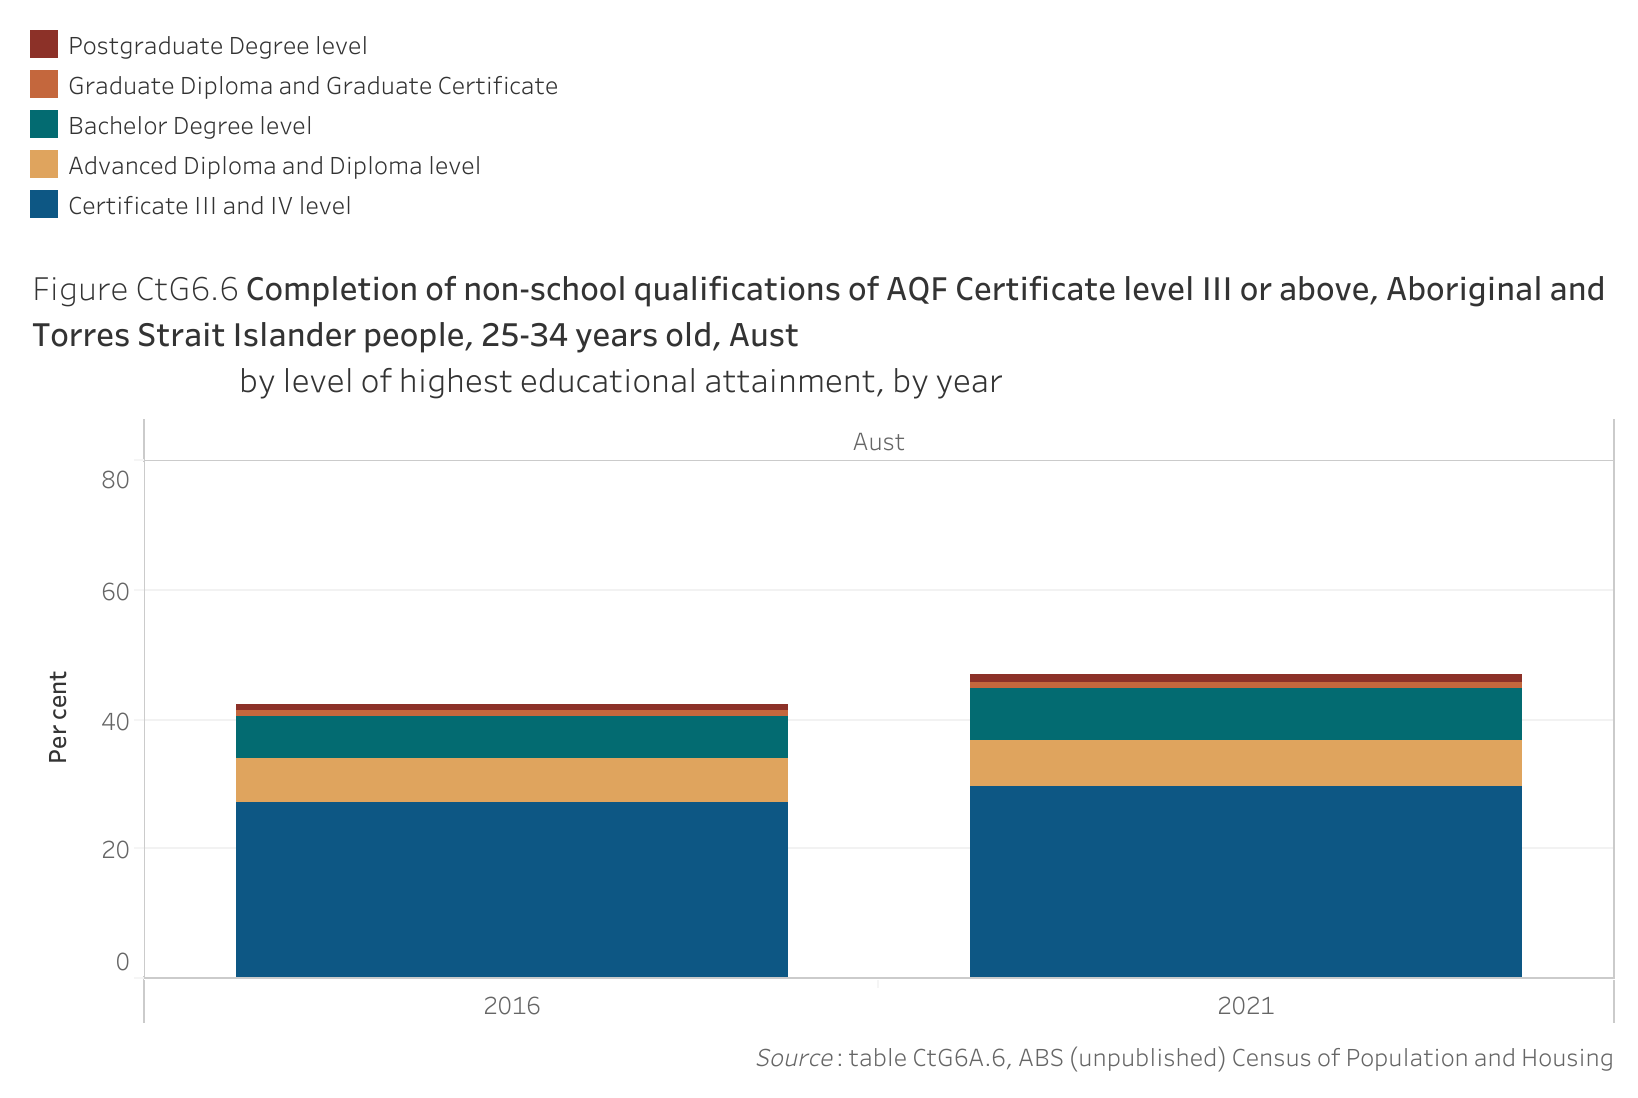
By highest qualification achieved
Nationally in 2021, the proportion of Aboriginal and Torres Strait Islander people aged 25–34 years who had completed a tertiary qualification (Certificate III or above) was mainly driven by people who had completed a Certificate III or IV qualification (29.5 per cent, an increase of around 2 percentage points since the 2016 baseline); compared to 7.4 per cent of people who had completed an Advanced Diploma and Diploma (an increase of around 1 percentage point since the 2016 baseline); and 7.8 per cent of people who had completed Bachelor degree (an increase of around 1 percentage point since the 2016 baseline). A little over one per cent had completed a Graduate Diploma and Graduate Certificate and 1.3 per cent had completed a Postgraduate degree (figure CtG6.6).
| Description6 | 2016 | 2021 |
|---|---|---|
| Postgraduate Degree level | 0.9 | 1.3 |
| Graduate Diploma and Graduate Certificate | 0.8 | 1.1 |
| Bachelor Degree level | 6.5 | 7.8 |
| Advanced Diploma and Diploma level | 6.9 | 7.4 |
| Certificate III and IV level | 27.2 | 29.5 |
Target data specifications
Outcome: | Aboriginal and Torres Strait Islander students reach their full potential through further education pathways. |
|---|---|
Target: | By 2031, increase the proportion of Aboriginal and Torres Strait Islander people aged 25-34 years who have completed a tertiary qualification (Certificate level III and above) to 70 per cent. |
Indicator: | The proportion of Aboriginal and Torres Strait Islander people aged 25-34 years old who have completed qualifications at Certificate level III or above. |
Measure: | The measure is defined as: Numerator — number of Aboriginal and Torres Strait Islander people aged 25-34 years old who have completed non-school qualifications at Certificate level III or above based on the Australian Qualifications Framework (AQF). Denominator — total number of Aboriginal and Torres Strait Islander people in the population aged 25-34 years old. and is presented as a percentage. |
Target established: | National Agreement on Closing the Gap July 2020 |
Latest dashboard update: | 15 June 2023 |
Indicator type: | Target |
Interpretation of change: | A high or increasing proportion is desirable. An increase from the previous year or the baseline year is an improvement. |
Data source: | Name: ABS Census of Population and Housing Frequency: Five-yearly Documentation (links): www.abs.gov.au/census |
Data provider: | Provider name: Australian Bureau of Statistics (ABS) Provider area: Census |
Baseline year: | 2016 |
Latest reporting period | 2021 |
Target year: | 2031 |
Disaggregations: | State and territory and Australia, by Indigenous status State and territory and Australia, by Indigenous status, by sex State and territory and Australia, by Indigenous status, by remoteness areas State and territory and Australia, by Indigenous status, by Index of Relative Socioeconomic Disadvantage (IRSD) quintile State and territory and Australia, by Indigenous status, by disability status State and territory and Australia, by Indigenous status, by highest qualification achieved. |
Computation: | Numerator divided by Denominator multiplied by 100 Counting rules Data are for all Australian residents enumerated in the Census that reported having a usual residence in Australia. Geographical variables are based on a person's place of usual residence (on Census night). Includes (numerator)
Includes (numerator and denominator)
Excludes (both numerator and denominator)
Disaggregations: Sex refers to a person’s biological characteristics. The 2021 Census allowed all respondents to select from three response options for the sex question: male, female and non-binary sex. Where a respondent has provided a male or female response and a non-binary sex response, the male or female response was used to determine a binary sex variable. Otherwise, sex was derived by a statistical process using random allocation.). Remoteness area is classified according to the ABS Australian Statistical Geography Standard (ASGS) using SA1 as the building block. For people with incomplete/invalid or missing address information, the ABS imputes the place of usual residence (The non-response rate at the SA1 level was 4.4 per cent in 2021.) Remoteness area disaggregations exclude ‘Migratory – Offshore – Shipping’ and ‘No usual address’. Please see the How to interpret the data page for more information. Socioeconomic status of the locality is classified according to the ABS Socio-Economic Indexes for Areas (SEIFA): Index of Relative Socio-economic Disadvantage (IRSD), using SA1 as the building block. For people with incomplete/invalid or missing address information, the ABS will impute the place of usual residence. Data are reported by IRSD quintile that are determined at the Australian level and exclude persons with unknown or unavailable SEIFA score. Some individual geographic areas were excluded from SEIFA for various reasons, such as low population or high non-response to certain Census questions. Please see the How to interpret the data page for more information. Disability is classified according to core activity need for assistance. Data are only available for people with a profound or severe core activity limitation. Disability data sourced from the Census are based on four questions to identify need for assistance and may not be fully comparable with data from other sources. See www.abs.gov.au/ausstats/abs@.nsf/mf/4431.0.55.002 for more information. (Data for people whose ‘need for assistance with core activities’ was not stated is provided for context.) Highest qualification achieved describes the level of a person’s highest completed non-school qualification and is categorised according to the Australian Qualifications Framework (AQF). Extraction Census Table Builder (Basic) – Employment, Income and Education: INGP X AGEP X HEAP (QALLP X HSCP prior to 2016) X Main ASGS (UR) [Disaggregations: X SEX, X REMOTE (UR), X IRSD, X ASSNP, X HEAP] |
Data quality considerations: | All data values have been randomly adjusted using perturbation to avoid the release of confidential data. Proportions/rates calculated for small populations should be used with caution. |
Supporting indicators
Driver
- Higher education commencement, attrition, and completion rates
University component | Time series, cohort analyses - 4, 6 and 9 years
- Higher education application, offers and acceptance rates
By gender, SES and ATAR levels
- Cert III and above VET commencements, attrition and completion rates
Contextual information
- Field of Education for higher education and VET
- Higher education students’ views on outcomes, behaviours and satisfaction
- Destinations and satisfaction of higher education graduates
- VET graduate outcomes and satisfaction levels
- Progress towards parity
Material for download
- Students reach their full potential through further education pathways data tables (XLSX - 141 Kb)
- Students reach their full potential through further education pathways dataset (CSV - 335 Kb)
To assist with interpretation of the data provided (Excel data tables and CSV dataset) please refer to the target data specification above.