Target 8
By 2031, increase the proportion of Aboriginal and Torres Strait Islander people aged 25-64 who are employed to 62 per cent.
Dashboard snapshot: The data below are the most recent at the time of preparing the July 2023 report. Please go to the dashboard to access the current data.
Nationally in 2021, 55.7 per cent of Aboriginal and Torres Strait Islander people aged 25–64 years were employed (figure CtG8.1).
This is an increase from 51.0 per cent in 2016 (the baseline year).
Nationally, based on progress from the baseline, the target shows good improvement and is on track to be met. However, this assessment should be used with caution as it is based on a limited number of data points. Please see the How to interpret the data page for more information.
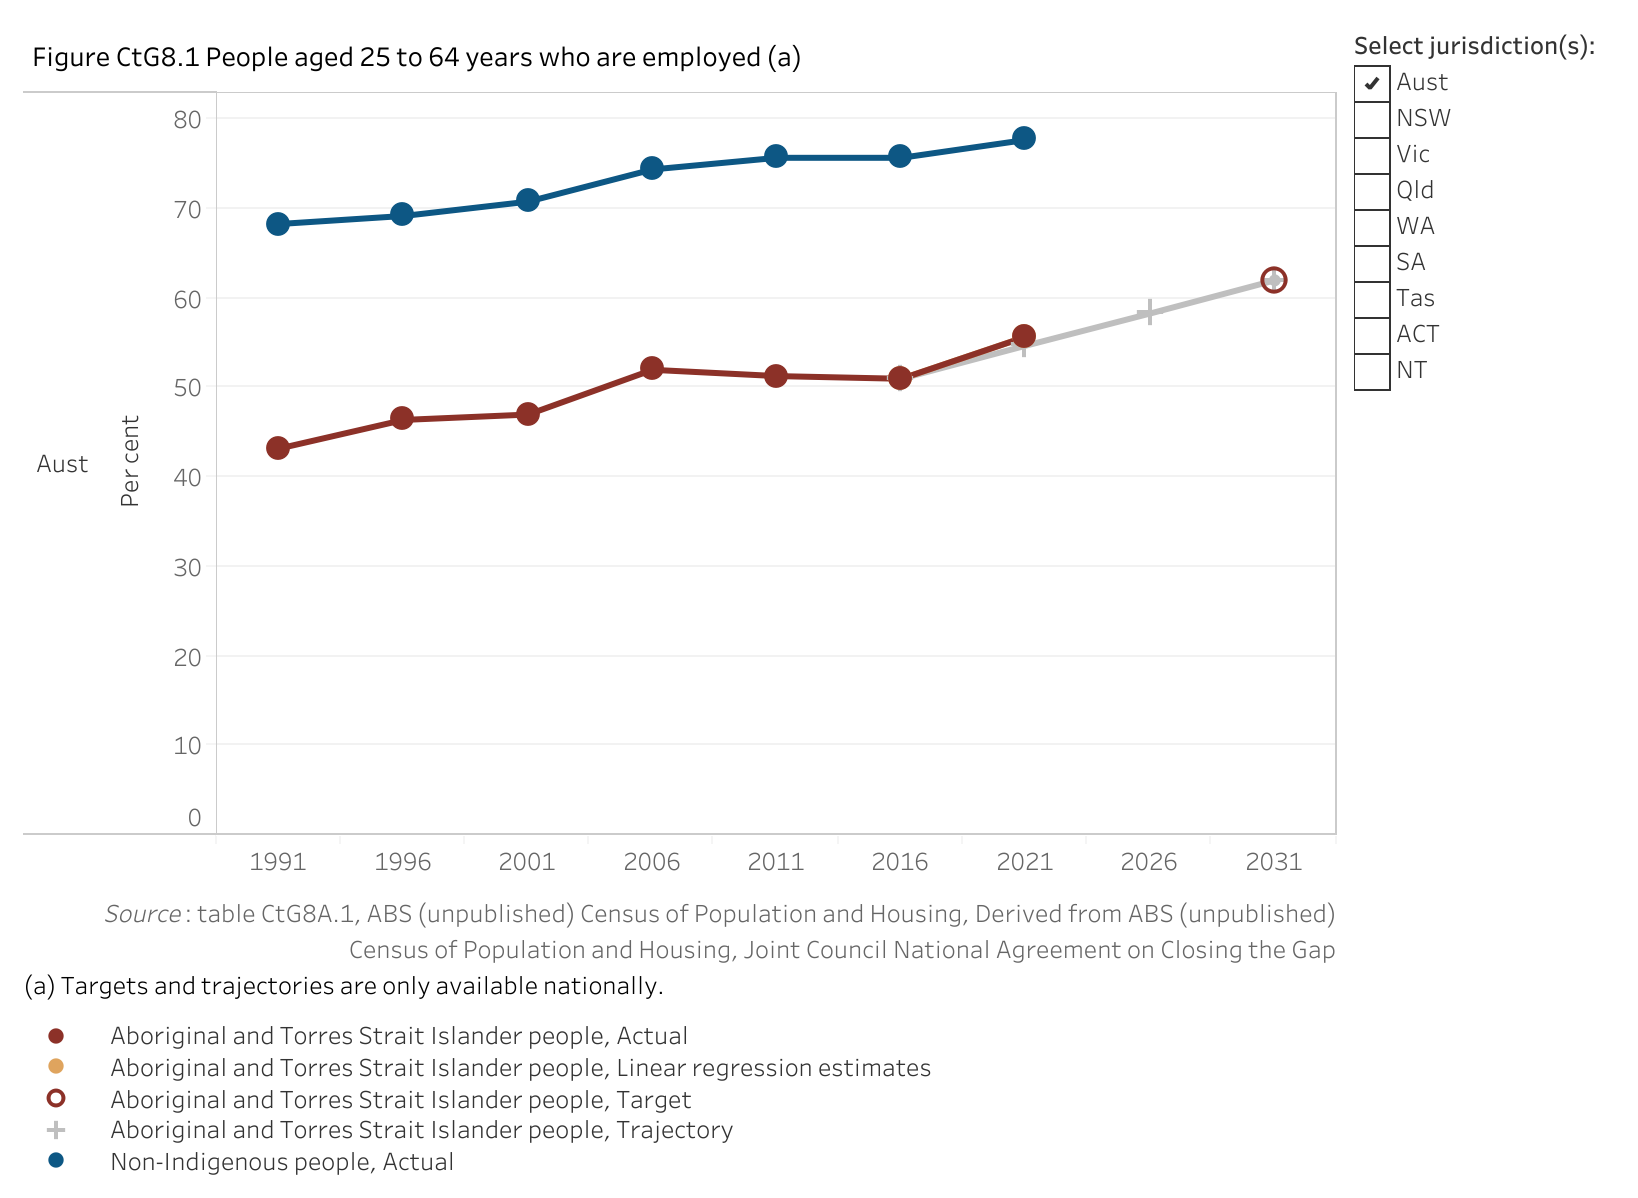
The assessment below reflects progress from the baseline (improvement, worsening or no change). For the national assessment, the target outcome shows good improvement and is on track to be met.
| NSW | Vic | Qld | WA | SA | Tas | ACT | NT | Aust | |
|---|---|---|---|---|---|---|---|---|---|
| Assessment of progress 2016 to 2021 |  | | | | | | |  |  |
improvement  no change worsening not applicable as required data not available. good improvement and target on track to be met.
  improvement but target not on track to be met.
Note: These assessments of progress should be used with caution as they are based on a limited number of data points.
Disaggregations
By sex
Nationally in 2021, a higher proportion of Aboriginal and Torres Strait Islander males aged 25–64 years were employed (57.7 per cent) compared to females (53.8 per cent) (figure CtG8.2). The proportions increased by around 4 percentage points for males and around 6 percentage points for females since the 2016 baseline year.
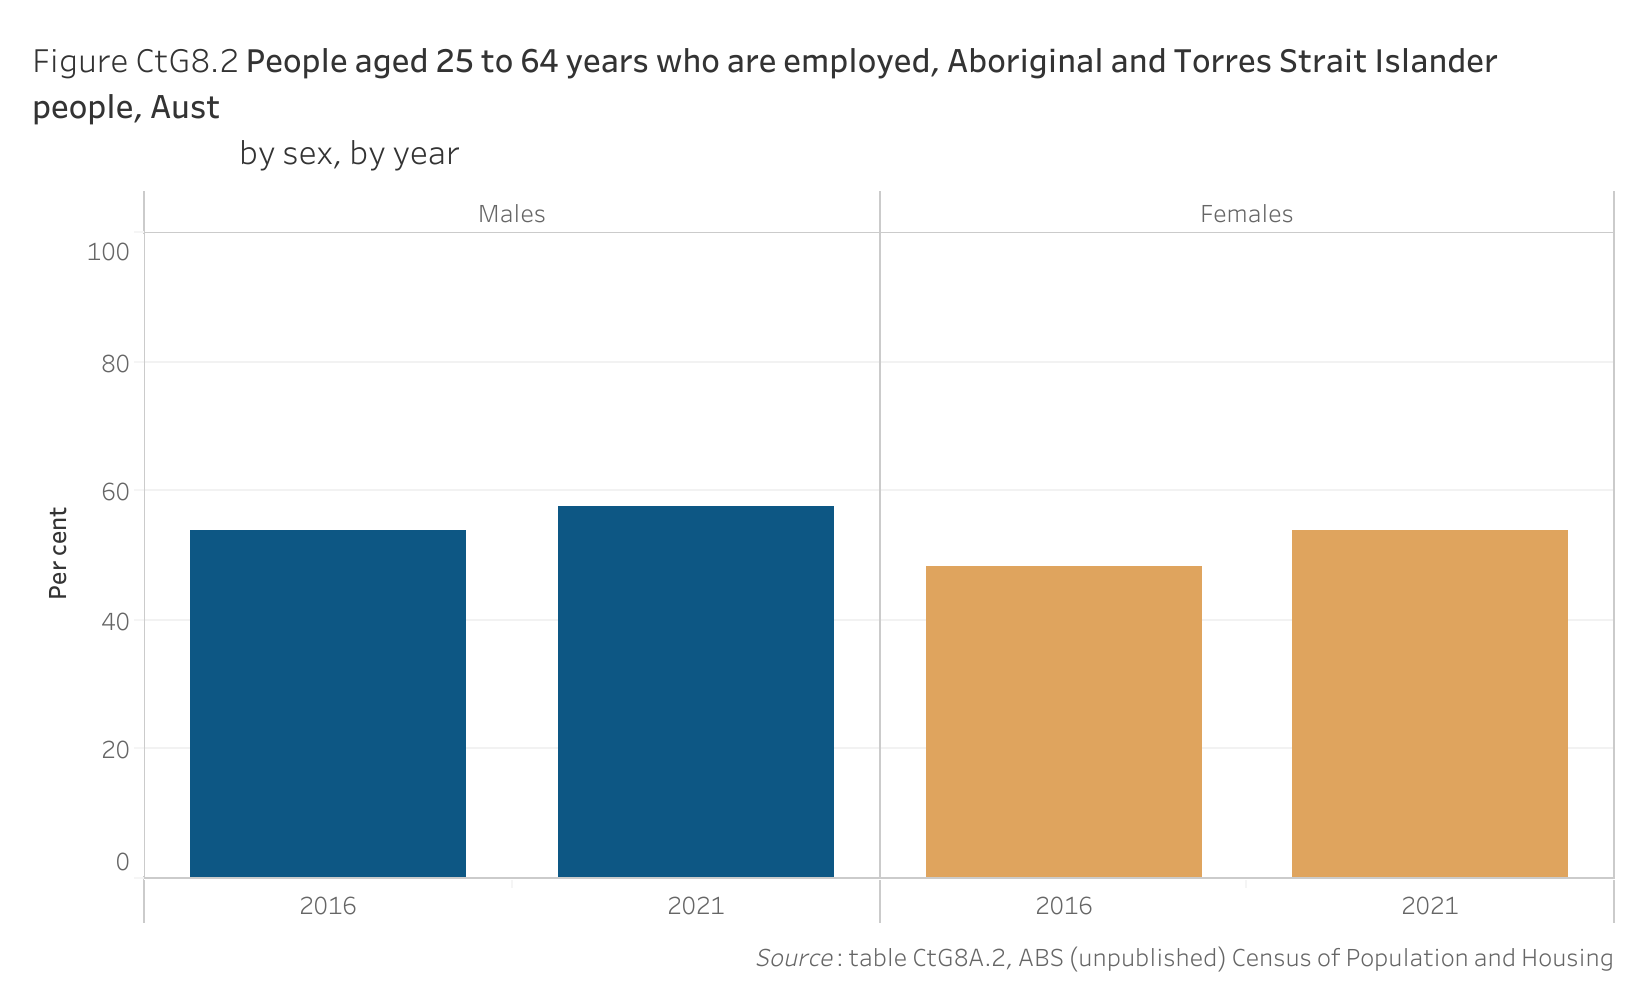
| Sex | 2016 | 2021 |
|---|---|---|
| Males | 54.0 | 57.7 |
| Females | 48.2 | 53.8 |
By age group
Nationally in 2021, the proportion of Aboriginal and Torres Strait Islander people who were employed was similar across the 5-year age groups for people aged 25 to less than 50 years (between 57.4 to 58.8 per cent). From 50 years of age the employment rate declined with each 5-year age group, down to 41.0 per cent for people aged 60-64 years (figure CtG8.3). This follows a similar pattern to the 2016 baseline year. From 2016 to 2021, the employment rate increased for all 5-year age groups.
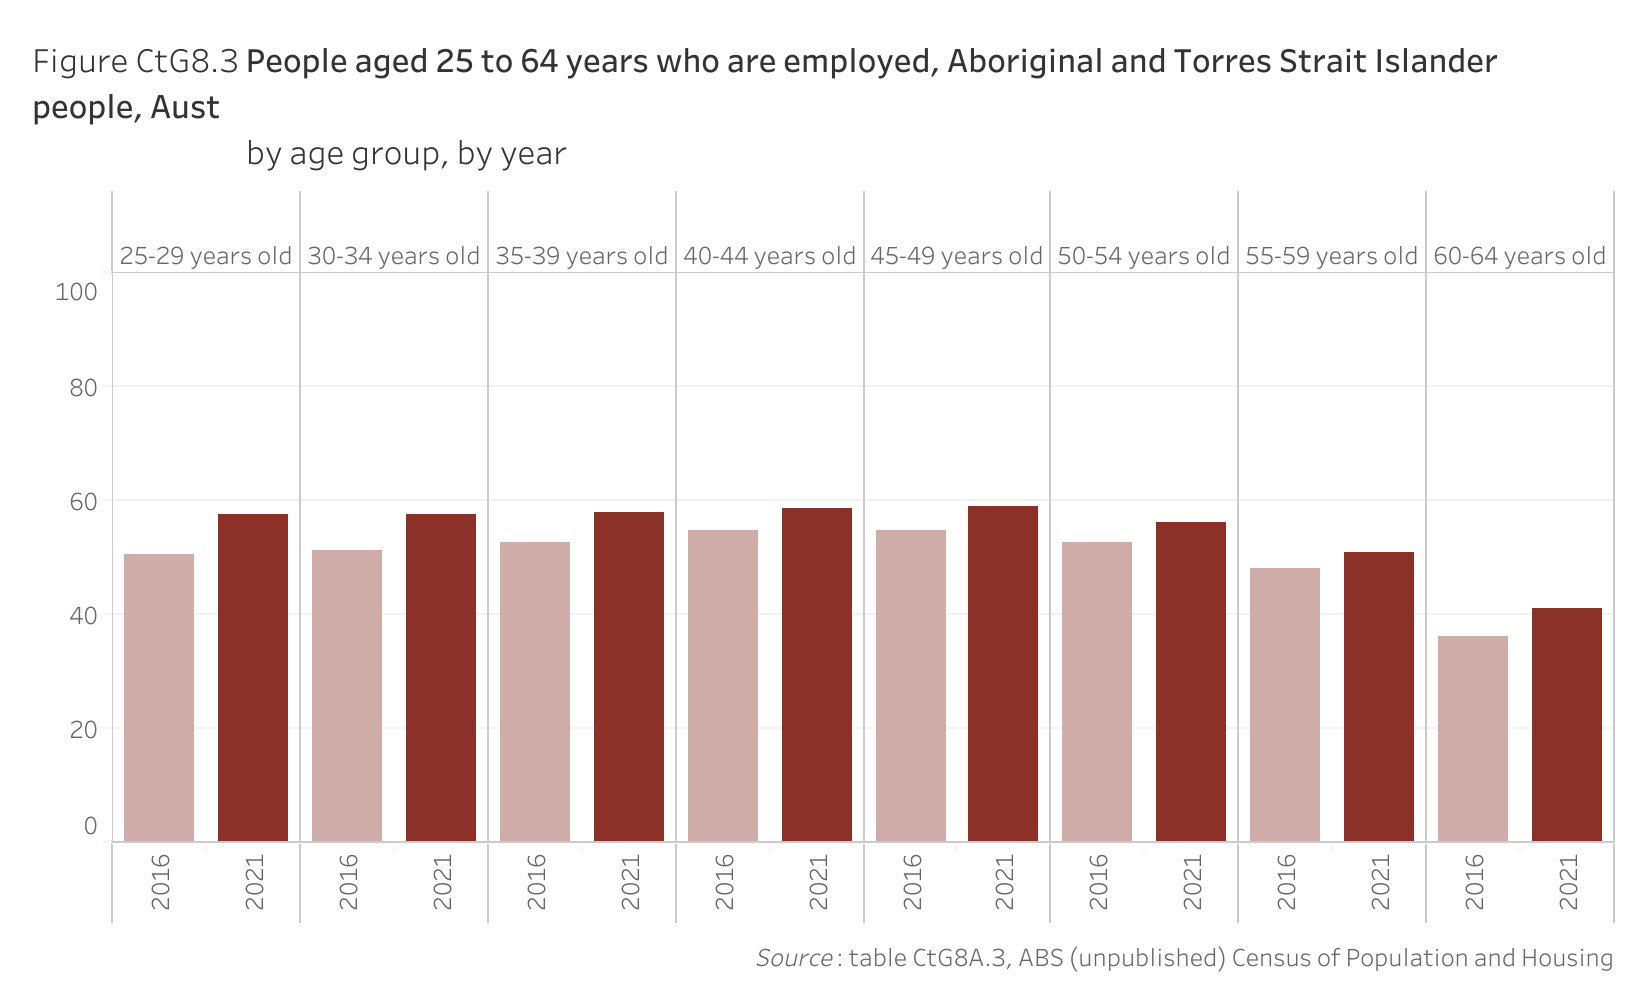
| Age | 2016 | 2021 |
|---|---|---|
| 25-29 years old | 50.4 | 57.4 |
| 30-34 years old | 51.3 | 57.6 |
| 35-39 years old | 52.5 | 57.8 |
| 40-44 years old | 54.7 | 58.6 |
| 45-49 years old | 54.8 | 58.8 |
| 50-54 years old | 52.6 | 56.0 |
| 55-59 years old | 48.1 | 50.9 |
| 60-64 years old | 36.0 | 41.0 |
By remoteness area
Nationally in 2021, the proportion of Aboriginal and Torres Strait Islander people aged 25–64 years who were employed was highest in major cities (62.1 per cent) (figure CtG8.4). The proportions declined as remoteness increased, down to 35.0 per cent for people living in very remote areas. Since the 2016 baseline year, the employment rate increased in all areas, except for people living in very remote areas where it decreased (less than one percentage point).
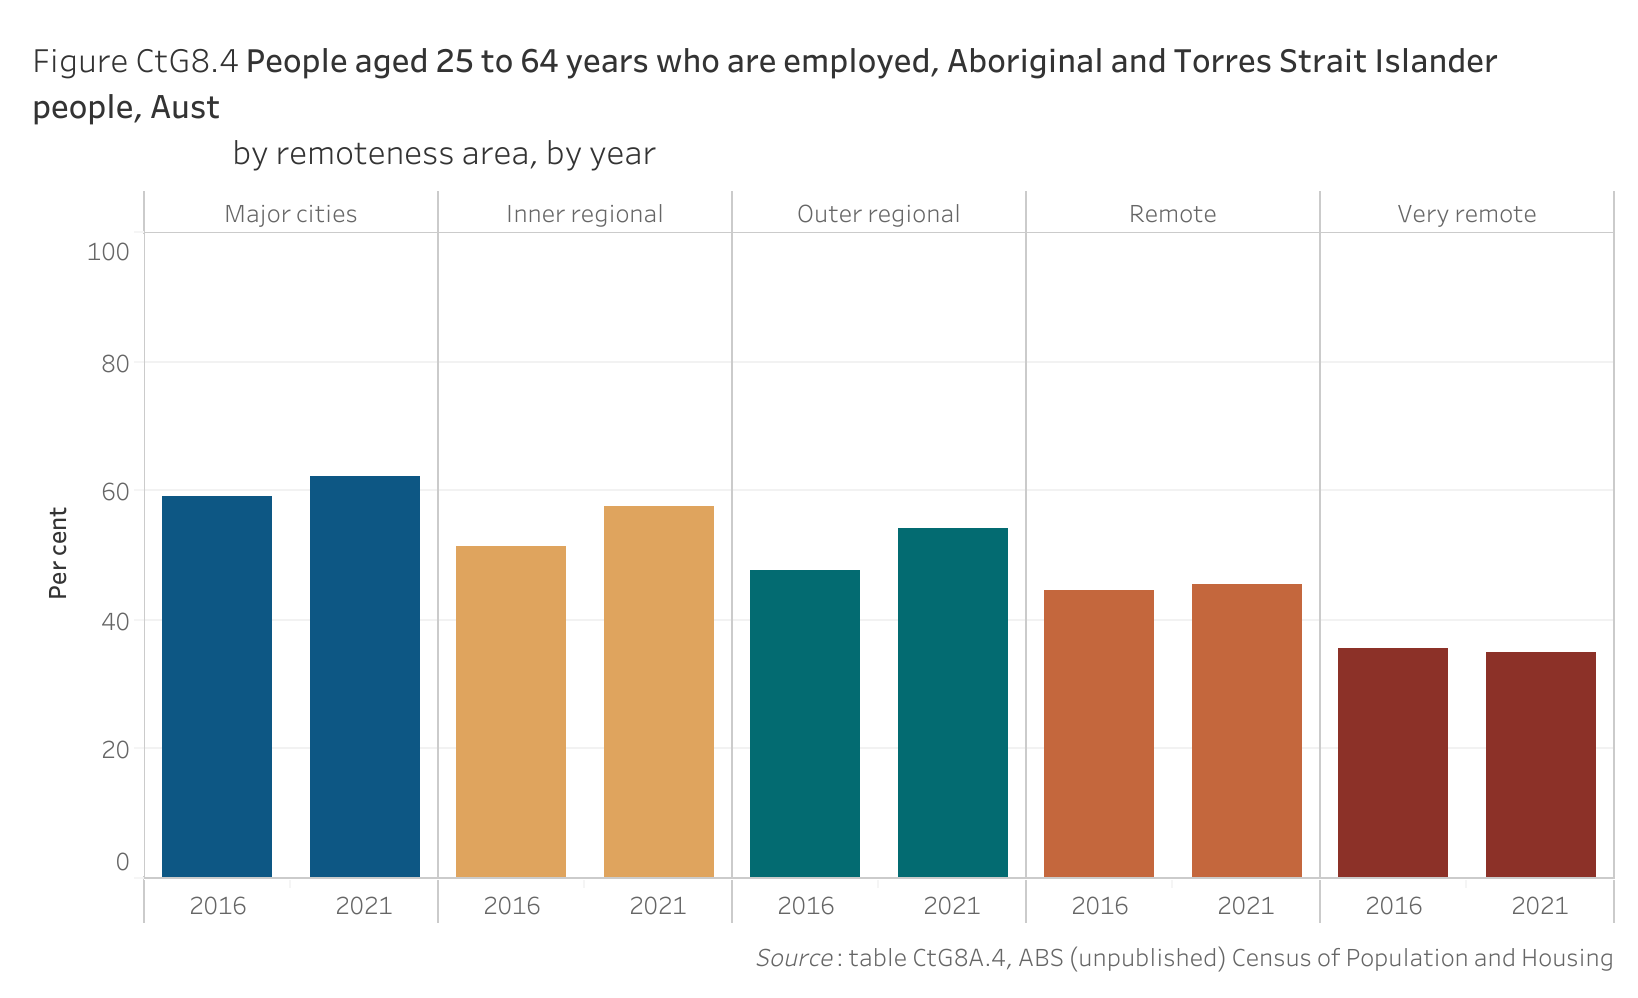
| Remoteness | 2016 | 2021 |
|---|---|---|
| Major cities | 59.0 | 62.1 |
| Inner regional | 51.4 | 57.6 |
| Outer regional | 47.7 | 54.1 |
| Remote | 44.5 | 45.5 |
| Very remote | 35.6 | 35.0 |
By Index of Relative Socioeconomic Disadvantage (IRSD) quintile
Nationally in 2021, the proportion of Aboriginal and Torres Strait Islander people aged 25–64 years who were employed was highest in the least disadvantaged socioeconomic areas of Australia (80.8 per cent) (figure CtG8.5). The proportions declined in more disadvantaged areas, down to 41.8 per cent for people living in the most disadvantaged socioeconomic areas of Australia. The proportions have increased in all socioeconomic areas since the 2016 baseline year.
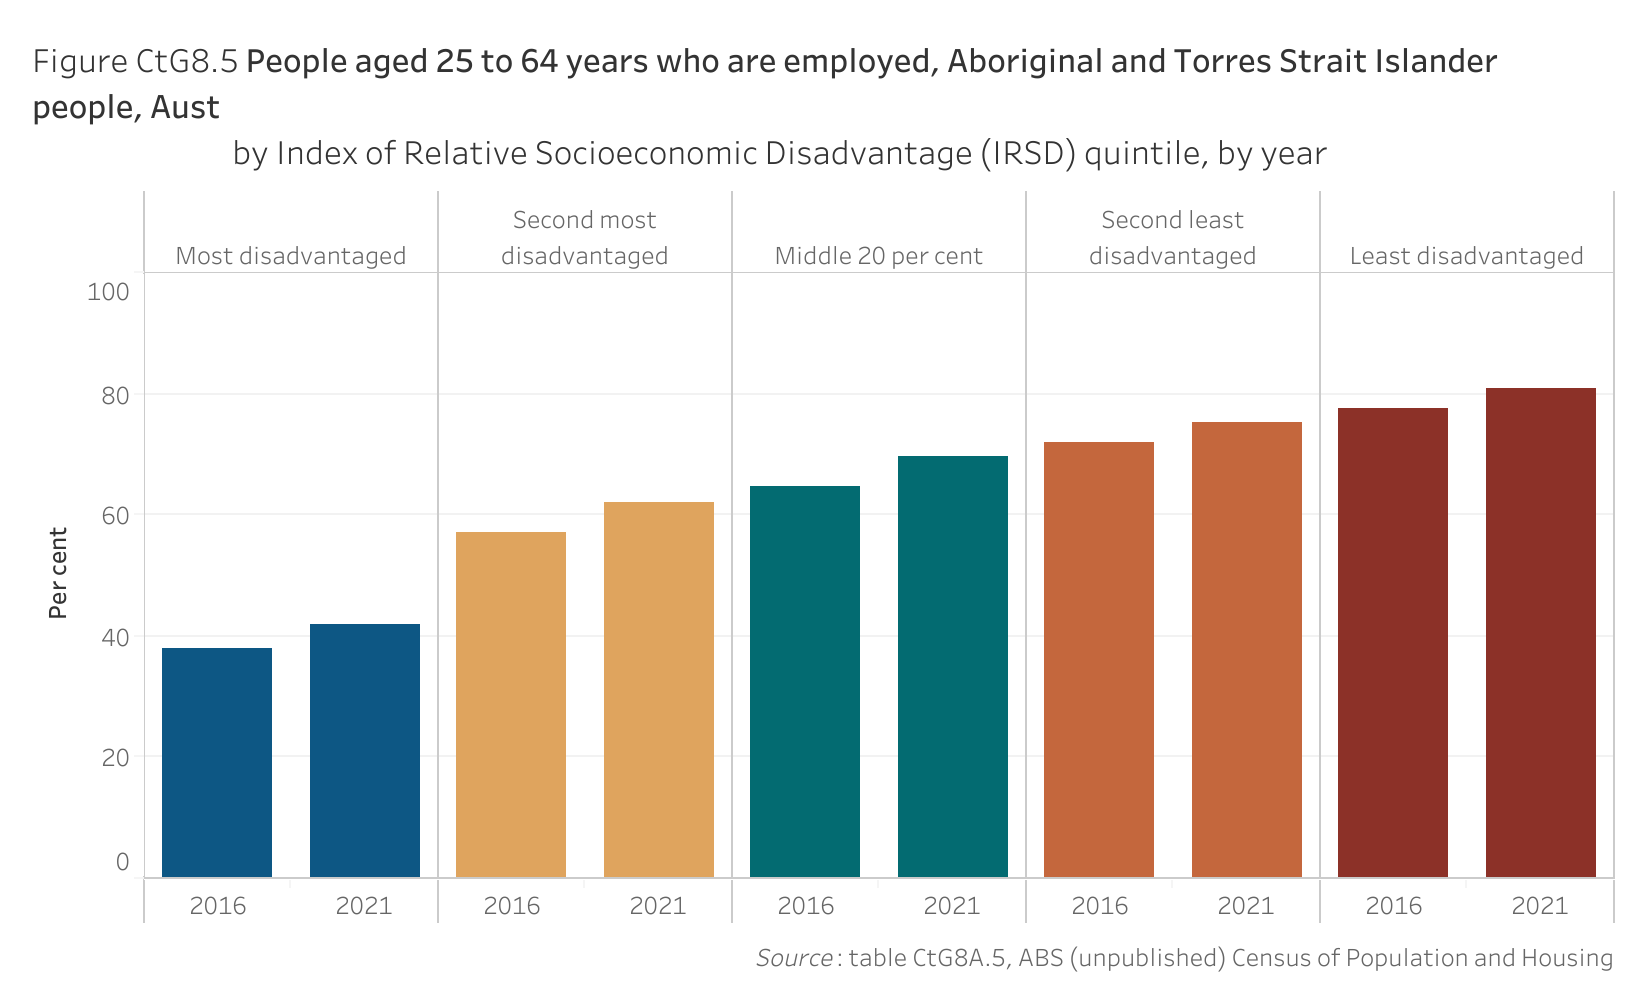
| Description4 | 2016 | 2021 |
|---|---|---|
| Most disadvantaged | 38.1 | 41.8 |
| Second most disadvantaged | 57.2 | 62.1 |
| Middle 20 per cent | 64.6 | 69.6 |
| Second least disadvantaged | 71.9 | 75.1 |
| Least disadvantaged | 77.5 | 80.8 |
By disability status
Nationally in 2021, 14.2 per cent of Aboriginal and Torres Strait Islander people aged 25–64 years with a need for assistance with core activities were employed, compared to 61.7 per cent who did not have a need for assistance (figure CtG8.6). The proportions increased by around 2 percentage points for people with a need for assistance with core activities and around 5 percentage points for persons who did not have a need for assistance, since the 2016 baseline year.
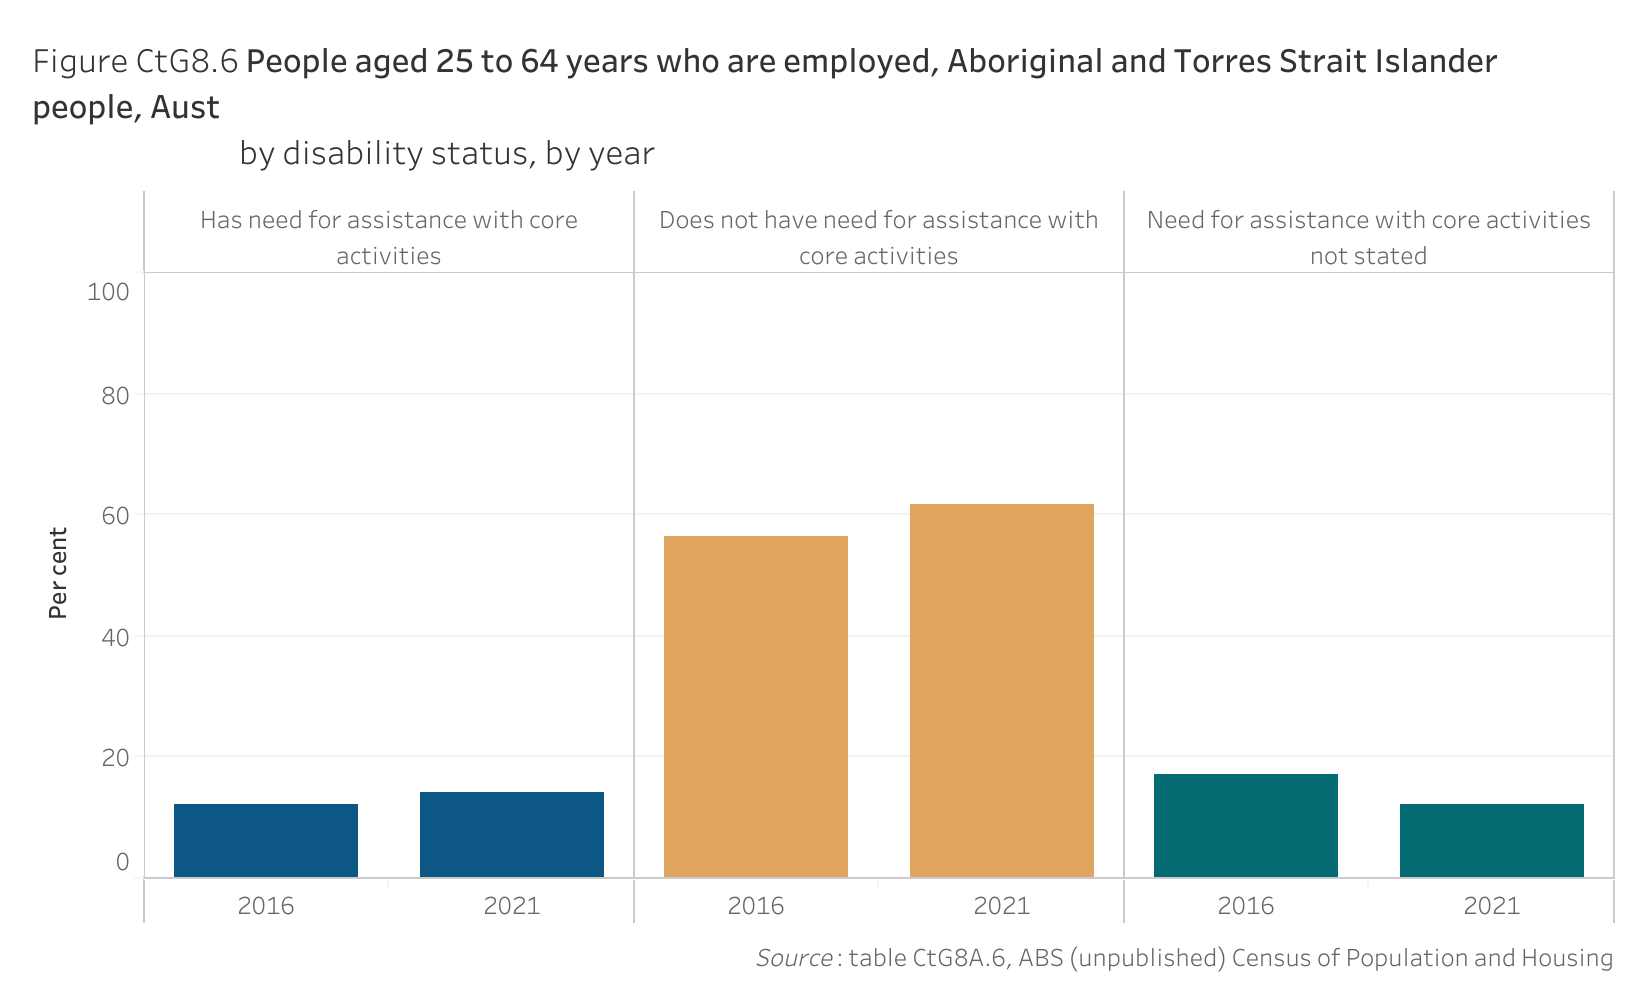
| Description4 | 2016 | 2021 |
|---|---|---|
| Has need for assistance with core activities | 12.1 | 14.2 |
| Does not have need for assistance with core activities | 56.5 | 61.7 |
| Need for assistance with core activities not stated | 17.2 | 12.1 |
By level of highest educational attainment
Nationally in 2021, the proportion of Aboriginal and Torres Strait Islander people aged 25–64 years who were employed generally increased with higher educational attainment, ranging from 25.4 per cent for those who had attained Secondary Education – Years 9 and below to 87.2 per cent for those who had obtained a qualification at the Postgraduate degree level (figure CtG8.7). This follows a similar pattern to the 2016 baseline year.
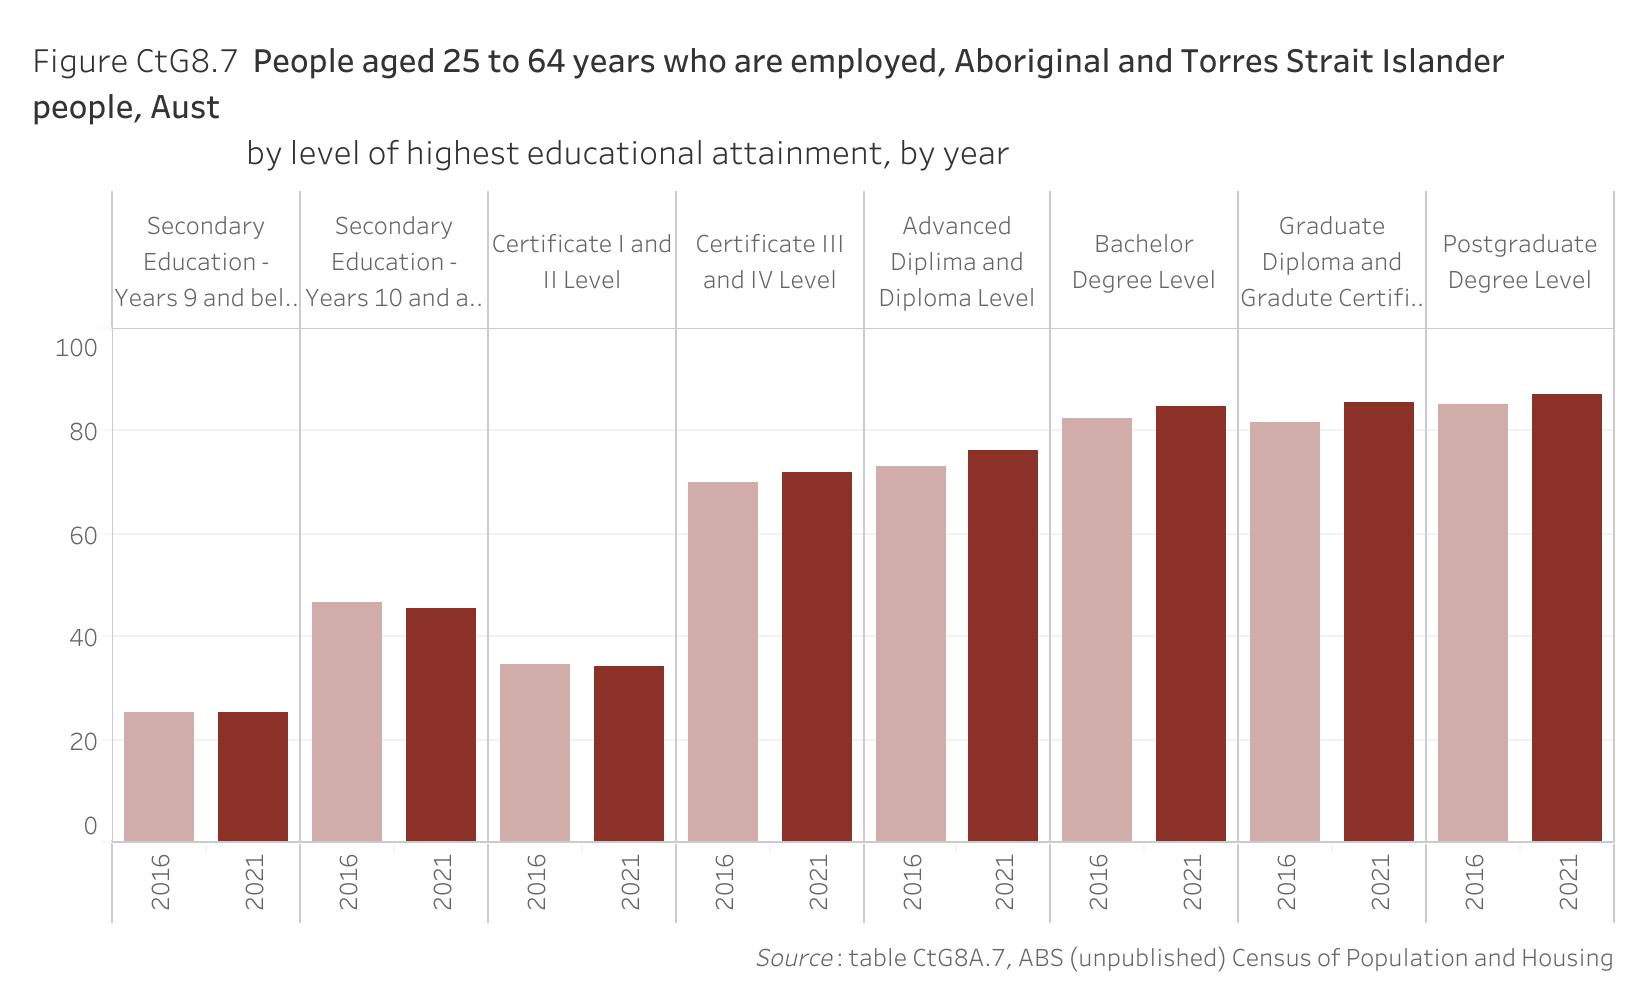
| Description4 | 2016 | 2021 |
|---|---|---|
| Secondary Education - Years 9 and below | 25.4 | 25.4 |
| Secondary Education - Years 10 and above | 46.6 | 45.4 |
| Certificate I and II Level | 34.6 | 34.2 |
| Certificate III and IV Level | 70.1 | 72.0 |
| Advanced Diplima and Diploma Level | 73.0 | 76.1 |
| Bachelor Degree Level | 82.4 | 84.8 |
| Graduate Diploma and Gradute Certificate | 81.6 | 85.5 |
| Postgraduate Degree Level | 85.3 | 87.2 |
By type of employment
Nationally in 2021, 34.0 per cent of Aboriginal and Torres Strait Islander people aged 25–64 years were employed full time (an increase of around 2 percentage points since the 2016 baseline), compared to 16.1 per cent who were employed part time (an increase of around 1 percentage point since the 2016 baseline) (table CtG8A.8). A further 5.6 per cent of Aboriginal and Torres Strait Islander people were employed and away from work (an increase of around 2 percentage points since the 2016 baseline).
Target data specifications
Outcome: | Strong economic participation and development of Aboriginal and Torres Strait Islander people and communities. |
|---|---|
Target: | By 2031, increase the proportion of Aboriginal and Torres Strait Islander people aged 25-64 who are employed to 62 per cent. |
Indicator: | The proportion of Aboriginal and Torres Strait Islander people aged 25-64 years who are employed. |
Measure: | The measure is defined as: Numerator — number of Aboriginal and Torres Strait Islander people aged 25-64 years who are employed Denominator — total number of Aboriginal and Torres Strait Islander people in the population aged 25-64 years and is presented as a percentage. |
Target established: | National Agreement on Closing the Gap July 2020 |
Latest dashboard update: | 15 June 2023 |
Indicator type: | Target |
Interpretation of change: | A high or increasing proportion is desirable. An increase from the baseline year is an improvement. |
Data source: | Name: ABS Census of Population and Housing, Census Table Builder (Basic) Frequency: Five-yearly Documentation (links): www.abs.gov.au/census |
Data provider: | Provider name: Australian Bureau of Statistics (ABS) Provider area: Census |
Baseline year: | 2016 |
Latest reporting period: | 2021 |
Target year: | 2031 |
Disaggregations: | State and territory and Australia, by Indigenous status State and territory and Australia, by Indigenous status, by sex State and territory and Australia, by Indigenous status, by remoteness area State and territory and Australia, by Indigenous status, by Index of Relative Socioeconomic Disadvantage (IRSD) quintile State and territory and Australia, by Indigenous status, by disability status State and territory and Australia, by Indigenous status, by age State and territory and Australia, by Indigenous status, by level of education State and territory and Australia, by Indigenous status, by type of employment |
Computation: | Numerator divided by Denominator multiplied by 100 Counting rules Data are for all Australian residents enumerated in the Census that reported having a usual residence in Australia. Geographical variables are based on a person’s place of usual residence (on Census night). Includes (both numerator and denominator):
Excludes (both numerator and denominator):
Disaggregations: Sex refers to a person’s biological characteristics. The 2021 Census allowed all respondents to select from three response options for the sex question: male, female and non-binary sex. Where a respondent has provided a male or female response and a non-binary sex response, the male or female response was used to determine a binary sex variable. Otherwise, sex was derived by a statistical process using random allocation.). Remoteness area is classified according to the ABS Australian Statistical Geography Standard (ASGS) using SA1 as the building block. For people with incomplete/invalid or missing address information, the ABS imputes the place of usual residence (The non-response rate at the SA1 level was 4.4 per cent in 2021.) Remoteness area disaggregations exclude ‘Migratory – Offshore – Shipping’ and ‘No usual address’. Please see the How to interpret the data page for more information. Socioeconomic status of the locality is classified according to the ABS Socio-Economic Indexes for Areas (SEIFA): Index of Relative Socio-economic Disadvantage (IRSD), using SA1 as the building block. For people with incomplete/invalid or missing address information, the ABS will impute the place of usual residence. Data are reported by IRSD quintile that are determined at the Australian level and exclude persons with unknown or unavailable SEIFA score. Some individual geographic areas were excluded from SEIFA for various reasons, such as low population or high non-response to certain Census questions. Please see the How to interpret the data page for more information. Disability is classified according to core activity need for assistance. Data are only available for people with a profound or severe core activity limitation. Disability data sourced from the Census are based on four questions to identify need for assistance and may not be fully comparable with data from other sources. See www.abs.gov.au/ausstats/abs@.nsf/mf/4431.0.55.002 for more information. (Data for people whose ‘need for assistance with core activities’ was not stated is provided for context.) Age is derived from a person’s date of birth. If date of birth is not stated, an age value is imputed by the ABS. Level of education is derived from the highest level of educational attainment, whether it be a school or non-school qualification (persons with inadequately described or not stated educational attainment have been included as a category combined with no educational attainment). Type of employment classifies employed persons as working full time (worked 35 hours or more), part time or away from work in the week prior to Census night. Persons who were employed but away from work includes persons who were employed but did not work any hours in the week prior to Census night or did not state the number of hours worked. Extraction Census Table Builder (Basic) – Employment, Income and Education: INGP X Main ASGS (UR) X LFSP X AGE5P [Disaggregations: SEXP; REMOTE (UR); IRSD; ASSNP; AGE5P; HEAP; LFSP] |
Data quality considerations: | All data values have been randomly adjusted using perturbation to avoid the release of confidential data. Proportions/rates calculated for small populations should be used with caution. In 2016 and 2021 data, people who participated in Community Development Program (CDP) received income support payments directly from the government and were not considered to be in an employer/employee relationship with their provider. They were classified as not employed unless they had a non-CDP job. |
Supporting indicators
Driver
- Highest level of educational attainment
- Long term health and disability status
- Caring responsibilities
Contextual information
- Employment by occupation
- Employment by industry
- Median equivalised gross household income
- Median personal income
- Labour force participation
- Self-managed business owners
- Progress towards parity
Material for download
- Strong economic participation and development of people and communities data tables (XLSX - 100 Kb)
- Strong economic participation and development of people and communities dataset (CSV - 176 Kb)
To assist with interpretation of the data provided (Excel data tables and CSV dataset) please refer to the target data specification above.